28mm / Blast Radius
Programming Languages
Projects that are alternatives of or similar to Blast Radius
Blast Radius
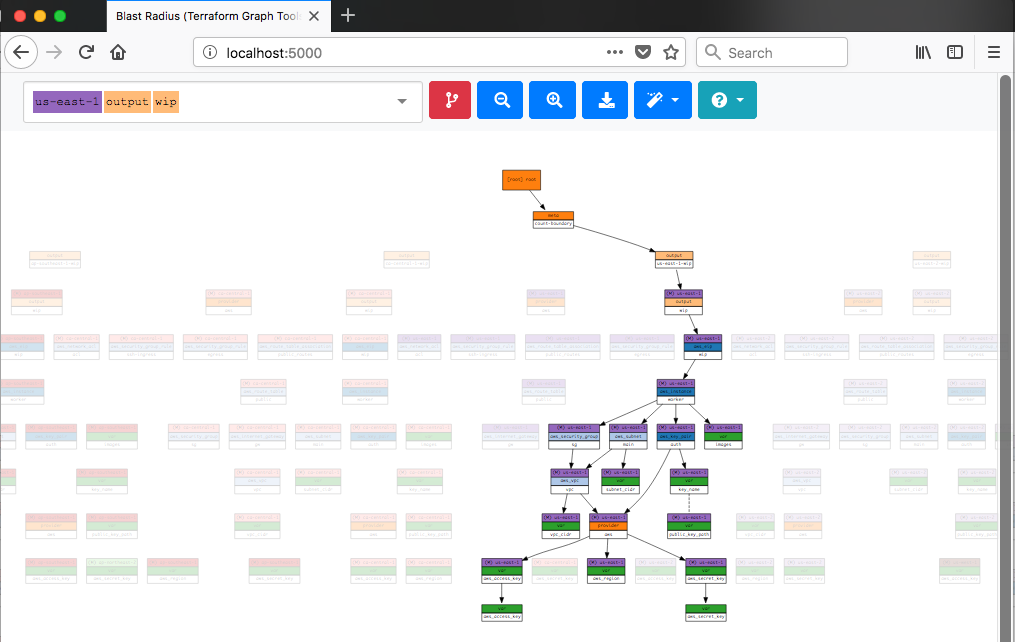
Blast Radius is a tool for reasoning about Terraform dependency graphs with interactive visualizations.
Use Blast Radius to:
- Learn about Terraform or one of its providers through real examples
- Document your infrastructure
- Reason about relationships between resources and evaluate changes to them
- Interact with the diagram below (and many others) in the docs
Prerequisites
Note: For macOS you can
brew install graphviz
Quickstart
The fastest way to get up and running with Blast Radius is to install it with
pip to your pre-existing environment:
pip install blastradius
Once installed just point Blast Radius at any initialized Terraform directory:
blast-radius --serve /path/to/terraform/directory
And you will shortly be rewarded with a browser link http://127.0.0.1:5000/.
Docker
To launch Blast Radius for a local directory by manually running:
docker run --rm -it -p 5000:5000 \
  -v $(pwd):/data:ro \
  --security-opt apparmor:unconfined \
  --cap-add=SYS_ADMIN \
  28mm/blast-radius
A slightly more customized variant of this is also available as an example docker-compose.yml usecase for Workspaces.
Docker configurations
Terraform module links are saved as absolute paths in relative to the
project root (note .terraform/modules/<uuid>). Given these paths will vary
betwen Docker and the host, we mount the volume as read-only, assuring we don't
ever interfere with your real environment.
However, in order for Blast Radius to actually work with Terraform, it needs
to be initialized. To accomplish this, the container creates an overlayfs
that exists within the container, overlaying your own, so that it can operate
independently. To do this, certain runtime privileges are required --
specifically --cap-add=SYS_ADMIN.
For more information on how this works and what it means for your host, check out the runtime privileges documentation.
Docker & Subdirectories
If you organized your Terraform project using stacks and modules,
Blast Radius must be called from the project root and reference them as
subdirectories -- don't forget to prefix --serve!
For example, let's create a Terraform project with the following:
$ tree -d
`-- project/
    |-- modules/
    |   |-- foo
    |   |-- bar
    |   `-- dead
    `-- stacks/
        `-- beef/
             `-- .terraform
It consists of 3 modules foo, bar and dead, followed by one beef stack.
To apply Blast Radius to the beef stack, you would want to run the container
with the following:
$ cd project
$ docker run --rm -it -p 5000:5000 \
    -v $(pwd):/data:ro \
    --security-opt apparmor:unconfined \
    --cap-add=SYS_ADMIN \
    28mm/blast-radius --serve stacks/beef
Embedded Figures
You may wish to embed figures produced with Blast Radius in other documents. You will need the following:
- An
svgfile andjsondocument representing the graph and its layout. -
javascriptandcssfound in.../blastradius/server/static - A uniquely identified DOM element, where the
<svg>should appear.
You can read more details in the documentation
Implementation Details
Blast Radius uses the [Graphviz][] package to layout graph diagrams, PyHCL to parse Terraform configuration, and d3.js to implement interactive features and animations.
Further Reading
The development of Blast Radius is documented in a series of blog posts:
- part 1: motivations, d3 force-directed layouts vs. vanilla graphviz.
- part 2: d3-enhanced graphviz layouts, meaningful coloration, animations.
- part 3: limiting horizontal sprawl, supporting modules.
- part 4: search, pan/zoom, prune-to-selection, docker.
A catalog of example Terraform configurations, and their dependency graphs can be found here.
- AWS two-tier architecture
- AWS networking (featuring modules)
- Google two-tier architecture
- Azure load-balancing with 2 vms
These examples are drawn primarily from the examples/ directory distributed
with various Terraform providers, and aren't necessarily ideal. Additional
examples, particularly demonstrations of best-practices, or of multi-cloud
configurations strongly desired.

