All Projects → spotify → Chartify

spotify / Chartify

Licence: apache-2.0
Python library that makes it easy for data scientists to create charts.

Programming Languages

python
139335 projects - #7 most used programming language
Makefile
30231 projects

Projects that are alternatives of or similar to Chartify

Bokeh
Interactive Data Visualization in the browser, from Python
Stars: ✭ 15,822 (+418.07%)
Mutual labels:  plotting, plots, bokeh
Unicodeplots.jl
Unicode-based scientific plotting for working in the terminal
Stars: ✭ 724 (-76.29%)
Mutual labels:  plotting, plots
Clip
Create charts from the command line
Stars: ✭ 5,111 (+67.35%)
Mutual labels:  plotting, plots
Bubbly
A python package for plotting animated and interactive bubble charts using Plotly
Stars: ✭ 37 (-98.79%)
Mutual labels:  data-science, plotting
Orange3
🍊 📊 💡 Orange: Interactive data analysis
Stars: ✭ 3,152 (+3.21%)
Mutual labels:  data-science, plotting
Matplotplusplus
Matplot++: A C++ Graphics Library for Data Visualization 📊🗾
Stars: ✭ 2,433 (-20.33%)
Mutual labels:  data-science, plots
Ggnet
GG.Net Data Visualization
Stars: ✭ 45 (-98.53%)
Mutual labels:  plotting, plots
btplotting
btplotting provides plotting for backtests, optimization results and live data from backtrader.
Stars: ✭ 159 (-94.79%)
Mutual labels:  bokeh, plotting
Tablesaw
Java dataframe and visualization library
Stars: ✭ 2,785 (-8.81%)
Mutual labels:  data-science, plotting
Scikit Plot
An intuitive library to add plotting functionality to scikit-learn objects.
Stars: ✭ 2,162 (-29.21%)
Mutual labels:  data-science, plotting
Chia-Plot-Status
GUI Tool for beginners and experts to Monitor and Analyse Chia Plotting log files, show health and progress of running plots and estimated time to completion. No setup, configuration or installation of python or whatever required. Just install and enjoy.
Stars: ✭ 187 (-93.88%)
Mutual labels:  plots, plotting
The-Data-Visualization-Workshop
A New, Interactive Approach to Learning Data Visualization
Stars: ✭ 59 (-98.07%)
Mutual labels:  plots, bokeh
Dirty cat
Encoding methods for dirty categorical variables
Stars: ✭ 259 (-91.52%)
Mutual labels:  data-science
R4ds
R for data science: a book
Stars: ✭ 3,231 (+5.8%)
Mutual labels:  data-science
Matplotlib Venn
Area-weighted venn-diagrams for Python/matplotlib
Stars: ✭ 260 (-91.49%)
Mutual labels:  plotting
Polyaxon
Machine Learning Platform for Kubernetes (MLOps tools for experimentation and automation)
Stars: ✭ 2,966 (-2.88%)
Mutual labels:  data-science
Notebooks Statistics And Machinelearning
Jupyter Notebooks from the old UnsupervisedLearning.com (RIP) machine learning and statistics blog
Stars: ✭ 270 (-91.16%)
Mutual labels:  data-science
Shogun
Shōgun
Stars: ✭ 2,859 (-6.39%)
Mutual labels:  data-science
Plottable
📊 A library of modular chart components built on D3
Stars: ✭ 2,834 (-7.2%)
Mutual labels:  plots
Dowhy
DoWhy is a Python library for causal inference that supports explicit modeling and testing of causal assumptions. DoWhy is based on a unified language for causal inference, combining causal graphical models and potential outcomes frameworks.
Stars: ✭ 3,480 (+13.95%)
Mutual labels:  data-science

Chartify

status release python CI

Chartify is a Python library that makes it easy for data scientists to create charts.

Why use Chartify?

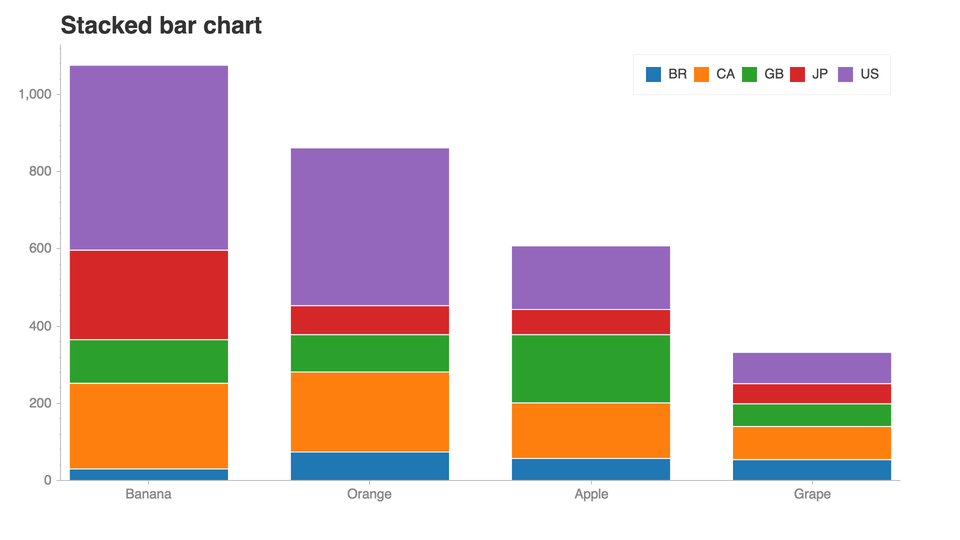
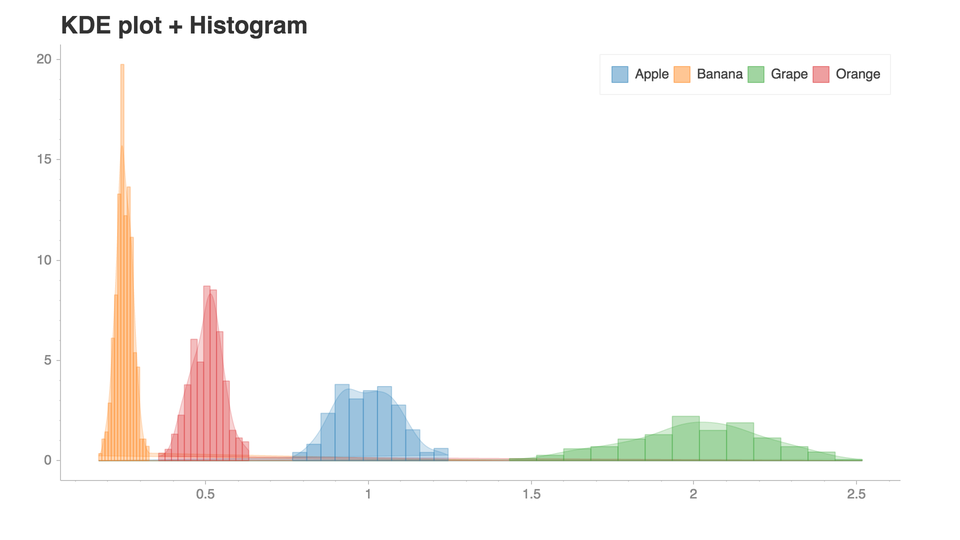
  • Consistent input data format: Spend less time transforming data to get your charts to work. All plotting functions use a consistent tidy input data format.
  • Smart default styles: Create pretty charts with very little customization required.
  • Simple API: We've attempted to make the API as intuitive and easy to learn as possible.
  • Flexibility: Chartify is built on top of Bokeh, so if you do need more control you can always fall back on Bokeh's API.

Examples

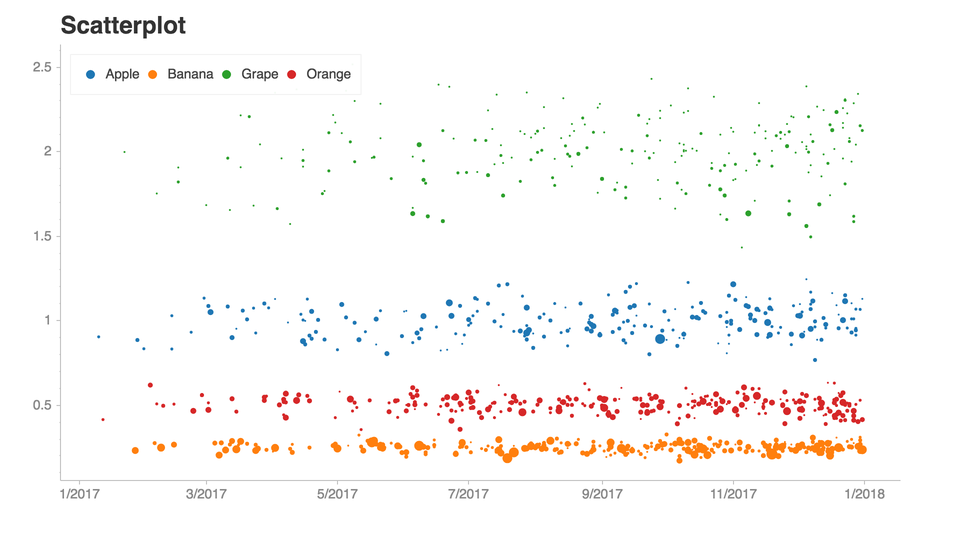
https://raw.githubusercontent.com/spotify/chartify/master/docs/_static/chartify1.png

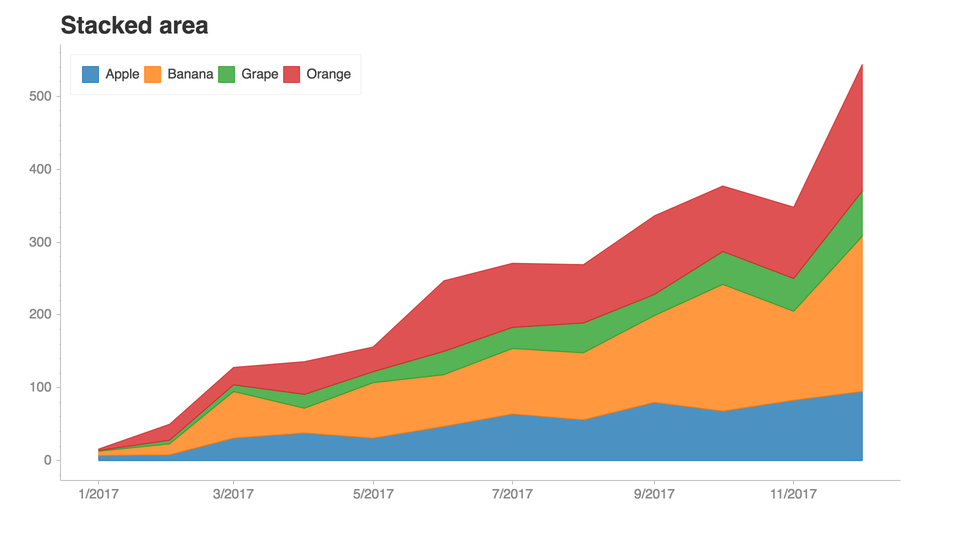
https://raw.githubusercontent.com/spotify/chartify/master/docs/_static/chartify2.png

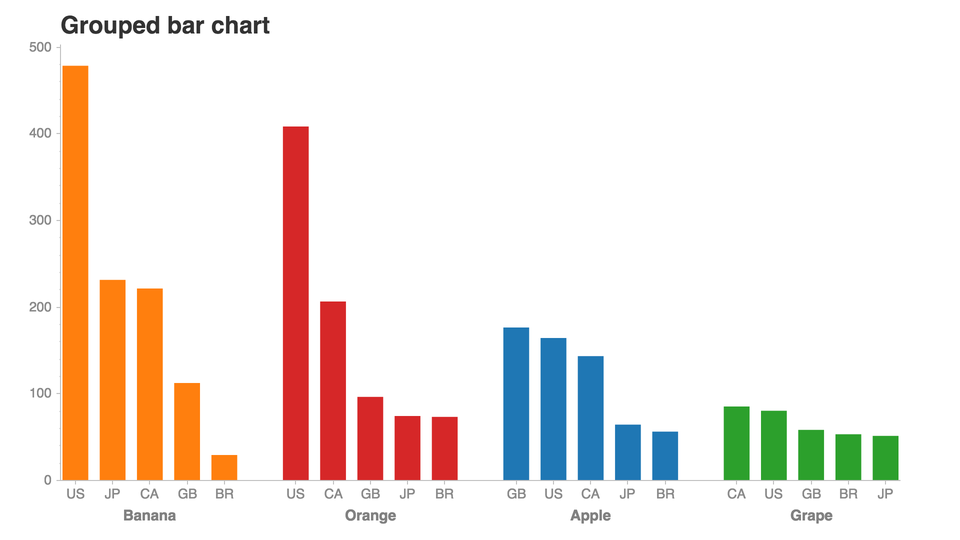
https://raw.githubusercontent.com/spotify/chartify/master/docs/_static/chartify3.png

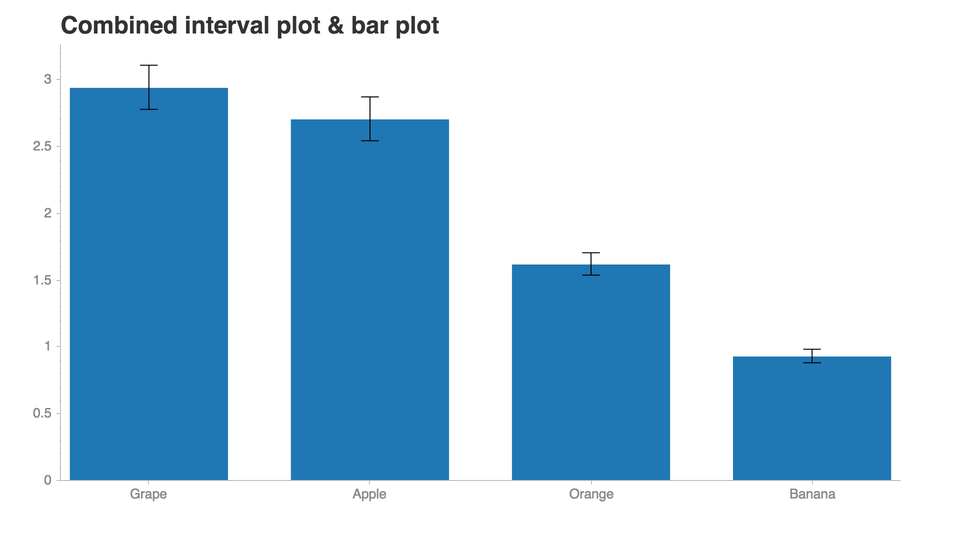
https://raw.githubusercontent.com/spotify/chartify/master/docs/_static/chartify4.png

https://raw.githubusercontent.com/spotify/chartify/master/docs/_static/chartify5.png

https://raw.githubusercontent.com/spotify/chartify/master/docs/_static/chartify6.png

See this notebook for more examples!.

Installation

  1. Chartify can be installed via pip:

pip3 install chartify

  1. Install chromedriver requirement (Optional. Needed for PNG output):
    • Install google chrome.
    • Download the appropriate version of chromedriver for your OS here.
    • Copy the executable file to a directory within your PATH.
      • View directorys in your PATH variable: echo $PATH
      • Copy chromedriver to the appropriate directory, e.g.: cp chromedriver /usr/local/bin

Getting started

This tutorial notebook is the best place to get started with a guided tour of the core concepts of Chartify.

From there, check out the example notebook for a list of all the available plots.

Docs

Documentation available on chartify.readthedocs.io

Getting support

Join #chartify on spotify-foss.slack.com (Get an invite)

Use the chartify tag on StackOverflow.

Code of Conduct

This project adheres to the Open Code of Conduct. By participating, you are expected to honor this code.

Contributing

See the contributing docs.

Note that the project description data, including the texts, logos, images, and/or trademarks, for each open source project belongs to its rightful owner. If you wish to add or remove any projects, please contact us at [email protected].