SebKrantz / Collapse
Programming Languages
Labels
Projects that are alternatives of or similar to Collapse
collapse 

![]()
![]()
![]()
collapse is a C/C++ based package for data transformation and statistical computing in R. It's aims are:
- To facilitate complex data transformation, exploration and computing tasks in R.
- To help make R code fast, flexible, parsimonious and programmer friendly.
It is made compatible with base R, dplyr, data.table and the plm approach to panel data, and non-destructively handles other matrix or data frame based classes (such as 'ts', 'xts' / 'zoo', 'timeSeries', 'tsibble', 'tibbletime', 'sf' data frames etc.).
Key Features:
-
Advanced statistical programming: A full set of fast statistical functions supporting grouped and weighted computations on vectors, matrices and data frames. Fast and programmable grouping, ordering, unique values / rows, factor generation and interactions. Fast and flexible functions for data manipulation and data object conversions.
-
Advanced aggregation: Fast and easy multi-data-type, multi-function, weighted, parallelized and fully customized data aggregation.
-
Advanced transformations: Fast row / column arithmetic, (grouped) replacing and sweeping out of statistics, (grouped, weighted) scaling / standardizing, between (averaging) and (quasi-)within (centering / demeaning) transformations, higher-dimensional centering (i.e. multiple fixed effects transformations), linear prediction / partialling-out, linear model fitting and testing.
-
Advanced time-computations: Fast (sequences of) lags / leads, and (lagged / leaded, iterated, quasi-, log-) differences and (compounded) growth rates on (unordered, irregular) time series and panel data. Multivariate auto-, partial- and cross-correlation functions for panel data. Panel data to (ts-)array conversions.
-
List processing: (Recursive) list search / identification, splitting, extraction / subsetting, data-apply, and generalized recursive row-binding / unlisting in 2D.
-
Advanced data exploration: Fast (grouped, weighted, panel-decomposed) summary statistics for complex multilevel / panel data.
collapse is mainly coded in C++ and built with Rcpp, but also uses C/C++ functions from data.table, fixest, weights, RcppArmadillo, RcppEigen and stats. Effort has been expended to minimize the execution speed of R code employed.
Installation
# Install the current version on CRAN
install.packages("collapse")

# Install a previous version from the CRAN Archive (Requires Rtools)
install.packages("https://cran.r-project.org/src/contrib/Archive/collapse/collapse_1.4.2.tar.gz", repos = NULL, type = "source")

# Install a stable development version from Github (Requires Rtools)
remotes::install_github("SebKrantz/collapse")
Documentation
collapse installs with a built-in structured documentation, implemented via a set of separate help pages. Calling help('collapse-documentation') from the R console brings up the the top-level documentation page, which provides an overview of the entire functionality of the package and links to all other documentation pages.
In addition, collapse provides 4 vignettes (available online):
-
Introduction to collapse: Introduces all main features of the package in a structured way.
-
collapse and dplyr: Demonstrates the integration of collapse with dplyr / tidyverse workflows and associated performance improvements.
-
collapse and plm: Demonstrates the integration of collapse with the plm package and provides examples of fast and easy programming with panel data.
-
collapse and data.table: Shows how collapse and data.table may be used together in a harmonious way.
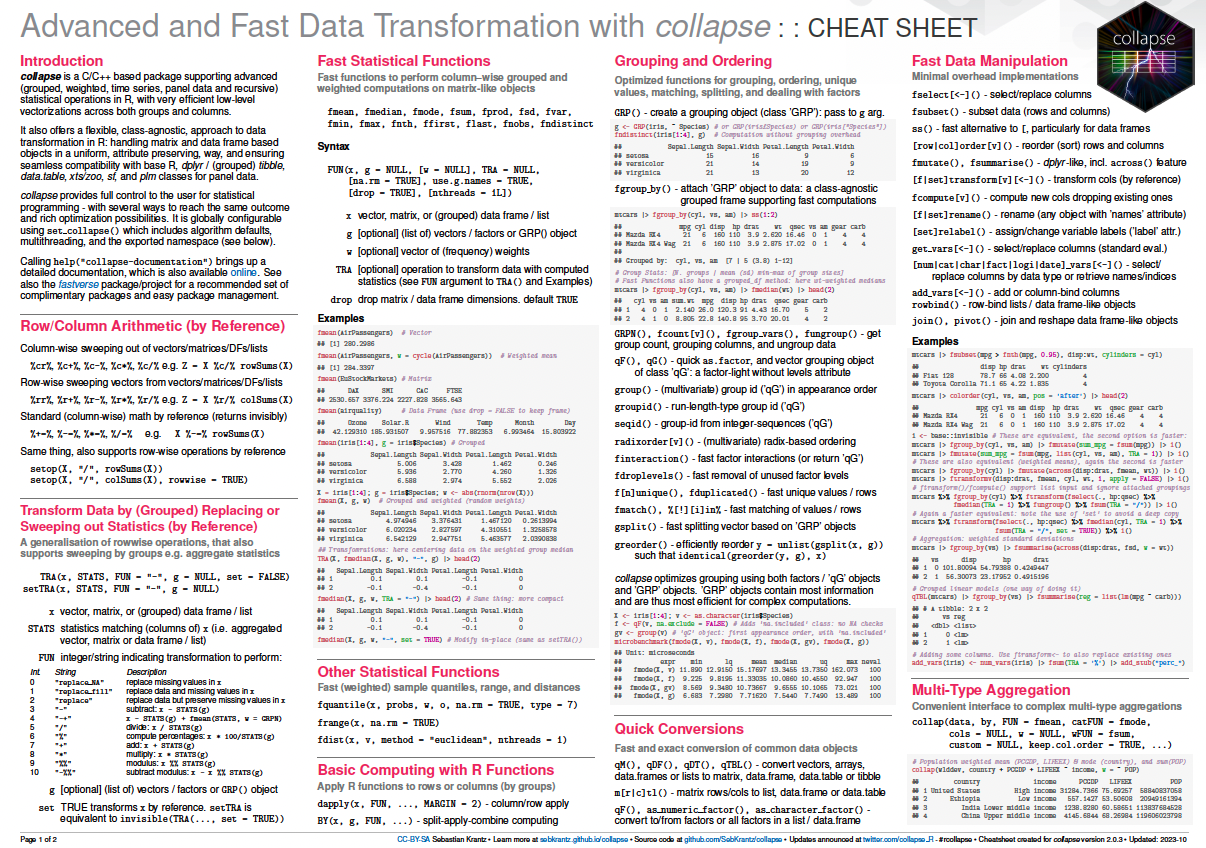
Cheatsheet
Example Usage
This provides a simple set of examples introducing some important features of collapse. It should be easy to follow for readers familiar with R.
Click here to expand
library(collapse)
data("iris")            # iris dataset in base R
v <- iris$Sepal.Length  # Vector
d <- num_vars(iris)     # Saving numeric variables (could also be a matrix, statistical functions are S3 generic)
g <- iris$Species       # Grouping variable (could also be a list of variables)

## Advanced Statistical Programming -----------------------------------------------------------------------------

# Simple (column-wise) statistics...
fmedian(v)                       # Vector
fsd(qM(d))                       # Matrix (qM is a faster as.matrix)
fmode(d)                         # data.frame
fmean(qM(d), drop = FALSE)       # Still a matrix
fmax(d, drop = FALSE)            # Still a data.frame

# Fast grouped and/or weighted statistics
w <- abs(rnorm(fnrow(iris)))
fmedian(d, w = w)                 # Simple weighted statistics
fnth(d, 0.75, g)                  # Grouped statistics (grouped third quartile)
fmedian(d, g, w)                  # Groupwise-weighted statistics
fsd(v, g, w)                      # Similarly for vectors
fmode(qM(d), g, w, ties = "max")  # Or matrices (grouped and weighted maximum mode) ...

# A fast set of data manipulation functions allows complex piped programming at high speeds
library(magrittr)                            # Pipe operators
iris %>% fgroup_by(Species) %>% fNdistinct   # Grouped distinct value counts
iris %>% fgroup_by(Species) %>% fmedian(w)   # Weighted group medians
iris %>% add_vars(w) %>%                     # Adding weight vector to dataset
  fsubset(Sepal.Length < fmean(Sepal.Length), Species, Sepal.Width:w) %>% # Fast selecting and subsetting
  fgroup_by(Species) %>%                     # Grouping (efficiently creates a grouped tibble)
  fvar(w) %>%                                # Frequency-weighted group-variance, default (keep.w = TRUE)
  roworder(sum.w)                            # also saves group weights in a column called 'sum.w'

# Can also use dplyr (but dplyr manipulation verbs are a lot slower)
library(dplyr)
iris %>% add_vars(w) %>%
  filter(Sepal.Length < fmean(Sepal.Length)) %>%
  select(Species, Sepal.Width:w) %>%
  group_by(Species) %>%
  fvar(w) %>% arrange(sum.w)

## Advanced Aggregation -----------------------------------------------------------------------------------------

collap(iris, Sepal.Length + Sepal.Width ~ Species, fmean)  # Simple aggregation using the mean..
collap(iris, ~ Species, list(fmean, fmedian, fmode))       # Multiple functions applied to each column
add_vars(iris) <- w                                        # Adding weights, return in long format..
collap(iris, ~ Species, list(fmean, fmedian, fmode), w = ~ w, return = "long")

# Generate some additional logical data
settransform(iris, AWMSL = Sepal.Length > fmedian(Sepal.Length, w = w),
                   AWMSW = Sepal.Width > fmedian(Sepal.Width, w = w))

# Multi-type data aggregation: catFUN applies to all categorical columns (here AMWSW)
collap(iris, ~ Species + AWMSL, list(fmean, fmedian, fmode),
       catFUN = fmode, w = ~ w, return = "long")

# Custom aggregation gives the greatest possible flexibility: directly mapping functions to columns
collap(iris, ~ Species + AWMSL,
       custom = list(fmean = 2:3, fsd = 3:4, fmode = "AWMSL"), w = ~ w,
       wFUN = list(fsum, fmin, fmax), # Here also aggregating the weight vector with 3 different functions
       keep.col.order = FALSE)        # Column order not maintained -> grouping and weight variables first

# Can also use grouped tibble: weighted median for numeric, weighted mode for categorical columns
iris %>% fgroup_by(Species, AWMSL) %>% collapg(fmedian, fmode, w = w)

## Advanced Transformations -------------------------------------------------------------------------------------

# All Fast Statistical Functions have a TRA argument, supporting 10 different replacing and sweeping operations
fmode(d, TRA = "replace")     # Replacing values with the mode
fsd(v, TRA = "/")             # dividing by the overall standard deviation (scaling)
fsum(d, TRA = "%")            # Computing percentages
fsd(d, g, TRA = "/")          # Grouped scaling
fmin(d, g, TRA = "-")         # Setting the minimum value in each species to 0
ffirst(d, g, TRA = "%%")      # Taking modulus of first value in each species
fmedian(d, g, w, "-")         # Groupwise centering by the weighted median
fnth(d, 0.95, g, w, "%")      # Expressing data in percentages of the weighted species-wise 95th percentile
fmode(d, g, w, "replace",     # Replacing data by the species-wise weighted minimum-mode
      ties = "min")

# TRA() can also be called directly to replace or sweep with a matching set of computed statistics
TRA(v, sd(v), "/")                       # Same as fsd(v, TRA = "/")
TRA(d, fmedian(d, g, w), "-", g)         # Same as fmedian(d, g, w, "-")
TRA(d, BY(d, g, quantile, 0.95), "%", g) # Same as fnth(d, 0.95, g, TRA = "%") (apart from quantile algorithm)

# For common uses, there are some faster and more advanced functions
fbetween(d, g)                           # Grouped averaging [same as fmean(d, g, TRA = "replace") but faster]
fwithin(d, g)                            # Grouped centering [same as fmean(d, g, TRA = "-") but faster]
fwithin(d, g, w)                         # Grouped and weighted centering [same as fmean(d, g, w, "-")]
fwithin(d, g, w, theta = 0.76)           # Quasi-centering i.e. d - theta*fbetween(d, g, w)
fwithin(d, g, w, mean = "overall.mean")  # Preserving the overall weighted mean of the data

fscale(d)                                # Scaling and centering (default mean = 0, sd = 1)
fscale(d, mean = 5, sd = 3)              # Custom scaling and centering
fscale(d, mean = FALSE, sd = 3)          # Mean preserving scaling
fscale(d, g, w)                          # Grouped and weighted scaling and centering
fscale(d, g, w, mean = "overall.mean",   # Setting group means to overall weighted mean,
       sd = "within.sd")                 # and group sd's to fsd(fwithin(d, g, w), w = w)

get_vars(iris, 1:2)                      # Use get_vars for fast selecting data.frame columns, gv is shortcut
fHDbetween(gv(iris, 1:2), gv(iris, 3:5)) # Linear prediction with factors and continuous covariates
fHDwithin(gv(iris, 1:2), gv(iris, 3:5))  # Linear partialling out factors and continuous covariates

# This again opens up new possibilities for data manipulation...
iris %>%
  ftransform(ASWMSL = Sepal.Length > fmedian(Sepal.Length, Species, w, "replace")) %>%
  fgroup_by(ASWMSL) %>% collapg(w = w, keep.col.order = FALSE)

iris %>% fgroup_by(Species) %>% num_vars %>% fwithin(w)  # Weighted demeaning


## Time Series and Panel Series ---------------------------------------------------------------------------------

flag(AirPassengers, -1:3)                      # A sequence of lags and leads
EuStockMarkets %>%                             # A sequence of first and second seasonal differences
  fdiff(0:1 * frequency(.), 1:2)
fdiff(EuStockMarkets, rho = 0.95)              # Quasi-difference [x - rho*flag(x)]
fdiff(EuStockMarkets, log = TRUE)              # Log-difference [log(x/flag(x))]
EuStockMarkets %>% fgrowth(c(1, frequency(.))) # Ordinary and seasonal growth rate
EuStockMarkets %>% fgrowth(logdiff = TRUE)     # Log-difference growth rate [log(x/flag(x))*100]

# Creating panel data
pdata <- EuStockMarkets %>% list(`A` = ., `B` = .) %>%
         unlist2d(idcols = "Id", row.names = "Time")

L(pdata, -1:3, ~Id, ~Time)                   # Sequence of fully identified panel-lags (L is operator for flag)
pdata %>% fgroup_by(Id) %>% flag(-1:3, Time) # Same thing..

# collapse supports pseries and pdata.frame's, provided by the plm package
pdata <- plm::pdata.frame(pdata, index = c("Id", "Time"))
L(pdata, -1:3)          # Same as above, ...
psacf(pdata)            # Multivariate panel-ACF
psmat(pdata) %>% plot   # 3D-array of time series from panel data + plotting

HDW(pdata)              # This projects out id and time fixed effects.. (HDW is operator for fHDwithin)
W(pdata, effect = "Id") # Only Id effects.. (W is operator for fwithin)

## List Processing ----------------------------------------------------------------------------------------------

# Some nested list of heterogenous data objects..
l <- list(a = qM(mtcars[1:8]),                                   # Matrix
          b = list(c = mtcars[4:11],                             # data.frame
                   d = list(e = mtcars[2:10],
                            f = fsd(mtcars))))                   # Vector

ldepth(l)                       # List has 4 levels of nesting (considering that mtcars is a data.frame)
is.unlistable(l)                # Can be unlisted
has_elem(l, "f")                # Contains an element by the name of "f"
has_elem(l, is.matrix)          # Contains a matrix

get_elem(l, "f")                # Recursive extraction of elements..
get_elem(l, c("c","f"))
get_elem(l, c("c","f"), keep.tree = TRUE)
unlist2d(l, row.names = TRUE)   # Intelligent recursive row-binding to data.frame
rapply2d(l, fmean) %>% unlist2d # Taking the mean of all elements and repeating

# Application: extracting and tidying results from (potentially nested) lists of model objects
list(mod1 = lm(mpg ~ carb, mtcars),
     mod2 = lm(mpg ~ carb + hp, mtcars)) %>%
  lapply(summary) %>%
  get_elem("coef", regex = TRUE) %>%   # Regular expression search and extraction
  unlist2d(idcols = "Model", row.names = "Predictor")

## Summary Statistics -------------------------------------------------------------------------------------------

irisNA <- na_insert(iris, prop = 0.15)  # Randmonly set 15% missing
fNobs(irisNA)                           # Observation count
pwNobs(irisNA)                          # Pairwise observation count
fNobs(irisNA, g)                        # Grouped observation count
fNdistinct(irisNA)                      # Same with distinct values... (default na.rm = TRUE skips NA's)
fNdistinct(irisNA, g)

descr(iris)                                   # Detailed statistical description of data

varying(iris, ~ Species)                      # Show which variables vary within Species
varying(pdata)                                # Which are time-varying ?
qsu(iris, w = ~ w)                            # Fast (one-pass) summary (with weights)
qsu(iris, ~ Species, w = ~ w, higher = TRUE)  # Grouped summary + higher moments
qsu(pdata, higher = TRUE)                     # Panel-data summary (between and within entities)
pwcor(num_vars(irisNA), N = TRUE, P = TRUE)   # Pairwise correlations with p-value and observations
pwcor(W(pdata, keep.ids = FALSE), P = TRUE)   # Within-correlations
Evaluated and more extensive sets of examples are provided on the package page (also accessible from R by calling example('collapse-package')), and further in the vignettes and documentation.
Additional Notes
Regarding Performance
Some simple benchmarks against dplyr, data.table and plm are provided in this blog post and in the vignettes. In general:
-
For simple aggregations of large data (~ 10 mio. obs) the performance is comparable to data.table (e.g. see here and here)^[Huge aggregations with simple functions like
meanorsumand meaningful parallel processing power are faster on data.table, whereas collapse is typically faster on 2-core machines / laptops.]. -
For more complex categorical or weighed aggregations and for transformations like grouped replacing and sweeping out statistics (
data.table::':='ordplyr::mutateoperations), collapse is ~10x faster than data.table. Notable are very fast algorithms for (grouped) statistical mode and distinct value counts, variance, various weighted statistics, scaling, centering, panel-lags, differences and growth rates. -
Due to its highly optimized R code, collapse is very efficient for programming. On smaller data a collapse implementation will execute within microseconds, whereas packages like dplyr or data.table will typically evaluate in the millisecond domain (up to ~100x slower).
-
This performance extends to grouped and weighted computations on vectors and matrices (collapse provides separate vector, matrix and data.frame methods written in C++, the performance in matrix computations is comparable to Rfast and matrixStats).
Regarding the Integration with dplyr, plm and data.table and Other Classes
-
collapse and dplyr: The Fast Statistical Functions and transformation functions and operators provided by collapse have a grouped_df method, allowing them to be seamlessly integrated into dplyr / tidyverse workflows. Doing so facilitates advanced operations in dplyr and provides remarkable performance improvements. In addition, collapse provides some faster replacements for common base R / dplyr verbs (
fselect/get_vars,fgroup_by,fsubset,ftransform/TRA,fsummarise,roworder,colorder,frename,funique,na_omit, etc.). See also this vignette.
- collapse and plm: The fast transformation functions and operators provided by collapse also have pseries (panel-series) and pdata.frame (panel-data.frame) methods. This integrates them seamlessly into plm workflows and facilitates the manipulation of panel data. For typical panel data operations like between- and within-transformations or panel lags / leads / differences, collapse functions are 20-100x faster than plm equivalents, and provide greater versatility. See also this vignette.
-
collapse and data.table: All collapse functions can be applied to data.table's and they will also return a data.table again. The C/C++ programming of collapse was inspired by data.table and directly relies on some data.table C source code (e.g. for grouping and row-binding). The function
qDTefficiently converts various R objects to data.table, and several functions (mrtl,mctl,unlist2d, ...) have an option to return a data.table. See also this vignette. -
Time series and other classes: Besides explicit support for dplyr / tibble, data.table and plm panel data classes, collapse's statistical and transformation functions are S3 generic, with 'default', 'matrix' and 'data.frame' methods which dispatch on the implicit data type (such that matrix-based classed objects are always handed to the matrix method, even if they don't inherit from 'matrix'). Furthermore, these methods intelligently preserve the attributes of the objects passed. Therefore collapse can handle many other matrix or data frame based classes, including ts, xts / zoo, timeSeries, sf data frames etc. Compatibility is of course limited if manipulating a classed object requires further actions besides preservation of the attributes under modification of 'names', 'dim', 'dimnames' and 'row.names'. For example, selecting columns from an sf data frame with
fselectrequires the user to also select the 'geometry' column to not break the class.