vegasbrianc / Docker Traefik Prometheus
Projects that are alternatives of or similar to Docker Traefik Prometheus
Monitor Traefik with Prometheus
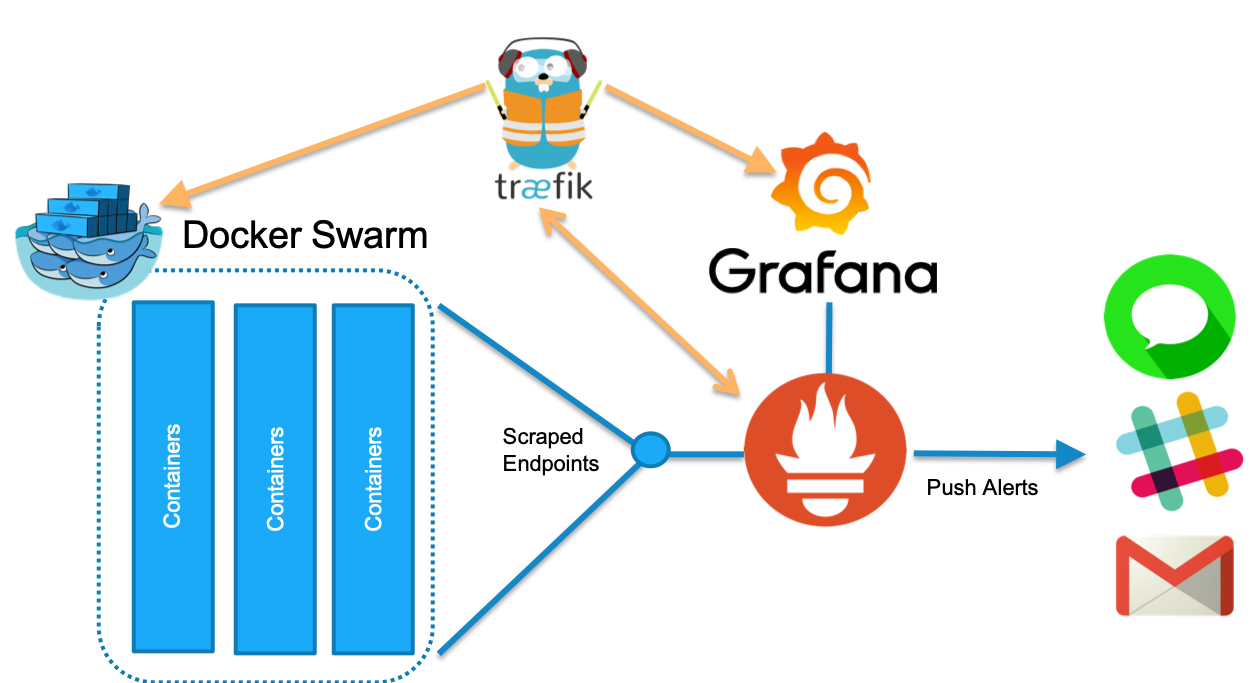
This Repo helps you get started with monitoring Traefik v2.0the amazing Reverse Proxy + so much more. Along with Traefik we will provision Prometheus for Time Series Data collection and Grafana for Visualization. Traefik will also act as a proxy in front of Promethues and Grafana while Prometheus monitors Traefik the other way. Cool, huh?
Before we can begin ensure you have Docker installed with Docker Swarm enabled. If you are using Docker for Desktop Mac or Windows you already have Swarm enabled. For all others please follow the Swarm setup guide.
The presentation and Video from this demo is also included in the Repo - 56k_Cloud_Traefik_Monitoring.pdf and Youtube Session
Goals of the Traefik Monitoring Repo:
- Provision a Traefik Stack with Prometheus metrics enabled
- Deploy Prometheus & Grafana
- Verify Traefik Metrics
- Configure Dashboards in Grafana for Traefik
Review the Traefik Monitoring Stack Deployment
In this section we will prepare and deploy our Traefik Reverse Proxy and our monitoring stack.
First, we need to clone this Repo to your Docker Swarm. Ensure you are performing this on your Manager node. If you only have one node then this is also the manager.
git clone https://github.com/vegasbrianc/docker-traefik-prometheus.git
Next, lets review what the stack is doing before we deploy it. With your favorite editor (vim of course). Open the docker-compose.yml file.
cd docker-traefik-prometheus
vi docker-compose.yml
The Traefik metrics are enabled by the command we pass to the Traefik container. The --metrics flag enables metrics and --metrics.prometheus.buckets=0.1,0.3,1.2,5.0 defines the Prometheus bucket value (typically in seconds). Prometheus monitors for all values and stores the metric in the appropriate bucket.
version: '3.7'

services:
traefik:
    image: traefik:v2.0
    command:
    - "--logLevel=DEBUG"
    - "--api"
    - "--metrics"
    - "--metrics.prometheus.buckets=0.1,0.3,1.2,5.0"
    - "--docker"
    - "--docker.swarmMode"
    - "--docker.domain=docker.localhost"
    - "--docker.watch"
Grafana and Prometheus are being deployed by Docker Swarm and the networking is managed by Traefik. We use labels for the services deployed to inform Traefik how to setup the frontend and backend for each service.
Grafana Deployment
deploy:
 labels:
  - "traefik.port=3000"
  - "traefik.docker.network=inbound"
  -  "traefik.frontend.rule=Host:grafana.localhost"
Prometheus Deployment
deploy:
  labels:
   - "traefik.frontend.rule=Host:prometheus.localhost"
   - "traefik.port=9090"
   - "traefik.docker.network=inbound"
Prometheus is also configured to monitor Traefik. This is configured in Prometheus.yml which enables Prometheus to auto-discover Traefik inside of Docker Swarm. Prometheus is watching for the Service Task tasks.traefik on port 8080. Once the service is online metrics will begin flowing to Prometheus.
Deploy Traefik, Prometheus, and Grafana
OK, we now know where everything is configured inside of the stack. The moment of truth DEPLOY
In the docker-traefik-prometheusdirectory run the following:
docker stack deploy -c docker-compose.yml traefik
Verify all the services have been provisioned. The Replica count for each service should be 1/1 Note this can take a couple minutes
docker service ls
Check the Metrics
Once all the services are up we can open the Traefik Dashboard. The dashboard should show us our frontend and backends configured for both Grafana and Prometheus.
http://docker.localhost:8080/
Take a look at the metrics which Traefik is now producing in Prometheus metrics format
http://localhost:8080/metrics
Login to Grafana and Visualize Metrics
Grafana is an Open Source visualization tool for the metrics collected with Prometheus. Next, open Grafana to view the Traefik Dashboards. Note: Firefox doesn't properly work with the below URLS please use Chrome
http://grafana.localhost
Username: admin Password: foobar
Open the Traefik Dashboard and select the different backends available
Note: Upper right-hand corner of Grafana switch the default 1 hour time range down to 5 minutes. Refresh a couple times and you should see data start flowing
Deploy a new webservice
Of course we couldn't do a demo without showing some Cat Gifs. This demo launches a random cat picture of the day served by three instances of the Cats Services.
docker stack deploy -c cats.yml cats
Let's have a look at our new service
http://cats.localhost
Refresh a few times and notice the Traefik Proxy is loadbalancing our requests to the 3 different Cat services.
Now, head back to Grafana. Refresh the Traefik dashboard in the upper right corner and set 5 minutes for our time range. Select, the Cats backend in the Dashboard.

