All Projects → RisingStack → Example Prometheus Nodejs

RisingStack / Example Prometheus Nodejs

Prometheus monitoring example with Node.js

Programming Languages

javascript
184084 projects - #8 most used programming language

Projects that are alternatives of or similar to Example Prometheus Nodejs

Awesome Prometheus Alerts
🚨 Collection of Prometheus alerting rules
Stars: ✭ 3,323 (+1234.54%)
Mutual labels:  monitoring, prometheus, grafana, alerting
Grafana
The open and composable observability and data visualization platform. Visualize metrics, logs, and traces from multiple sources like Prometheus, Loki, Elasticsearch, InfluxDB, Postgres and many more.
Stars: ✭ 45,930 (+18345.78%)
Mutual labels:  monitoring, prometheus, grafana, alerting
Netdata
Real-time performance monitoring, done right! https://www.netdata.cloud
Stars: ✭ 57,056 (+22814.06%)
Mutual labels:  monitoring, prometheus, grafana, alerting
Hastic Server
Hastic data management server for analyzing patterns and anomalies from Grafana
Stars: ✭ 292 (+17.27%)
Mutual labels:  monitoring, prometheus, grafana, alerting
Giropops Monitoring
Full stack tools for monitoring containers and other stuff. ;)
Stars: ✭ 1,019 (+309.24%)
Mutual labels:  monitoring, prometheus, grafana
Karma
Alert dashboard for Prometheus Alertmanager
Stars: ✭ 1,007 (+304.42%)
Mutual labels:  monitoring, prometheus, alerting
Cloudprober
An active monitoring software to detect failures before your customers do.
Stars: ✭ 1,269 (+409.64%)
Mutual labels:  monitoring, prometheus, grafana
Ciao
HTTP checks & tests (private & public) monitoring - check the status of your URL
Stars: ✭ 1,322 (+430.92%)
Mutual labels:  monitoring, prometheus, alerting
Pingprom
Prometheus uptime monitoring quickstart
Stars: ✭ 107 (-57.03%)
Mutual labels:  monitoring, prometheus, grafana
Prometheus
The Prometheus monitoring system and time series database.
Stars: ✭ 40,114 (+16010.04%)
Mutual labels:  monitoring, prometheus, alerting
Appmetrics
App Metrics is an open-source and cross-platform .NET library used to record and report metrics within an application.
Stars: ✭ 1,986 (+697.59%)
Mutual labels:  monitoring, prometheus, grafana
Hana sql exporter
SAP Hana SQL Exporter for Prometheus
Stars: ✭ 18 (-92.77%)
Mutual labels:  monitoring, prometheus, grafana
Prometheus
Kubernetes Setup for Prometheus and Grafana
Stars: ✭ 824 (+230.92%)
Mutual labels:  monitoring, prometheus, grafana
Prom2teams
prom2teams is an HTTP server built with Python that receives alert notifications from a previously configured Prometheus Alertmanager instance and forwards it to Microsoft Teams using defined connectors
Stars: ✭ 122 (-51%)
Mutual labels:  monitoring, prometheus, alerting
Github Monitoring
Monitor your GitHub Repos with Docker & Prometheus
Stars: ✭ 163 (-34.54%)
Mutual labels:  monitoring, prometheus, grafana
Unsee
Alert dashboard for Prometheus Alertmanager
Stars: ✭ 700 (+181.12%)
Mutual labels:  monitoring, prometheus, alerting
Swagger Stats
API Observability. Trace API calls and Monitor API performance, health and usage statistics in Node.js Microservices.
Stars: ✭ 559 (+124.5%)
Mutual labels:  monitoring, prometheus, grafana
Beam Dashboards
BEAM ❤️ Prometheus ❤️ Grafana
Stars: ✭ 244 (-2.01%)
Mutual labels:  monitoring, prometheus, grafana
Dockprom
Docker hosts and containers monitoring with Prometheus, Grafana, cAdvisor, NodeExporter and AlertManager
Stars: ✭ 4,489 (+1702.81%)
Mutual labels:  monitoring, prometheus, grafana
Cluster Monitoring
Cluster monitoring stack for clusters based on Prometheus Operator
Stars: ✭ 453 (+81.93%)
Mutual labels:  monitoring, prometheus, grafana

Example Prometheus Monitoring

Goal

Setup monitoring with Prometheus and Grafana.

Steps

  1. Run sample server: npm install and node server
  2. Run Prometheus: see below
  3. Visit your running Prometheus and run queries
  4. Run Grafana: see below
  5. Add Prometheus data source (Url: http://localhost:9090, Access: direct)
  6. Import grafana-dashboard.json dashboard
  7. Create your own dashboard from the Prometheus queries

Requirements

  • Docker

Run

Modify: /prometheus-data/prometheus.yml, replace 192.168.0.10 with your own host machine's IP.
Host machine IP address: ifconfig | grep 'inet 192'| awk '{ print $2}'

docker run -p 9090:9090 -v "$(pwd)/prometheus-data":/prometheus-data prom/prometheus -config.file=/prometheus-data/prometheus.yml

Open Prometheus: http://localhost:9090

Example Queries

Throughput

Error rate

Range[0,1]: number of 5xx requests / total number of requests

sum(increase(http_request_duration_ms_count{code=~"^5..$"}[1m])) /  sum(increase(http_request_duration_ms_count[1m]))
Request Per Minute
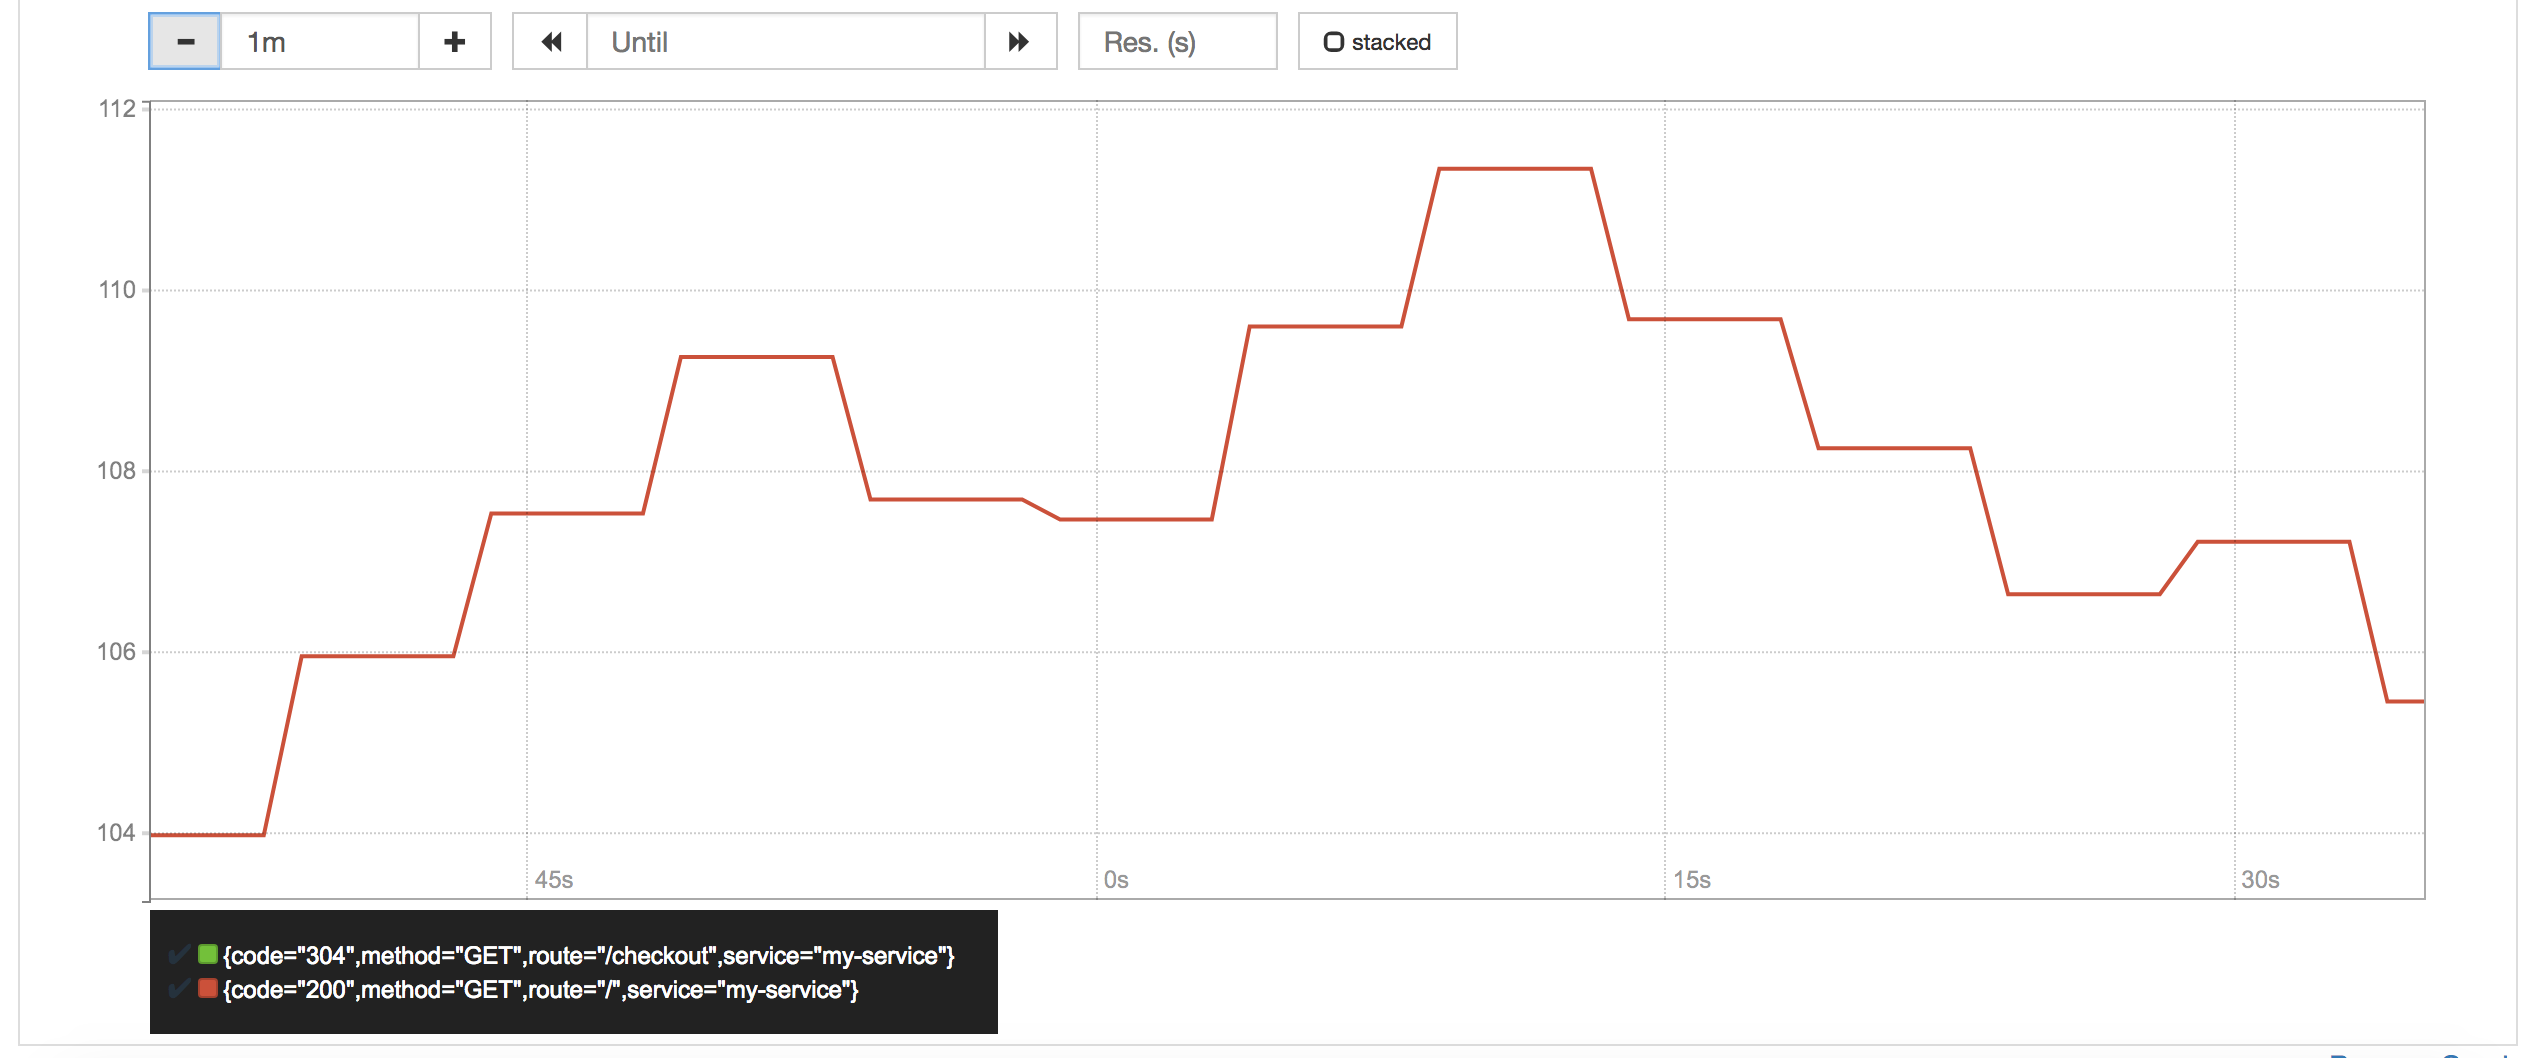
sum(rate(http_request_duration_ms_count[1m])) by (service, route, method, code)  * 60

Response Time

Apdex

Apdex score approximation:
100ms target and 300ms tolerated response time

(
  sum(rate(http_request_duration_ms_bucket{le="100"}[1m])) by (service)
+
  sum(rate(http_request_duration_ms_bucket{le="300"}[1m])) by (service)
) / 2 / sum(rate(http_request_duration_ms_count[1m])) by (service)

Note that we divide the sum of both buckets. The reason is that the histogram buckets are cumulative. The le="100" bucket is also contained in the le="300" bucket; dividing it by 2 corrects for that. - Prometheus docs

95th Response Time
histogram_quantile(0.95, sum(rate(http_request_duration_ms_bucket[1m])) by (le, service, route, method))
Median Response Time:
histogram_quantile(0.5, sum(rate(http_request_duration_ms_bucket[1m])) by (le, service, route, method))
Average Response Time
avg(rate(http_request_duration_ms_sum[1m]) / rate(http_request_duration_ms_count[1m])) by (service, route, method, code)

Memory Usage

Average Memory Usage

In Megabyte.

avg(nodejs_external_memory_bytes / 1024 / 1024) by (service)

Reload config

Necessary when you modified prometheus-data.

curl -X POST http://localhost:9090/-/reload

Prometheus Data

avg(rate(http_request_duration_ms_sum[1m]) / rate(http_request_duration_ms_count[1m])) by (service, route, method, code)

Prometheus - Data

Prometheus Alerts

States of active alerts: pending, firing

Prometheus - Alert Pending Prometheus - Alert Firing

Grafana

Run

docker run -i -p 3000:3000 grafana/grafana

Open Grafana: http://localhost:3000

Username: admin
Password: admin

Setting datasource

Create a Grafana datasource with this settings:

Or use this curl request:

curl 'http://admin:[email protected]:3000/api/datasources' -H 'Content-Type: application/json;charset=UTF-8' -H 'Accept: application/json, text/plain, */*' --data-binary '{"name":"DS_PROMETHEUS","type":"prometheus","url":"http://localhost:9090","access":"direct","jsonData":{"keepCookies":[]},"secureJsonFields":{}}' --compressed

Setting dashboard

Grafana Dashboard to import: /grafana-dashboard.json

Or use this curl request:

curl 'http://admin:[email protected]:3000/api/dashboards/import' -H 'Accept-Encoding: gzip, deflate' -H 'Content-Type: application/json;charset=UTF-8' -H 'Accept: application/json, text/plain, */*' --data-binary '%{copy and paste grafana-dashboard.json}' --compressed

Grafana Dashboard

Grafana - Response Time Grafana - Throughput

Acknowledgements

This example is sponsored by Trace by RisingStack.

Note that the project description data, including the texts, logos, images, and/or trademarks, for each open source project belongs to its rightful owner. If you wish to add or remove any projects, please contact us at [email protected].