mariusbrataas / Flowpoints.js
Programming Languages
Projects that are alternatives of or similar to Flowpoints.js
Flowpoints
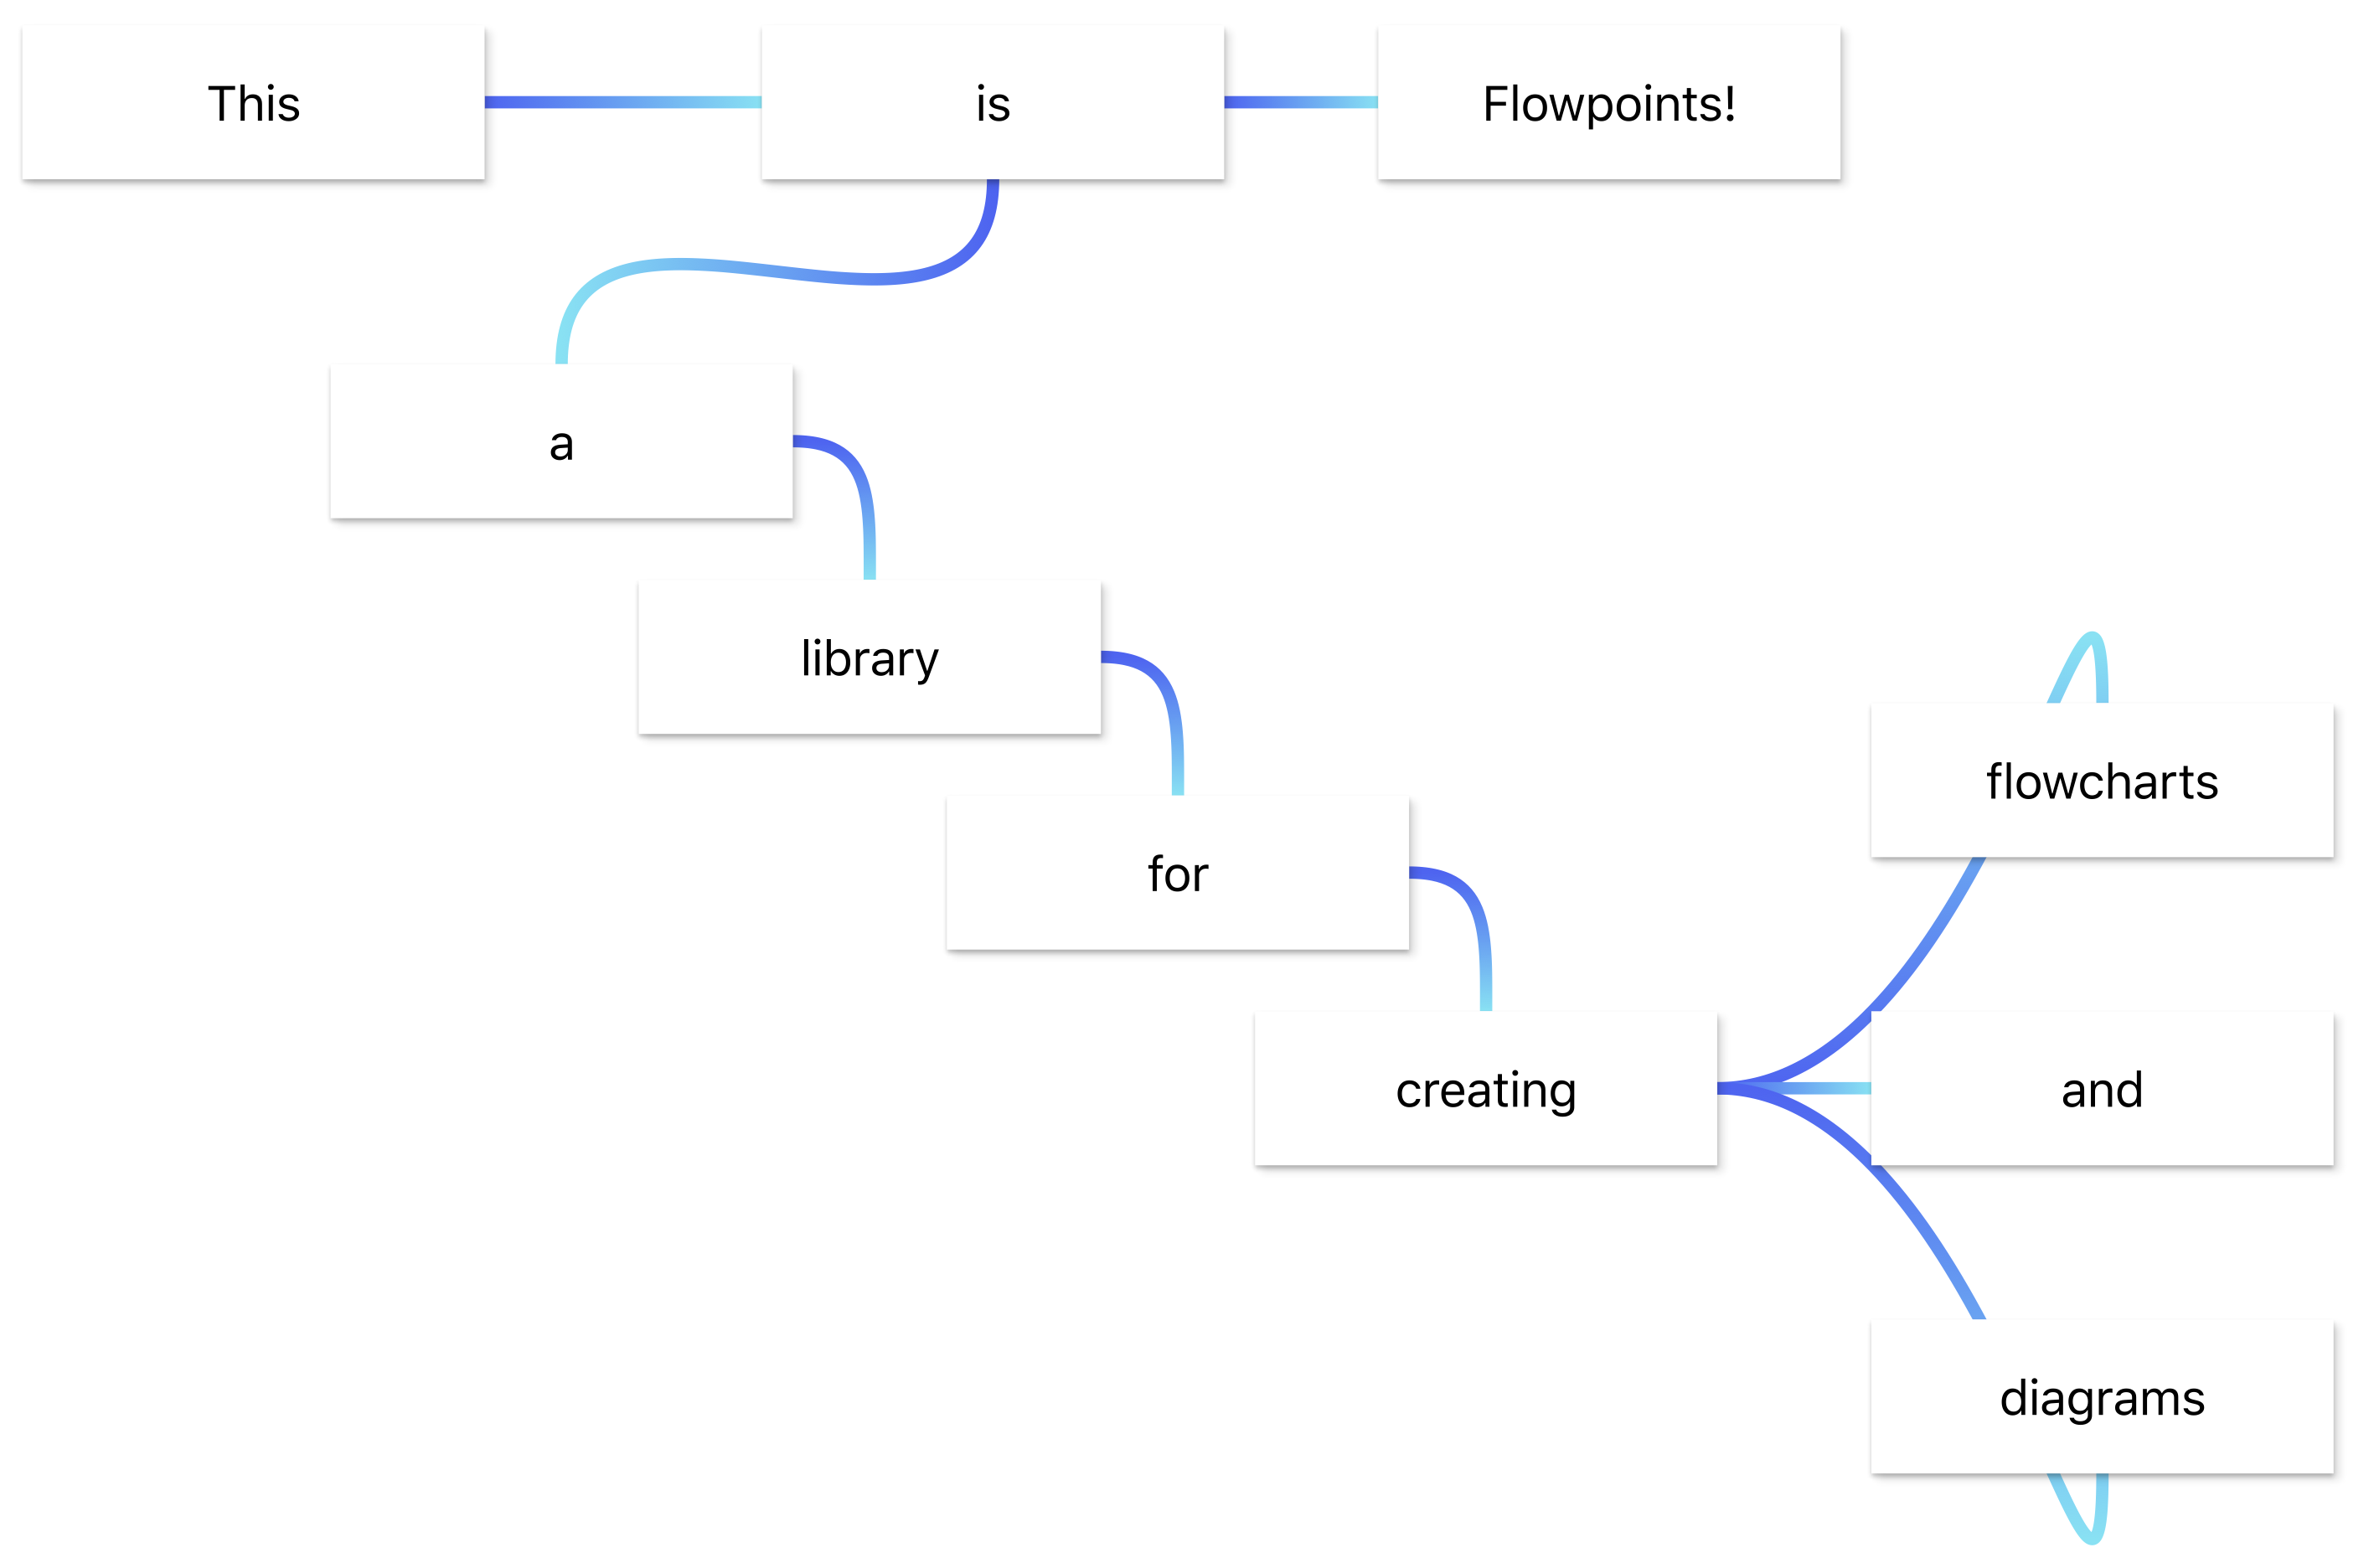
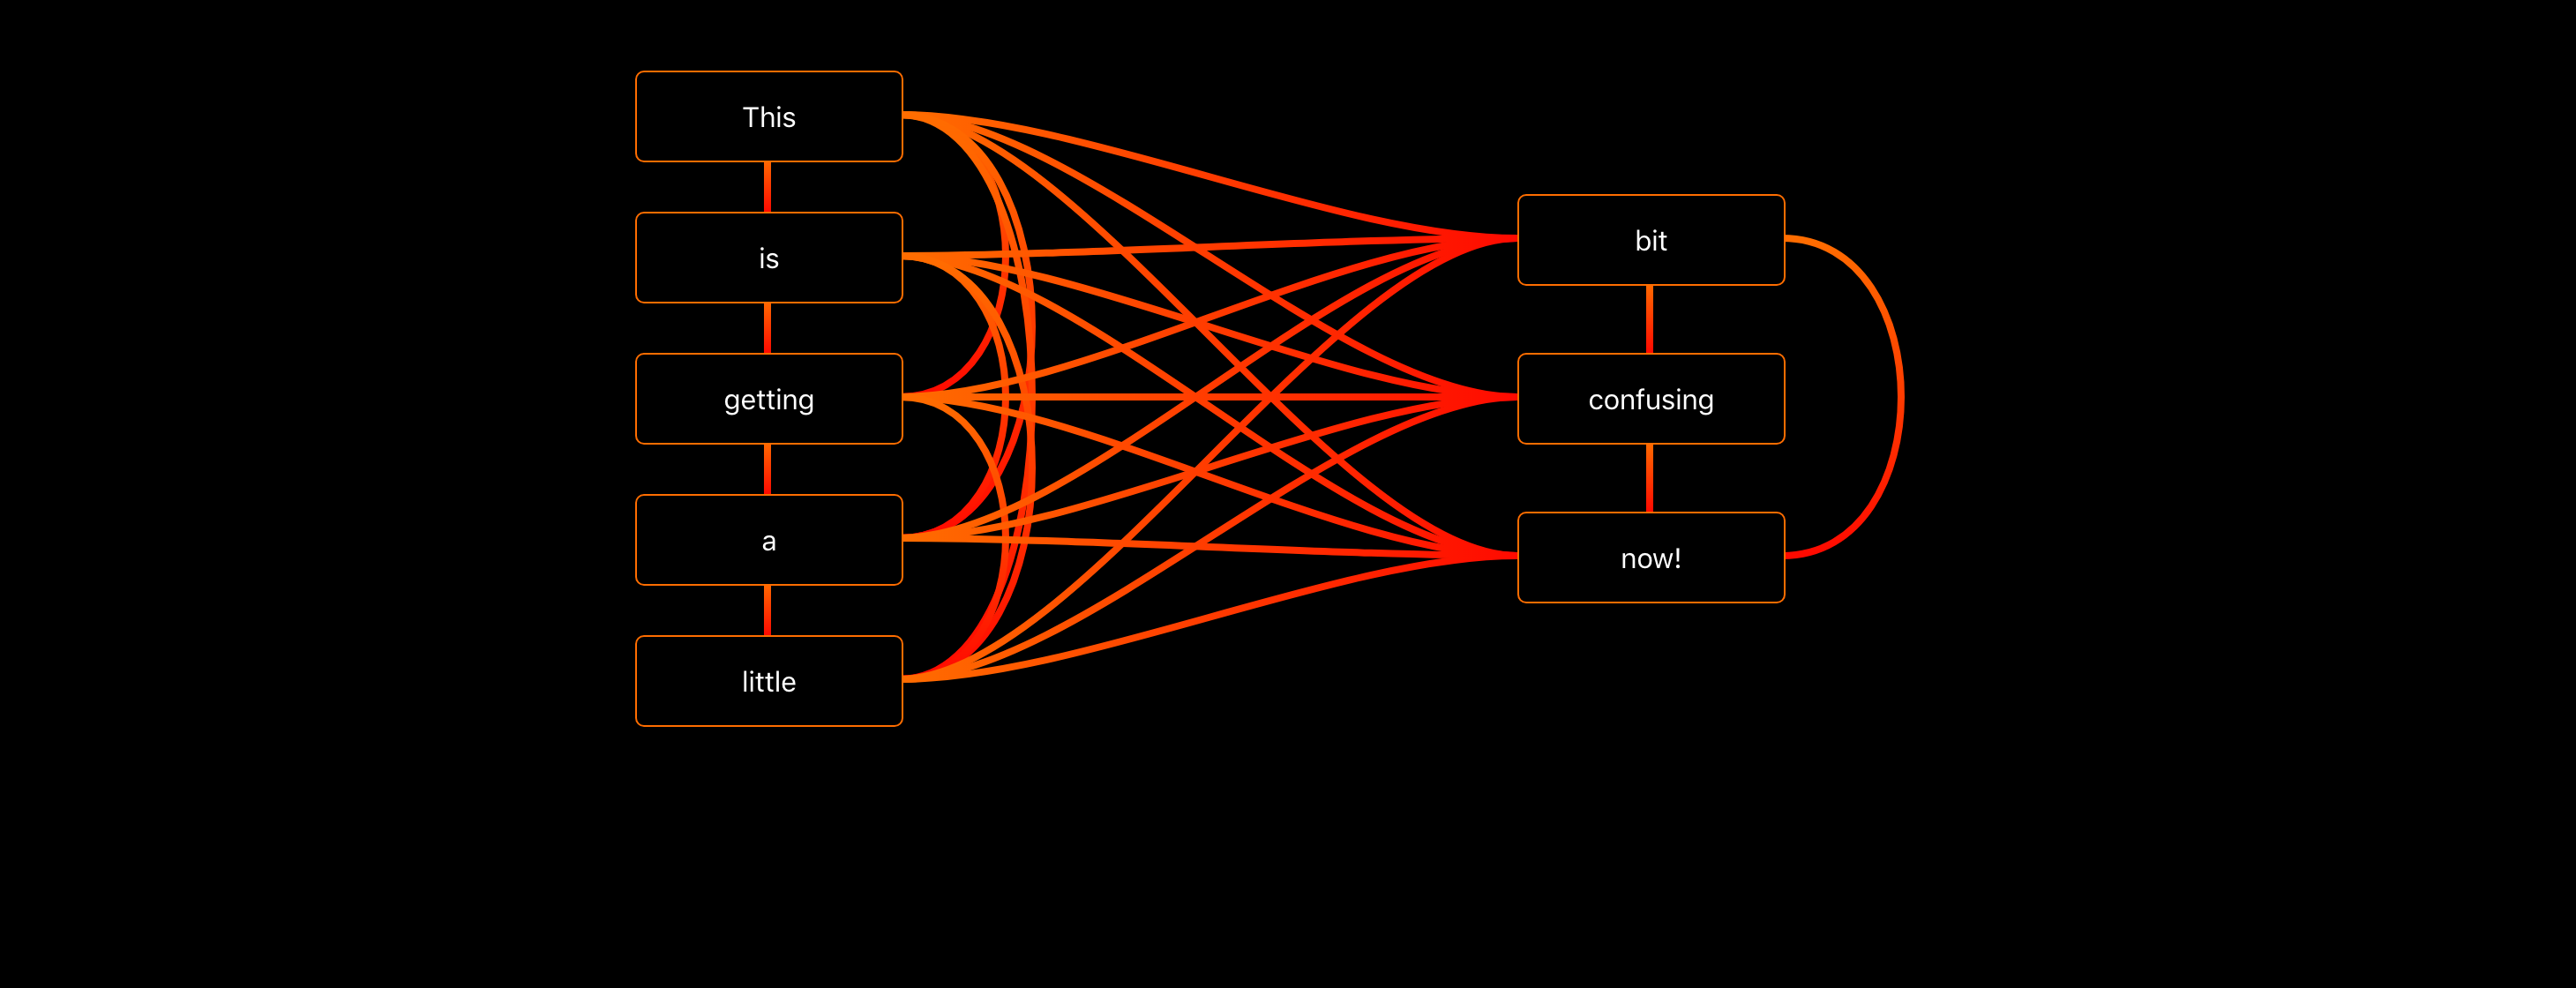
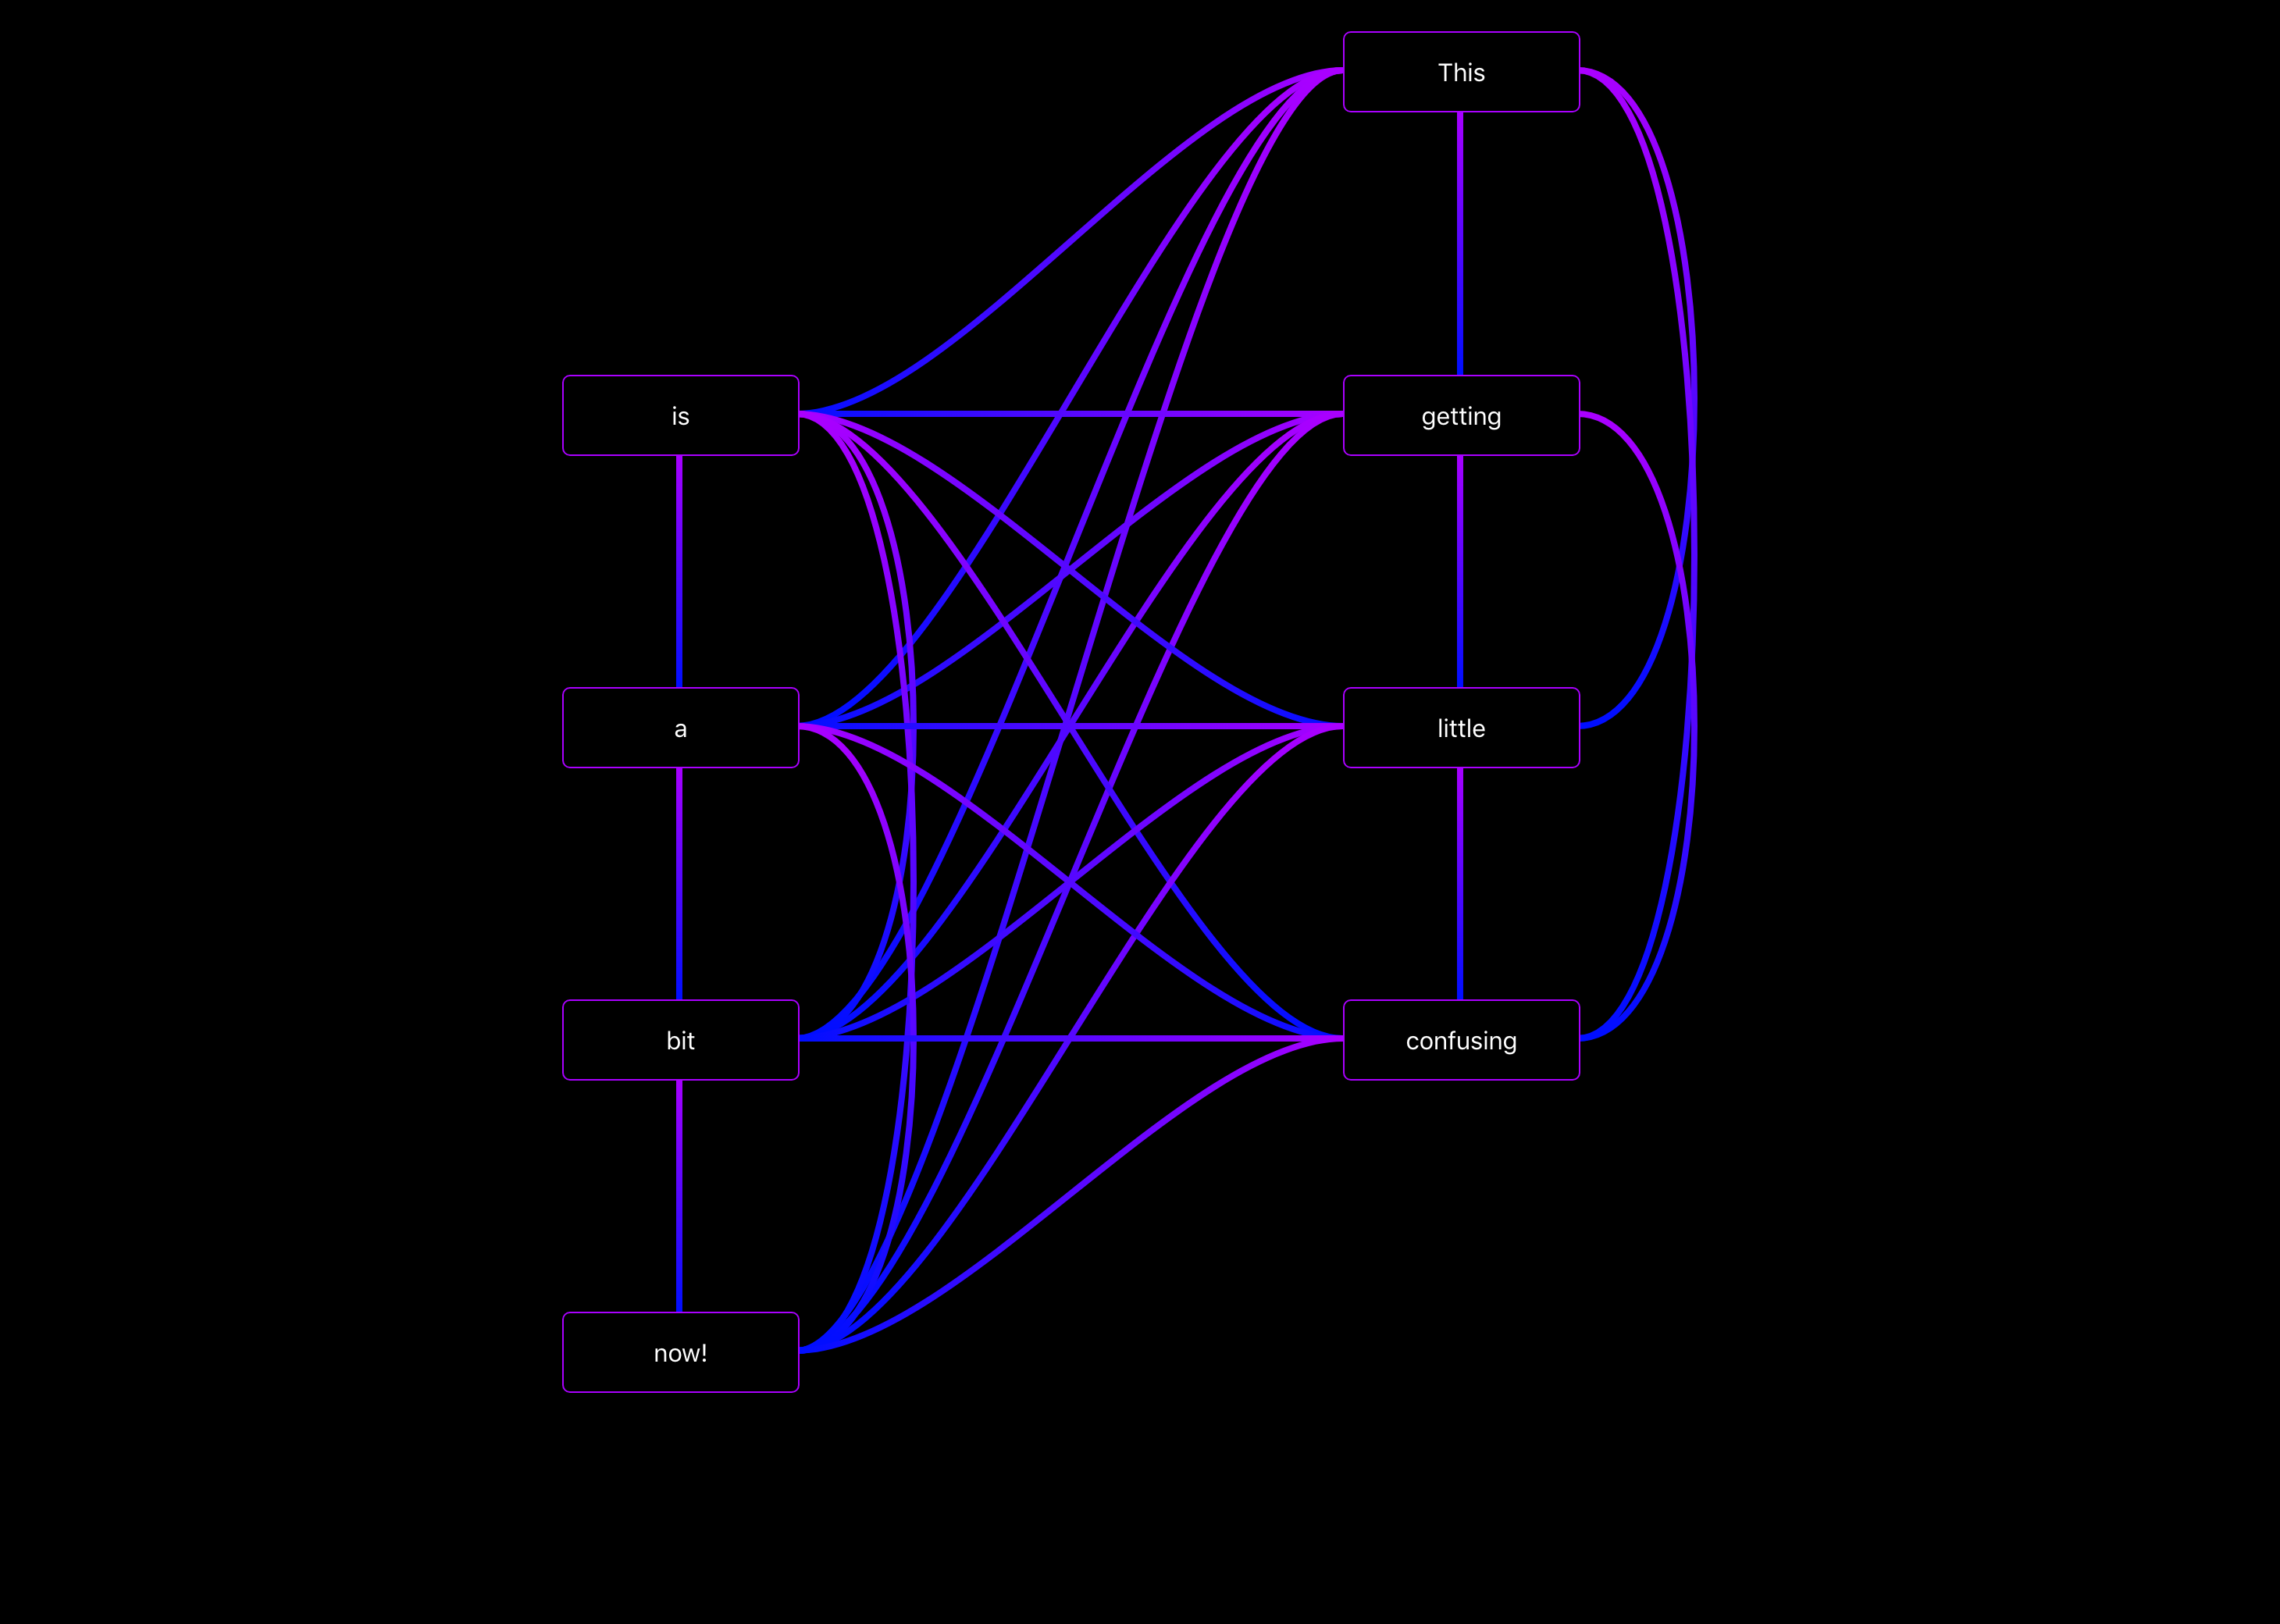
A developer-friendly library for creating flowcharts and diagrams.
Simple demo here and cooler demo here, both running the same source code here
Or check out this or this or this
Installation
Quick and easy installation with npm. Package site here.
npm install --save flowpoints
Usage
import React from 'react';
import { Flowpoint, Flowspace } from 'flowpoints';

...
<Flowspace>
  <Flowpoint key="point_a" outputs={["point_b"]}>
    Hello world
    ...
  </Flowpoint>
  <Flowpoint key="point_b">
    I am point b
    ...
  </Flowpoint>
</Flowspace>
...
To create a new diagram start by creating open-and-close tags for the "Flowspace". It’s in between these that you may add flowpoints.
No-drag areas
To create a no-drag area simply set the className of your component/element to "nodrag".
Variants
Can be defined for all flowpoints in the flowspace-props, or individually in each flowpoint's props.
Themes
Used to determine the colors used for the flowpoints. Available themes:
- red
- purple
- deep-purple
- indigo
- blue
- light-blue
- green
- light-green
- lime
- yellow
- amber
- orange
- deep-orange
- brown
- grey
- blue-grey
- black
- white
Outputs
The flowspace extracts information about all connections from the outputs of every flowpoint. Telling a flowpoint about inputs won’t have any effect.
To change the color and stroke of a single connection: Add that info to the output like shown below
There are two ways to pass info about the connections:
As an array.
Simply pass an array with the keys to all the flowpoints the current one should be connected to.
As an object.
Create an object using the following pattern:
...
<Flowpoint
  key="point_a"
  outputs={{
    "point_b": {
      output: "auto",
      input: "auto",
      inputColor: "red",
      dash: 5
    },
    "point_c": {
      output: "right",
      input: "left"
    }
  }}>Hello World!</Flowpoint>
...
The "right" and "left" arguments tell the flowspace where on the involved flowpoints the connections should attach.
Possible locations: top, left, center (default), right, bottom.
Flowpoint props
<Flowpoint
  key="point_a"
  theme="indigo"
  variant="outlined"
  outputs={{
    "point_b": {
      output:"right",
      input:"left",
      outputColor:"#0c00ff",
      inputColor:"#ff0022",
      markerStart: false,
      markerEnd: true
      onClick: (key_a, key_b, e) => {
        console.log('Click connection ' + key_a + ' -> ' + key_b)
      }
    }
  }}
  style={{ backgroundColor:'lightblue' }}
  startPosition={{ x:250, y:100 }}
  selected={false}
  snap={{ x:10, y:10 }}
  dragX={true}
  dragY={true}
  minX=50
  minY=50
  width=100
  height=40
  onClick={ (e) => {console.log('Click!')} }
  onDrag={ (position) => {console.log('Drag', position)} }
  onHover={ (isHovering) => {console.log(isHovering ? 'Hovering' : 'Not hovering')} }
  > ... </Flowpoint>
Flowspace props
<Flowspace
  theme="indigo"
  variant="outlined"
  background="white"
  style={{ width:'100vw', height:'100vh' }}
  connectionSize=4
  arrowStart={false}
  arrowEnd={true}
  selected="point_a"
  selectedLine={{ a:"point_a", b:"point_b" }}
  onLineClick={(key_a, key_b, e) => {
    console.log('Click connection ' + key_a + ' -> ' + key_b)
  }}
  onClick={e => {console.log('Clicked empty space')}}
  > ... </Flowspace>
Themes, variants, connectionSizes, arrowStart and arrowEnd settings passed to the flowspace will be the default values used when drawing connections. A different value specified by a flowpoint's outputs will replace the default value for that connection only.
Suggested pattern
Once a flowpoint unmounts it will forget it's last position. To help with this (and a few more things) I find that the following pattern works really well:
import React, { Component } from 'react';
import ReactDOM from "react-dom";
import { Flowpoint, Flowspace } from 'flowpoints';


class App extends Component {

  constructor(props) {
    super(props);

    this.state = {

      selected_point: null,

      flowpoints: {
        "a": {
          position: { x:50, y:50 },
          outputs: {
            "b": {
              output:"right",
              input:"left",
              outputColor:"blue",
              inputColor:"white",
              width:3,
              onClick={(key_a, key_b) => { ... }}
            }
          }
        }
      }
    }
  }

  render() {
    return (
      <Flowspace
        theme="indigo"
        variant="outlined"
        background="black"
        style={{ height:"100vh", width:"100vw" }}
        onClick={e => {
          this.setState({ selected_point:null })
        }}
        selected={this.state.selected_point}>
        {
          Object.keys(this.state.flowpoints).map(key => {
            const point = this.state.flowpoints[key]
            return (
              <Flowpoint
                key={key}
                snap={ x:10, y:10 }
                startPosition={point.pos}
                onClick={() => {
                  var selected_point = this.state.selected_point
                  if (selected_point === key) {
                    selected_point = null
                  } else {
                    selected_point = key
                  }
                  this.setState({selected_point})
                }}
                onDrag={position => {
                  var flowpoints = this.state.flowpoints
                  flowpoints[key].position = position
                  this.setState({flowpoints})
                }}>{"Hello from " + key}</Flowpoint>
            )
          })
        }
      </Flowspace>
    )
  }
}

ReactDOM.render(<App />, document.getElementById('root'))
Of course, you can do with much less code than this, but this example should give a good indication on how you can structure your data for a flowchart.
Check out the demo and it's source code for more.
Contributing
Made some improvements? Make sure to update the demo and create a new pull request!
Things to improve
Connections corners:
Add the option to make paths use straight corners.
Connections animations:
Add an option to make connections appear as dashed lines moving from A to B at user-defined speed.
Better touch:
Make it possible to drag flowpoints on touch screens without also dragging the entire window.
Directory structure
Please maintain the following structure when making pull requests.
flowpoints
├── .gitattributes
├── .gitignore
├── LICENSE
├── package-lock.json
├── package.json
├── README.md
│
├── assets
│   ├── favicon.ico
│   └── this_is_flowpoints.png
│
├── demo
│   ├── src
│   ├── index.css
│   ├── index.html
│   └── index.js
│
└── src
    ├── Flowpoint.js
    ├── Flowspace.js
    └── index.js


