ResidentMario / Geoplot
Licence: mit
High-level geospatial data visualization library for Python.
Stars: ✭ 897
Programming Languages
python
139335 projects - #7 most used programming language
Projects that are alternatives of or similar to Geoplot
Geopython
Notebooks and libraries for spatial/geo Python explorations
Stars: ✭ 268 (-70.12%)
Mutual labels: spatial-analysis, matplotlib
Crime Analysis
Association Rule Mining from Spatial Data for Crime Analysis
Stars: ✭ 20 (-97.77%)
Mutual labels: spatial-analysis, matplotlib
Youtube Report
📊 Generate a personal YouTube report from your Google Takeout data
Stars: ✭ 607 (-32.33%)
Mutual labels: matplotlib
Mexican Government Report
Text Mining on the 2019 Mexican Government Report, covering from extracting text from a PDF file to plotting the results.
Stars: ✭ 473 (-47.27%)
Mutual labels: matplotlib
Colorcet
A set of useful perceptually uniform colormaps for plotting scientific data
Stars: ✭ 438 (-51.17%)
Mutual labels: matplotlib
Gis Tools For Hadoop
The GIS Tools for Hadoop are a collection of GIS tools for spatial analysis of big data.
Stars: ✭ 485 (-45.93%)
Mutual labels: spatial-analysis
Pynamical
Pynamical is a Python package for modeling and visualizing discrete nonlinear dynamical systems, chaos, and fractals.
Stars: ✭ 458 (-48.94%)
Mutual labels: matplotlib
Baby Names Analysis
Data ETL & Analysis on the dataset 'Baby Names from Social Security Card Applications - National Data'.
Stars: ✭ 557 (-37.9%)
Mutual labels: matplotlib
Data Science Ipython Notebooks
Data science Python notebooks: Deep learning (TensorFlow, Theano, Caffe, Keras), scikit-learn, Kaggle, big data (Spark, Hadoop MapReduce, HDFS), matplotlib, pandas, NumPy, SciPy, Python essentials, AWS, and various command lines.
Stars: ✭ 22,048 (+2357.97%)
Mutual labels: matplotlib
Pyheat
pprofile + matplotlib = Python program profiled as an awesome heatmap!
Stars: ✭ 491 (-45.26%)
Mutual labels: matplotlib
Chartpy
Easy to use Python API wrapper to plot charts with matplotlib, plotly, bokeh and more
Stars: ✭ 426 (-52.51%)
Mutual labels: matplotlib
Mpl Scatter Density
⚡️ Fast scatter density plots for Matplotlib ⚡️
Stars: ✭ 413 (-53.96%)
Mutual labels: matplotlib
Subreddit Analyzer
A comprehensive Data and Text Mining workflow for submissions and comments from any given public subreddit.
Stars: ✭ 447 (-50.17%)
Mutual labels: matplotlib
Vapeplot
matplotlib extension for vaporwave aesthetics
Stars: ✭ 483 (-46.15%)
Mutual labels: matplotlib
Pgrouting
Repository contains pgRouting library. Development branch is "develop", stable branch is "master"
Stars: ✭ 804 (-10.37%)
Mutual labels: spatial-analysis
geoplot: geospatial data visualization

![]()

![]()
![]()

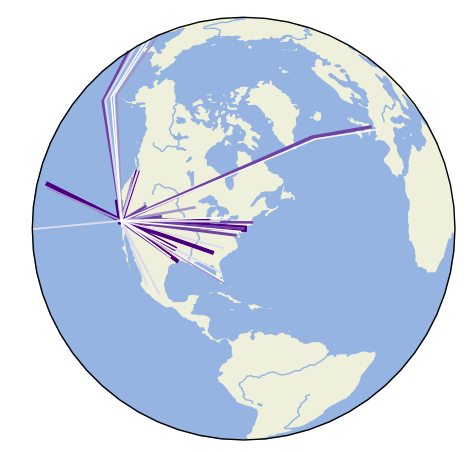
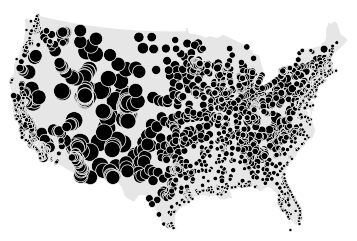
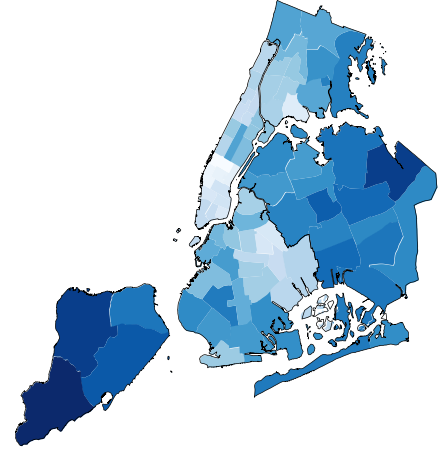
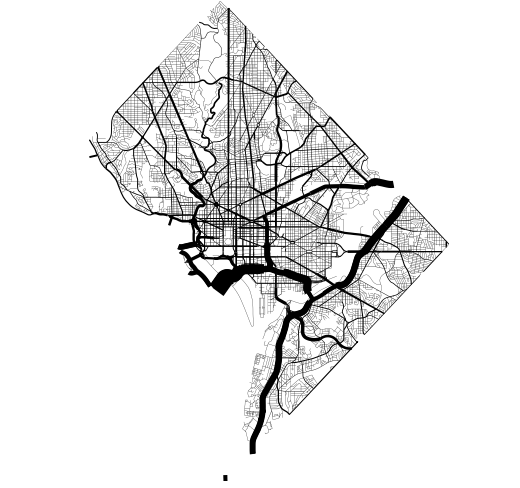
geoplot is a high-level Python geospatial plotting library. It's an extension to cartopy and matplotlib which makes mapping easy: like seaborn for geospatial. It comes with the following features:
- High-level plotting API: geoplot is cartographic plotting for the 90% of use cases. All of the standard-bearermaps that you’ve probably seen in your geography textbook are easily accessible.
-
Native projection support: The most fundamental peculiarity of geospatial plotting is projection: how do you unroll a sphere onto a flat surface (a map) in an accurate way? The answer depends on what you’re trying to depict.
geoplotprovides these options. -
Compatibility with
matplotlib: Whilematplotlibis not a good fit for working with geospatial data directly, it’s a format that’s well-incorporated by other tools.
Installation is simple with conda install geoplot -c conda-forge. See the documentation for help getting started.
Note that the project description data, including the texts, logos, images, and/or trademarks,
for each open source project belongs to its rightful owner.
If you wish to add or remove any projects, please contact us at [email protected].