All Projects → mjskay → Ggdist

mjskay / Ggdist

Licence: gpl-3.0
Visualizations of distributions and uncertainty

Programming Languages

r
7636 projects

Projects that are alternatives of or similar to Ggdist

TDAstats
R pipeline for computing persistent homology in topological data analysis. See https://doi.org/10.21105/joss.00860 for more details.
Stars: ✭ 26 (-86.8%)
Mutual labels:  ggplot2, r-package
Bayesplot
bayesplot R package for plotting Bayesian models
Stars: ✭ 276 (+40.1%)
Mutual labels:  ggplot2, r-package
mapr
Map species occurrence data
Stars: ✭ 34 (-82.74%)
Mutual labels:  ggplot2, r-package
sportyR
R package for drawing regulation playing surfaces for several sports
Stars: ✭ 84 (-57.36%)
Mutual labels:  ggplot2, r-package
Tidybayes
Bayesian analysis + tidy data + geoms (R package)
Stars: ✭ 557 (+182.74%)
Mutual labels:  ggplot2, r-package
Plotly
An interactive graphing library for R
Stars: ✭ 2,096 (+963.96%)
Mutual labels:  ggplot2, r-package
jcolors
A set of color palettes I like (or can at least tolerate)
Stars: ✭ 24 (-87.82%)
Mutual labels:  ggplot2, r-package
ggHoriPlot
A user-friendly, highly customizable R package for building horizon plots in ggplot2
Stars: ✭ 115 (-41.62%)
Mutual labels:  ggplot2, r-package
Naniar
Tidy data structures, summaries, and visualisations for missing data
Stars: ✭ 557 (+182.74%)
Mutual labels:  ggplot2, r-package
Ggextra
📊 Add marginal histograms to ggplot2, and more ggplot2 enhancements
Stars: ✭ 299 (+51.78%)
Mutual labels:  ggplot2, r-package
cusumcharter
Easier CUSUM control charts. Returns simple CUSUM statistics, CUSUMs with control limit calculations, and function to generate faceted CUSUM Control Charts
Stars: ✭ 17 (-91.37%)
Mutual labels:  ggplot2, r-package
Gratia
ggplot-based graphics and useful functions for GAMs fitted using the mgcv package
Stars: ✭ 102 (-48.22%)
Mutual labels:  ggplot2, r-package
Ggpointdensity
📈 📊 Introduces geom_pointdensity(): A Cross Between a Scatter Plot and a 2D Density Plot.
Stars: ✭ 286 (+45.18%)
Mutual labels:  ggplot2, r-package
Tidymv
Tidy Model Visualisation for Generalised Additive Models
Stars: ✭ 25 (-87.31%)
Mutual labels:  ggplot2, r-package
Ggparliament
Simple parliament plots using ggplot2
Stars: ✭ 130 (-34.01%)
Mutual labels:  ggplot2, r-package
Data Science Toolkit
Collection of stats, modeling, and data science tools in Python and R.
Stars: ✭ 169 (-14.21%)
Mutual labels:  ggplot2
Cleannlp
R package providing annotators and a normalized data model for natural language processing
Stars: ✭ 174 (-11.68%)
Mutual labels:  r-package
Slopegraph
Edward Tufte-Inspired Slopegraphs
Stars: ✭ 166 (-15.74%)
Mutual labels:  ggplot2
Ggnet
Network visualization with ggplot2
Stars: ✭ 182 (-7.61%)
Mutual labels:  ggplot2
Gghalves
✂️ Easy half-half geoms in ggplot2
Stars: ✭ 174 (-11.68%)
Mutual labels:  ggplot2

ggdist: Visualizations of distributions and uncertainty

R build status Coverage status CRAN status Download count DOI

Preview of ggdist plots

ggdist is an R package that provides a flexible set of ggplot2 geoms and stats designed especially for visualizing distributions and uncertainty. It is designed for both frequentist and Bayesian uncertainty visualization, taking the view that uncertainty visualization can be unified through the perspective of distribution visualization: for frequentist models, one visualizes confidence distributions or bootstrap distributions (see vignette("freq-uncertainty-vis")); for Bayesian models, one visualizes probability distributions (see the tidybayes package, which builds on top of ggdist).

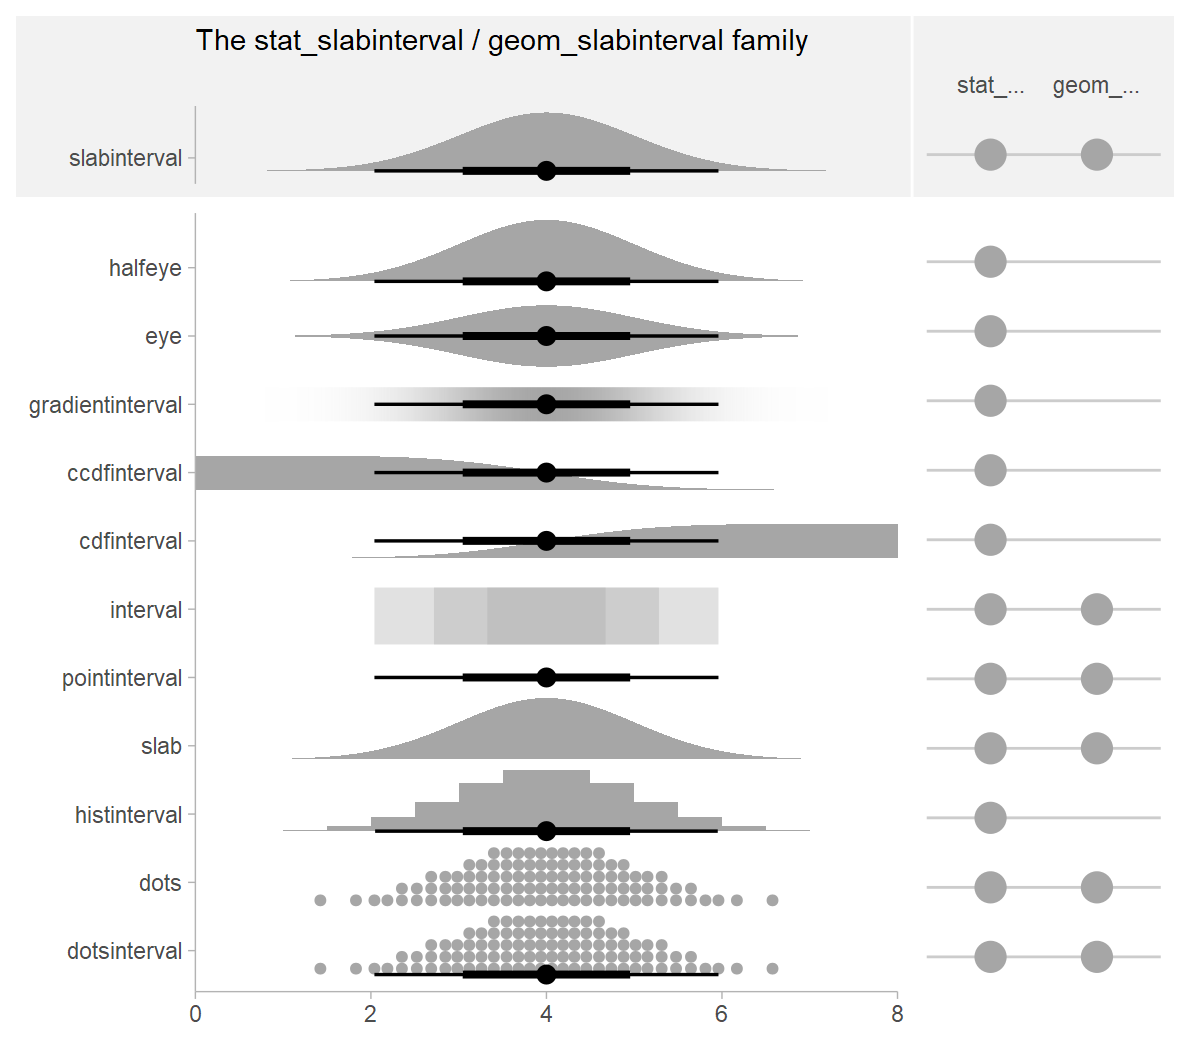
The geom_slabinterval() / stat_slabinterval() / stat_dist_slabinterval() family (see vignette("slabinterval")) includes point summaries and intervals, eye plots, half-eye plots, CCDF bar plots, gradient plots, dotplots, and histograms:

The slabinterval family of geoms and stats

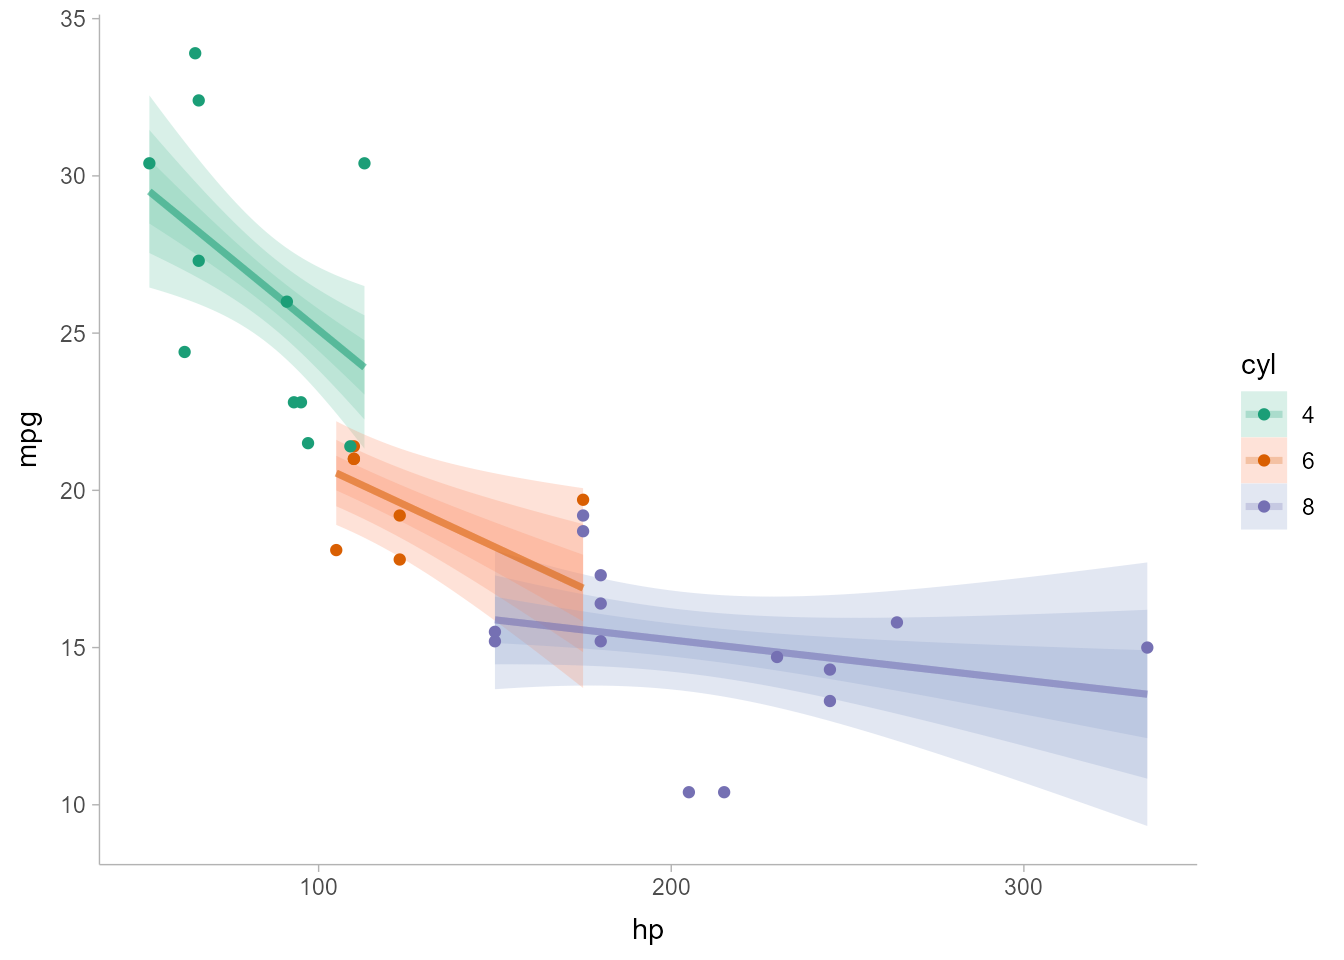
The geom_lineribbon() / stat_lineribbon() / stat_dist_lineribbon() family (see vignette("lineribbon")) makes it easy to visualize fit lines with an arbitrary number of uncertainty bands:

All geoms in ggdist also have stat_dist_ counterparts designed for visualizing analytical distributions, which is particularly useful when visualizing uncertainty in frequentist models (see vignette("freq-uncertainty-vis")) or when visualizing priors in a Bayesian analysis.

The ggdist geoms and stats also form a core part of the tidybayes package (in fact, they originally were part of tidybayes). For examples of the use of ggdist geoms and stats for visualizing uncertainty in Bayesian models, see the vignettes in tidybayes, such as vignette("tidybayes", package = "tidybayes") or vignette("tidy-brms", package = "tidybayes").

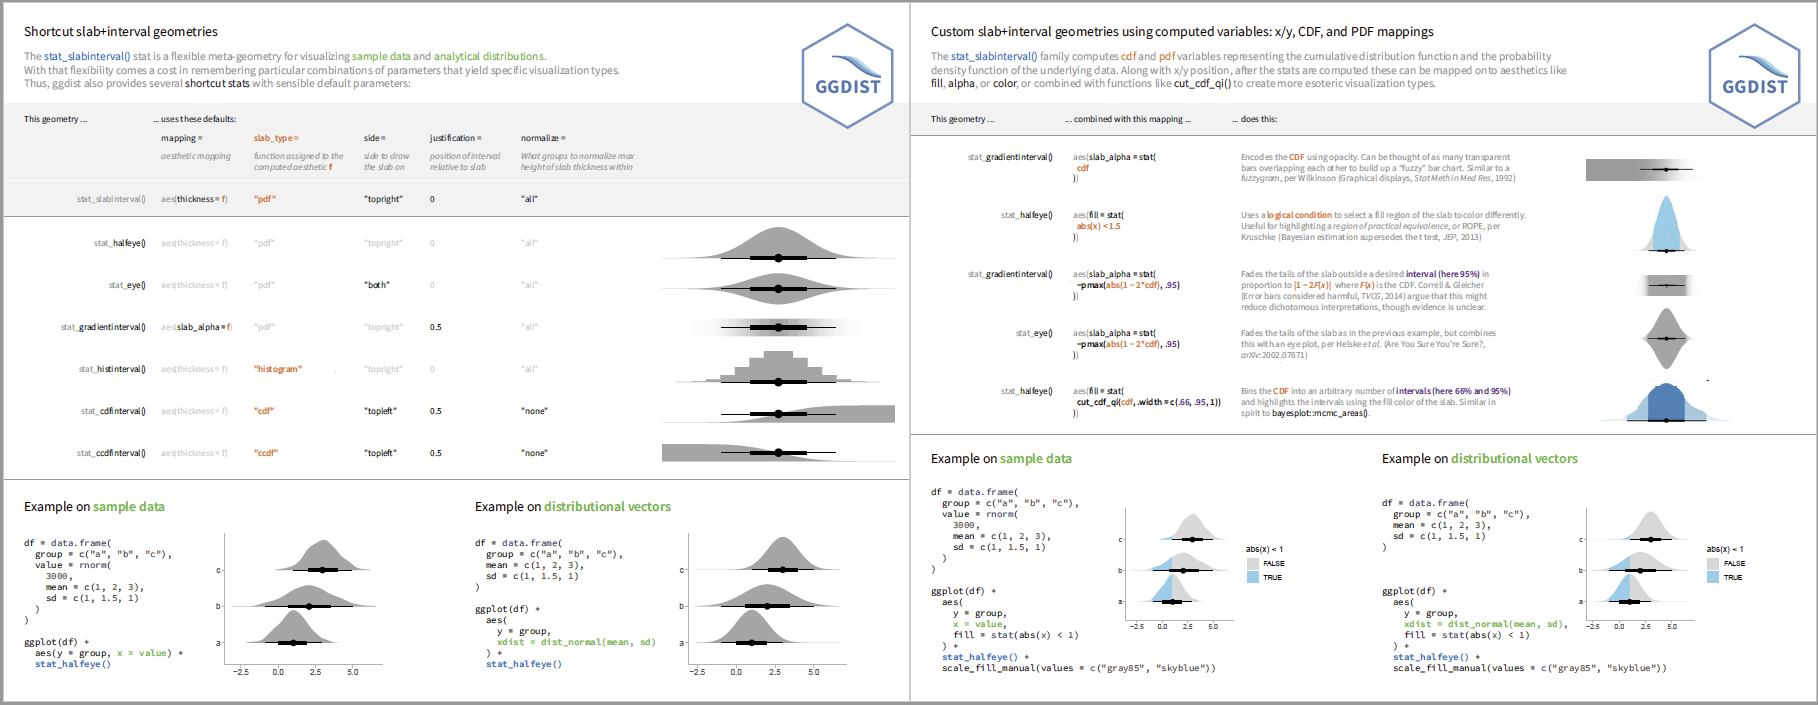
Cheat sheets

Installation

You can install the currently-released version from CRAN with this R command:

install.packages("ggdist")

Alternatively, you can install the latest development version from GitHub with these R commands:

install.packages("devtools")
devtools::install_github("mjskay/ggdist")

Feedback, issues, and contributions

I welcome feedback, suggestions, issues, and contributions! Contact me at [email protected]. If you have found a bug, please file it here with minimal code to reproduce the issue. Pull requests should be filed against the dev branch.

Citing ggdist

Matthew Kay (2020). ggdist: Visualizations of Distributions and Uncertainty. R package version 2.4.0, https://mjskay.github.io/ggdist/. DOI: 10.5281/zenodo.3879620.

Note that the project description data, including the texts, logos, images, and/or trademarks, for each open source project belongs to its rightful owner. If you wish to add or remove any projects, please contact us at [email protected].