JeremyMain / Gpuprofiler
Labels
Projects that are alternatives of or similar to Gpuprofiler
GPUProfiler 
DISCLAIMER:
I am an NVIDIA employee however GPUProfiler has been developed and released independently of my employment at NVIDIA. GPUProfiler is not an NVIDIA product, nor is it supported or endorsed by NVIDIA. It is provided as a binary-only Freeware closed source project.
GPUProfiler was created to accelerate analysis of resource utilization within physical environments to allow for better resource sizing for virtual GPU environments and troubleshoot performance issues.
Why?
I needed a small tool to understand existing system configuration and performance metrics that impact the sizing decision making process.
After several years of attempting to extract configuration information, utilization metrics and software configuration information from partners or customers, I realized that having a small tool that could be easily shared with partners and customers to help understand what resources are being highly utilized and the context of that utilization information.
GPUProfiler is not a source code profiler but a resource and utilization profile that can provide a snapshot of a system and select resource utilization metrics over a period of time.
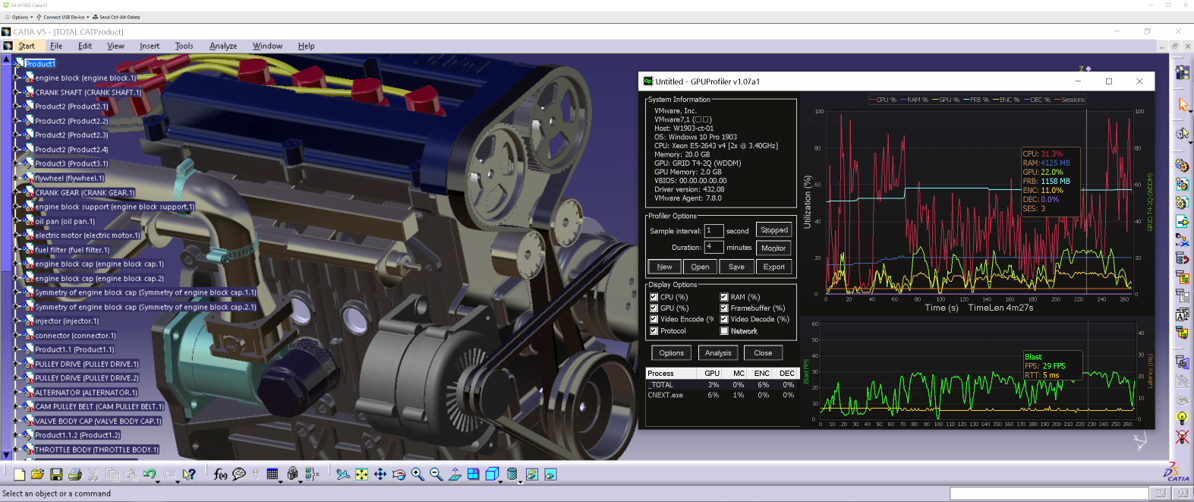
I included capturing many of the important system details to correlate utilization information within a sea of desktop, workstation and server hardware. These include: CPU type, number of logical cores, frequency, system memory, OS, GPU and driver version.
A small number of metrics using native calls or the NVIDIA APIs NVAPI or NVML were used to minimize measurement impact. When an NVIDIA GPU is not detected, all other metrics can be collected for comparing CPU only and GPU workloads. I initially attempted to stay away from using WMI based counters due to additional overhead incurred. However remoting protocol vendors only provide protocol metrics via WMI, therefore to enable capture of selected protocol metrics I am now using WMI when a native query is not available.
The tool was to be small, easy to run, collect, save and ultimately share with our partners. It has in my opinion become invaluable in sizing for vGPU environments and for troubleshooting both physical and virtual environments.
Latest Release
The latest release of GPUProfiler is v1.07a2 on 01-15-2021
https://github.com/JeremyMain/GPUProfiler/releases/tag/v1.07a2
Main Features
System information.
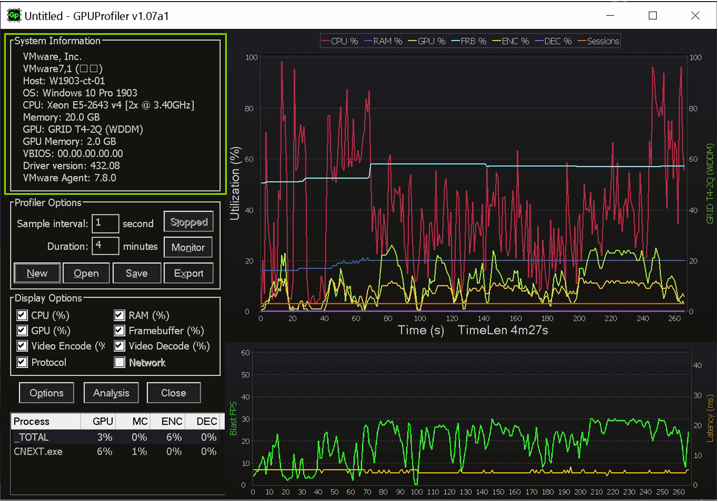
In this example we have a virtual machine that is running on VMWare vSphere. For physical machines it will collect the manufacturer, Model and BIOS information. The host name of the machine and the OS and build number. Next is the CPU model, number of logical cores and frequency as well as the system memory.
If detected, the NVIDIA GPU model or vGPU type, driver mode (WDDM or TCC), GPU memory and for physical machines the GPU VBIOS information. Finally the GPU driver version and hypervisor agent version.
Collection Options
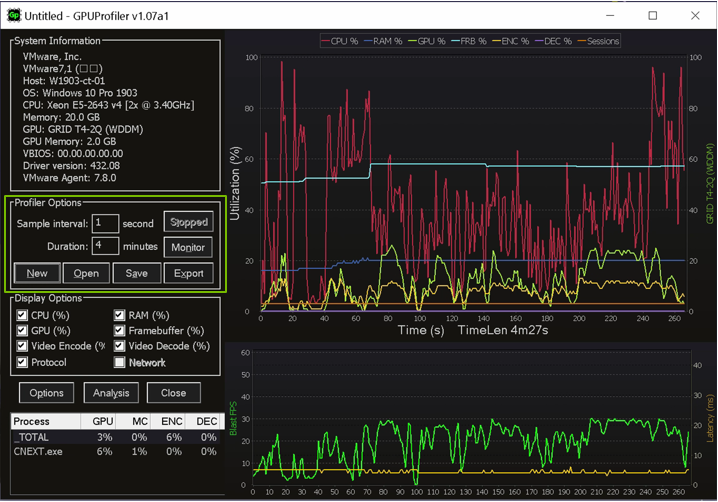 Collection options include the sample interval and duration when used with the “start” button. The monitor button allows for continuous monitoring of a 5 minute interval.
While monitoring, you can stop the monitor mode and save that in GPD format as well.
New will delete the current data an allow you to start collecting again. The save button will allow the current data to be saved in GPD format and the export button will export to a CSV file.
Display Options
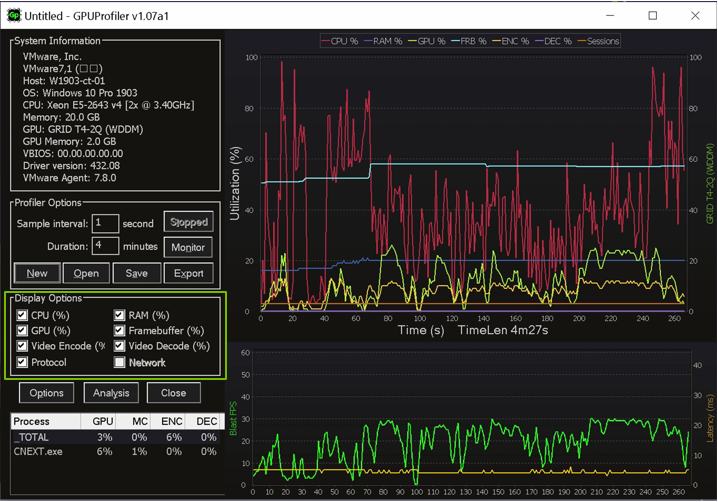 The display options will show or hide selected metrics.
Each metric has it’s own hotkey bindings, the first press will bold the line and the second keypress will hide the metric.
C for CPU, R for RAM, G for GPU, F for Framebuffer, E for Video Encode, D for Video Decode and P for Protocol metrics.
Selecting the checkbox will hide or show the selected counter utilization.
The hotkey B will allow all lines to be bolded in three steps.
If a metric does not have data in a loaded file the checkbox will be disabled.
The current release version does not have Network support enabled and is always disabled.
Process Utilization
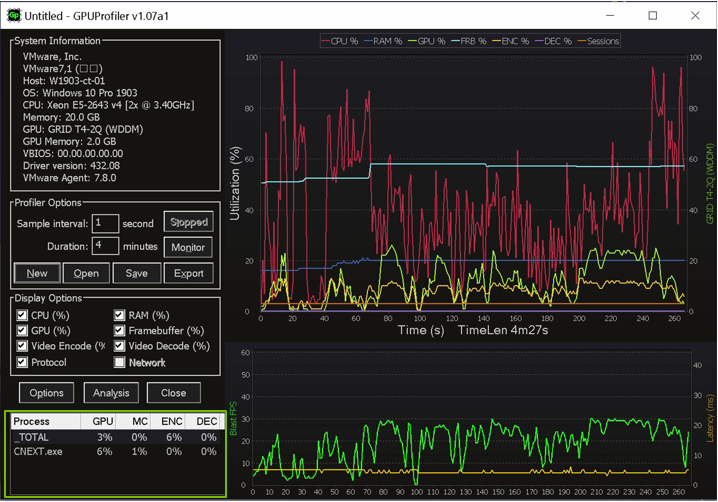 While collecting data, the current process that are using the GPU are displayed in the process utilization list. Process that do not have user query permission will not be displayed but will be part of the TOTAL utilization.
The elements shown are GPU, GPU Memory Controller, encoder and decoder utilization.
The process utilization information is not serialized in the GPD file.
Utilization Graphs
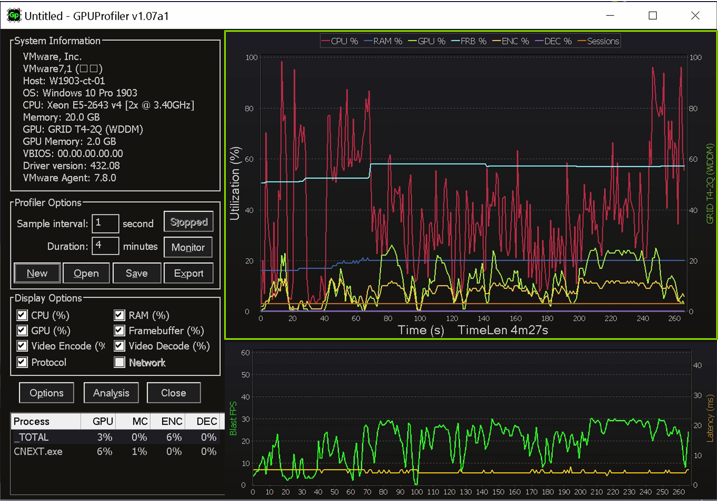 Within the utilization graphs, you may zoom in or out using the left mouse button or scroll using the right mouse button, scroll wheel or page up/down keys.
Control + scroll wheel will zoom into or out of the center of the graph.
Protocol Graphs
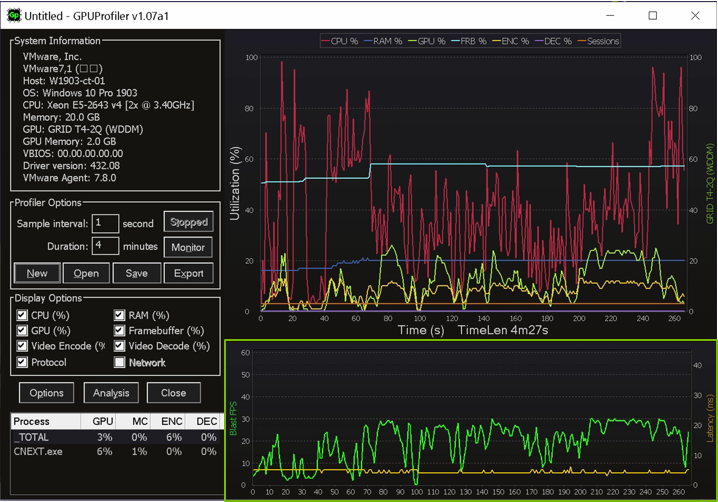 The protocol graph will be show in physical or virtual environments where a remote session is detected. The current protocol (HDX, PCoIP or Blast) remoted FPS as well as the protocol latency.
The protocol latency is a function of the network latency and the latency encode/decoding the protocol stream. When the protocol latency is highly variant, consider investigating the endpoint configuration to confirm it’s ability to support the protocol at the desired number of displays and resolutions.
Value Inspector
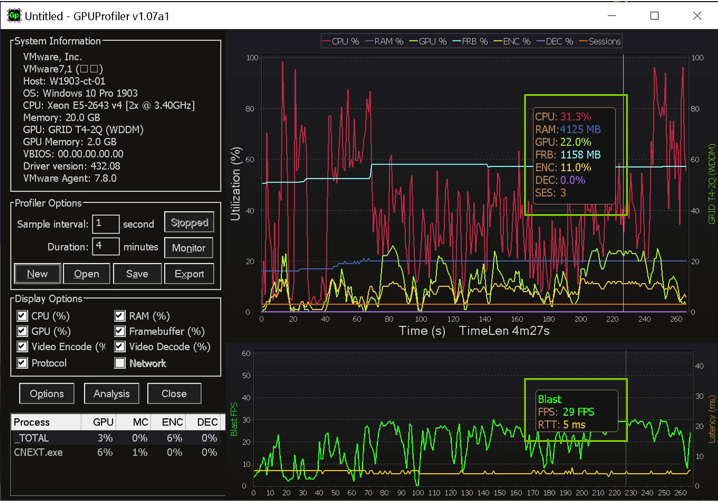 Within the utilization graphs, the hotkey V can be used to show or hide the Value inspector, or U for the Utilization inspector.
This will display the collected utilization values at a certain period of time.
Utilization Histogram
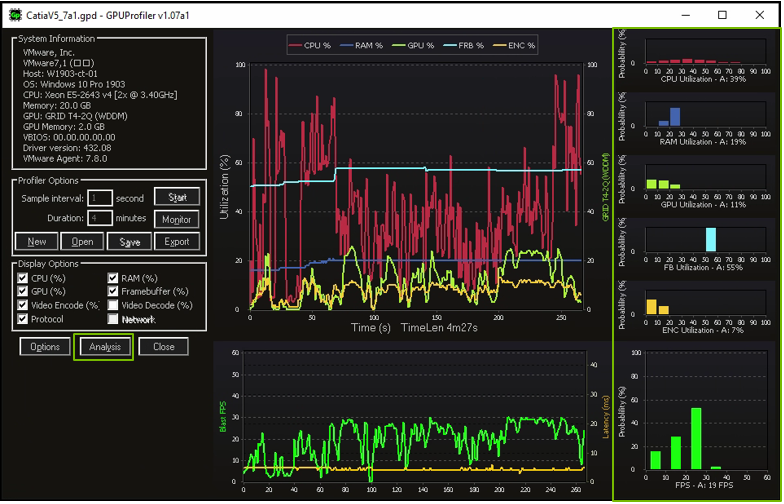 For the visible range, and analysis button will show a resource utilization histogram and average value over the range.
In future version, the method to display this information will need to be optimized to support multi-GPU configurations and new metrics.
Tool Window Mode
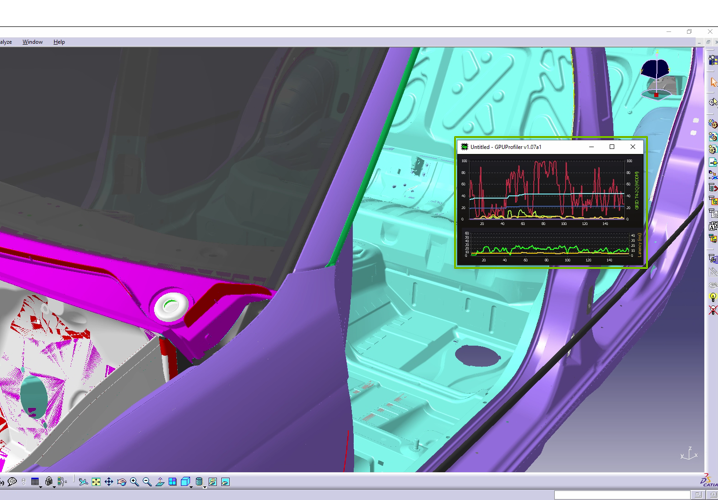 Double clicking the graph area will change the display mode to be a tool view, and via the options menu it can be selected to run as always on top if desired.
Double clicking the graph area again will revert back to the standard display mode.
Quick Start
Start with asking your customer to download GPUProfiler from the GitHub page, this allows me to understand the number of downloads of the tool. For customer security reasons that a direct download is not possible, please provide the tool as you see fit.
The customer would then extract the binary from the archive and start GPUProfiler.
NOTE: The binary is not yet signed and on first execution a security dialog will be displayed.
Next determine the duration that you would like to collect data and click the “start” button.
Have the customer start their workload and select the “stop” button if the workload procedure has completed before the duration has been reached. Save the GPD datafile with a descriptive name that identifies the workload or unique configuration being measured.
Compress the .GPD file and share with you. The customer may also wish to review the results and can do so by loading the GPD file in GPUProfiler as well as export the collected data to CSV format for further analysis.
Here is what GPUProfiler looks like after it has collected data from a vGPU VM that was running Dassault Systems Catia V5. In this case the remoting protocol was VMware Horizon Blast protocol.
There is no requirements to view the resulting GPUProfiler data file on the host where it was generated, nor do you need to have a GPU to view the data files. A console based version of GPUProfiler for Linux or Linux kernel derived hypervisors is in limited beta and will be released shortly.
Documentation
Development
Here is a brief look at some of the new additions in the new feature branch v1.07b
License State / Type
Collection of the current license state and license edition for vGPU customers. If a license is not detected it will display “Unlicensed”.
Displays and Resolutions
The number of connected displays and current resolutions. This will be updated each time a display is added or resolution is changed and will show the current display and resolutions when used with the value inspector.
Protocol Metrics
The protocol network Tx, RX and loss information will be available in a separate graph below the protocol metrics.
Bug Reports
Please submit a bug report for issues that occur or feature requests that would make the application more useful.
License
This software is provided as Freeware, this is a closed source project.
