Ultimate iDRAC Grafana Dashboard (Telegraf SNMP Based)
SNMP Based Dashboard to Monitor Dell Hosts via iDRAC
Grafana Dashboard ID: 12106
Features
- Uses Grafana variables to dynamically pull in all iDRACs listed in the Telegraf config file, and draw a new "row" section for each iDRAC that gets added.
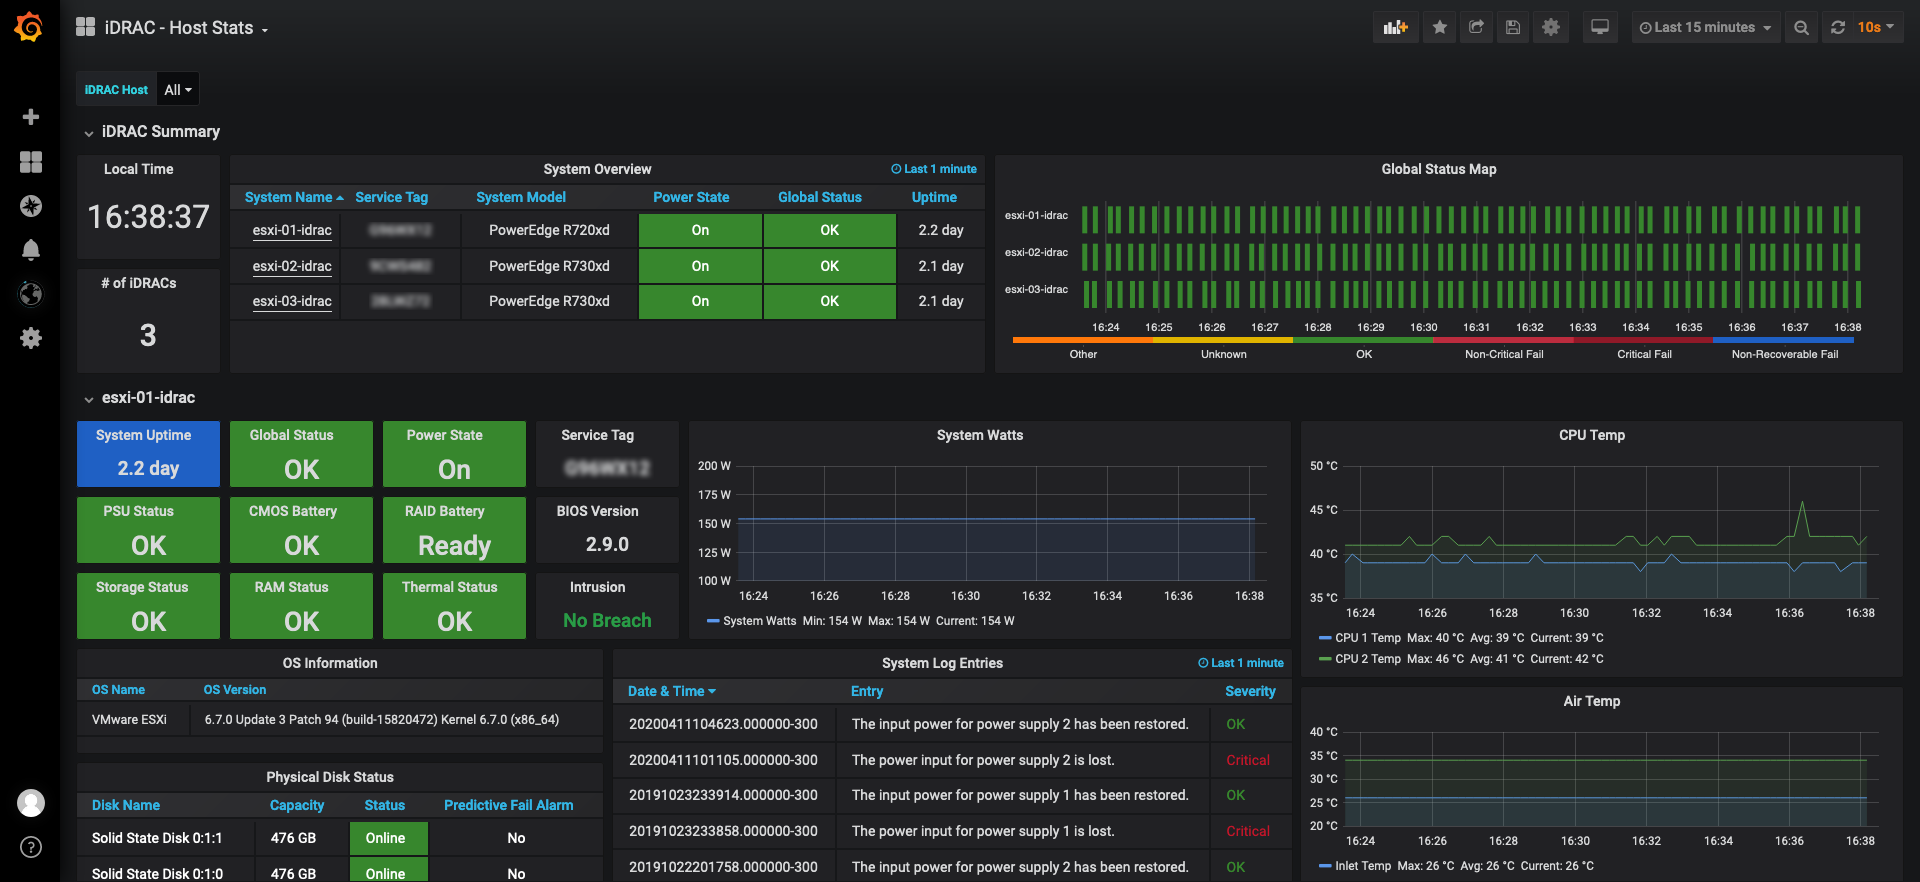
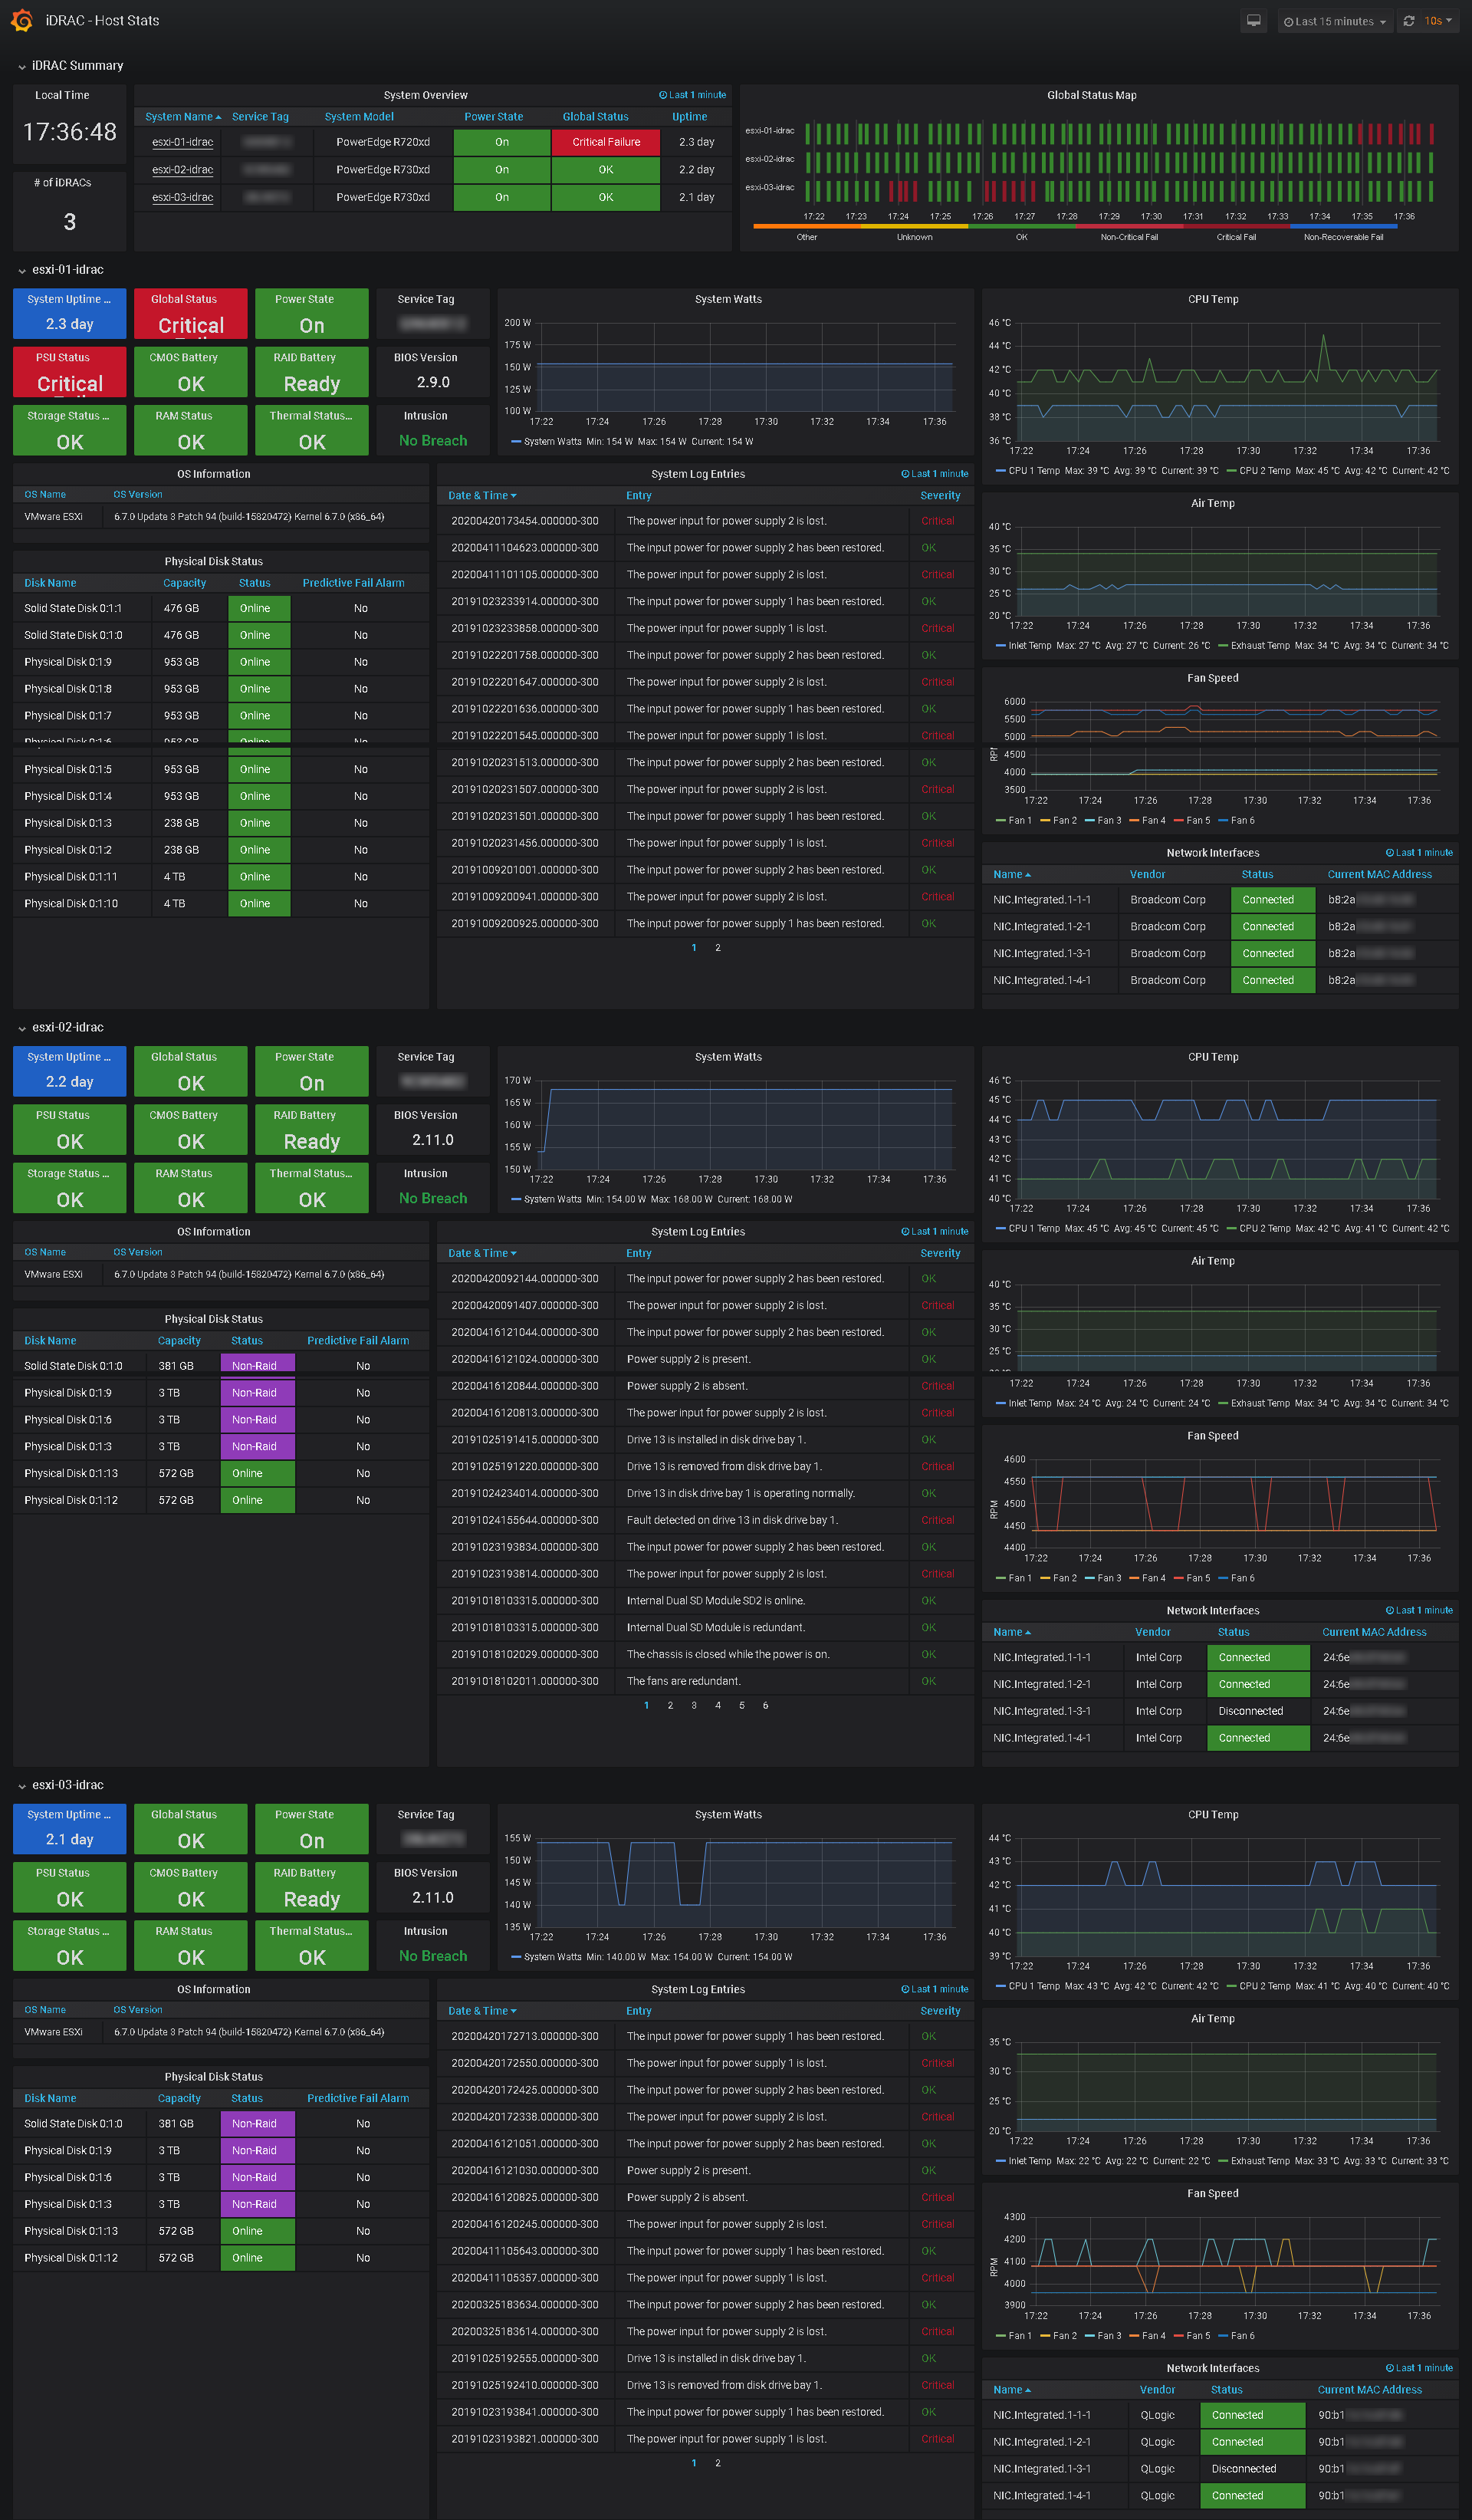
- Displays summary table and global status "heat" map of all iDRACs being polled.
- Summary table pulls in each iDRAC URL so clicking System Name in the table brings you directly to that iDRAC's logon page.
- Panels and table cells change color to indicate failures or other status messages.
- Variable selection box allows fine-tuning of which systems are displayed on the dashboard. (Default is "All").
- Each system's section on the dashboard is dynamically drawn based on variable selection to show the following data for each host:
- Uptime, Global Status, Power State, PSU Status, CMOS Battery Status, RAID Battery Status, Storage Status, RAM Status, & Thermal Status
- Service Tag, BIOS Version, and Intrusion Sensor Status
- OS Name and OS Version Table
- System Power (in watts) Graph
- CPU Temp Graph
- System Air Temp Graph
- Fan Speed Graph
- Physical Disk Status Table (Disk Name, Capacity, Status, Predictive Fail Alarm)
- System Log Entries Table
- Network Interfaces Table (NIC Name, Vendor, Status, MAC Address)
- Adding more data is as simple as adding the appropriate iDRAC OID to the Telegraf config file, and adding a panel to display the new data on the dashboard.
How To Use
Enable SNMPv1 in the iDRACs you wish to monitor. Install and setup Telegraf, InfluxDB, and Grafana to work with eachother. Use the provided idrac-input.conf file (place in /etc/telegraf/telegraf.d folder or paste into your main telegraf config) and replace the values for "idracURLx" under "agent" with your own iDRAC IPs or hostnames. Restart Telegraf. Then, import the dashboard json file (or use Grafana Dashboard ID) to add the dashboard and panels to Grafana, selecting your own InfluxDB database after clicking "Import". Data may take up to 2 minutes to fully populate the first time. Enjoy!
Pre-requirements
Telegram:
net-snmp or snmp installed (snmptable and snmptranslate)
Grafana:
install the following plugins:
Full Screenshot
This screenshot shows the full dashboard with 3 systems being monitored and displayed.
Build Environment
- Grafana for visualization of data
- Telegraf for data collection with SNMP Input Plugin
- InfluxDB for time series and table data storage
- iDRAC with SNMP Enabled (v1) - Tested with iDRAC 7 and iDRAC 8 on Dell Poweredge r720xd and r730xd servers.
Adding More Data and Panels
iDRAC has the capability to display a TON of data through SNMP and it's easy to expand this dashboard to add more of it, per your collection and monitoring needs. I used the Dell MIB Files with an MIB Browser and the Dell EMC OpenManage SNMP Reference Guide to figure out the OIDs.
Known Issues / Needs Work
One of the only major data related problems I could not figure out was the proper display of Date & Time for system log entries. Dell outputs a date & time stamp for each log entry in the format: 20200420173454.000000-300. This is what is displayed in the system log table panel as Grafana can't understand and re-format dates and times in this provided format it seems, to make it looks pretty, such as YYYY-MM-DD HH:MM:SS I have heard that Telegraf/InfluxDB may have a way for this data to be transformed into a better structure before it makes it to Grafana, although I have come up empty with easy or even semi-easy ways to do this. Hoping somebody else knows a fix that isn't extremely involved.
Fix implemented per @krystiancharubin regex processor in idrac-input.conf
- Sometimes, for only a few seconds, the data in the tables repeats itself and gets out of line, even though the "group by" in the query has a limit of 1.