walterra / Kibana Milestones Vis
Programming Languages
Projects that are alternatives of or similar to Kibana Milestones Vis
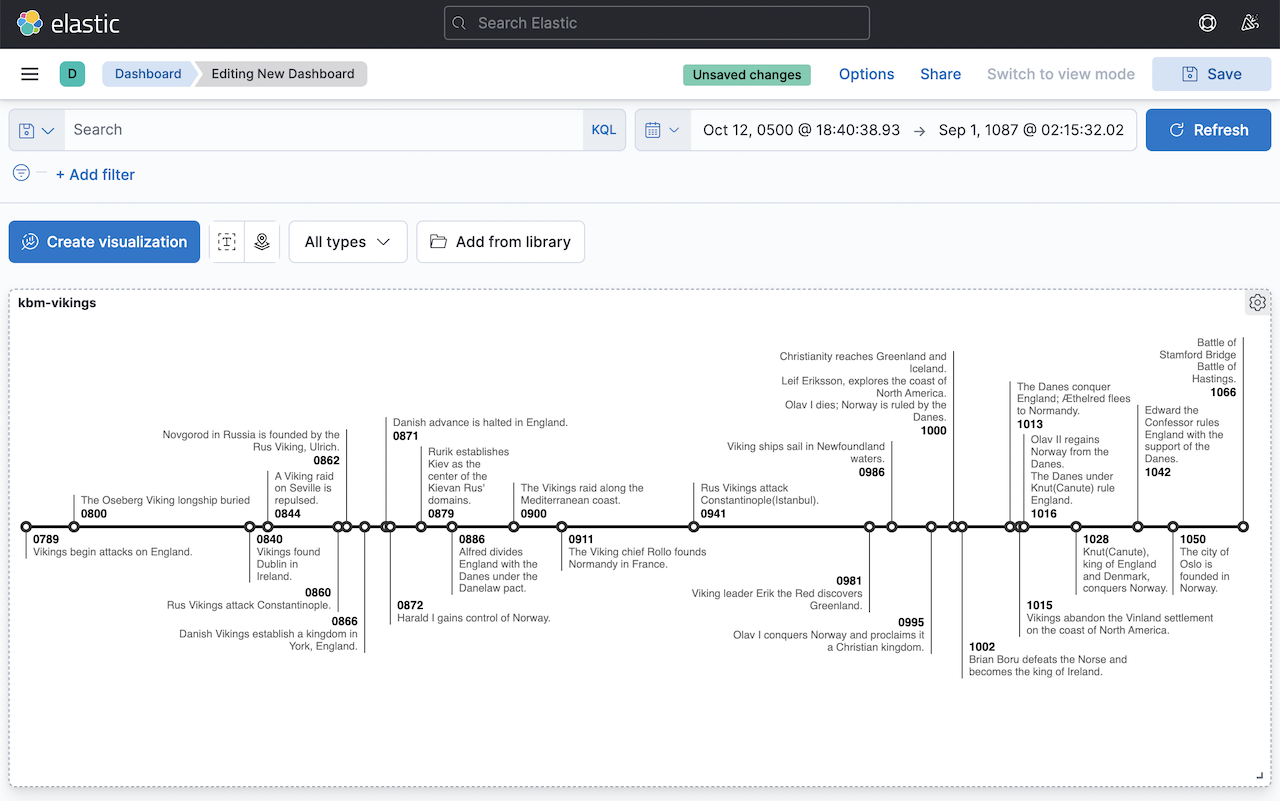
Milestones Visualization for Kibana
This plugin is a wrapper for the stand-alone library d3-milestones (https://github.com/walterra/d3-milestones) to make its functionality available within Kibana.
Installation
Compatibility
To get a version of this plugin which is compatible with your version of Kibana, have a look at the releases page on GitHub: https://github.com/walterra/kibana-milestones-vis/releases
The releases of this plugin are synced with Kibana's release cycle. In the "Assets" section of each release you'll find a zipped build of the plugin which you can use. These zip files are named in the following way: kibana_milestones_vis-<plugin-version>.zip. The plugin-version should match the version of Kibana you're using.
General Installation Pattern
Run the following from within your Kibana folder:
bin/kibana-plugin install https://github.com/walterra/kibana-milestones-vis/releases/download/v7.4.0/kibana_milestones_vis-7.4.0.zip
Installing by first downloading a zipped release
- Head over to https://github.com/walterra/kibana-milestones-vis/releases and download the ZIP of the version you want to use, e.g. https://github.com/walterra/kibana-milestones-vis/releases/download/v7.4.0/kibana_milestones_vis-7.4.0.zip
- Inside your kibana directory, run
bin/kibana-plugin install file:///<path-to-file>/kibana_milestones_vis-7.4.0.zip, thennpm run start
Usage
- Create a Kibana index pattern including a time filter.
- Go to
Visualize > Create New Visualizationand choose the Milestones visualization in the Time Series section. - In the next view, pick the index pattern you created.
- You should end up on the visualization's page where you can tweak it. Make sure you have the right time span selected (upper right corner).
- The visualization works best with sparse data. While there is some optimization going on to distribute labels, you might get irritating results with data which results in too many labels.
Wishlist
Automatic Labels for each timeline when there are multiple ones-
More intuitive initial setup of the visualization(7.3.0) -
Use something more performant than the(7.3.0)top_hitsaggregation -
Consolidate aggregation options (X-Axis and Options panel)(7.3.0) - Option to switch to a vertical view and/or option to scroll
- Optimize label placement when there are lots of label closer to the boundary of the timeline
Development
See DEVELOPMENT.md.

