sh0nk / Matplotlib4j
Projects that are alternatives of or similar to Matplotlib4j
matplotlib4j
A simplest interface library to enable your java project to use matplotlib.
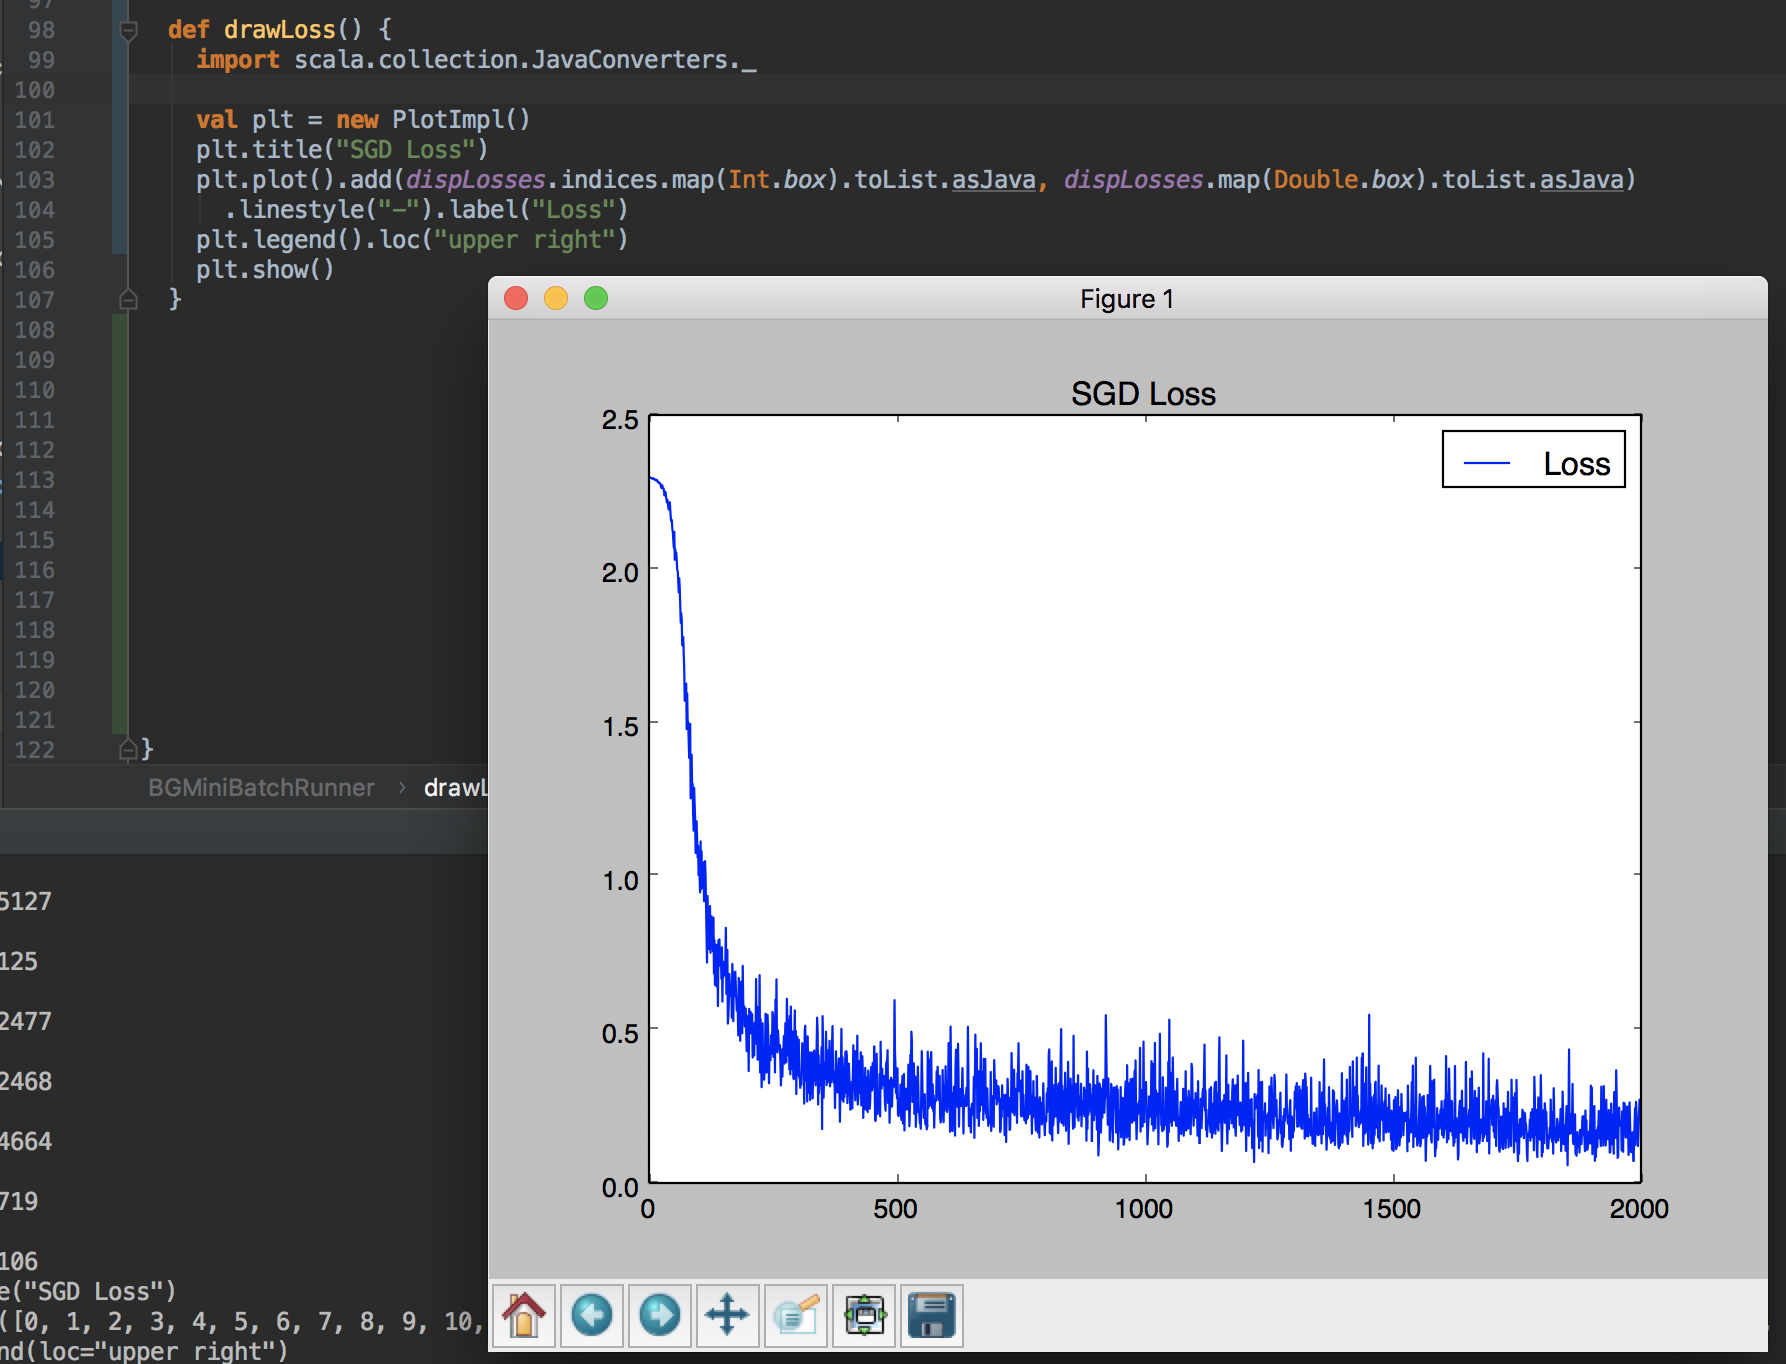
Of course it is able to be imported to scala project as below. The API is designed as similar to the original matplotlib's.

How to use
Here is an example. Find more examples on MainTest.java
Plot plt = Plot.create();
plt.plot()
    .add(Arrays.asList(1.3, 2))
    .label("label")
    .linestyle("--");
plt.xlabel("xlabel");
plt.ylabel("ylabel");
plt.text(0.5, 0.2, "text");
plt.title("Title!");
plt.legend();
plt.show();
Another example to draw Contour.

// Data generation
List<Double> x = NumpyUtils.linspace(-1, 1, 100);
List<Double> y = NumpyUtils.linspace(-1, 1, 100);
NumpyUtils.Grid<Double> grid = NumpyUtils.meshgrid(x, y);

List<List<Double>> zCalced = grid.calcZ((xi, yj) -> Math.sqrt(xi * xi + yj * yj));

// Plotting
Plot plt = Plot.create();
ContourBuilder contour = plt.contour().add(x, y, zCalced);
plt.clabel(contour)
    .inline(true)
    .fontsize(10);
plt.title("contour");
plt.legend().loc("upper right");
plt.show();
In addition to the interactive window opened by .show(), .savefig() is also supported.
Only one thing to note is that plt.executeSilently() triggers to output figure files after calling .savefig().
This is by design as method chain coding style.
Random rand = new Random();
List<Double> x = IntStream.range(0, 1000).mapToObj(i -> rand.nextGaussian())
        .collect(Collectors.toList());

Plot plt = Plot.create();
plt.hist().add(x).orientation(HistBuilder.Orientation.horizontal);
plt.ylim(-5, 5);
plt.title("histogram");
plt.savefig("/tmp/histogram.png").dpi(200);

// Don't miss this line to output the file!
plt.executeSilently();
This code generates the following picture at /tmp/histogram.png.

Major supported functions
- plot()
- pcolor()
- contour()
- hist()
- savefig()
- subplot()
- xlim(), ylim(), xscale(), yscale(), xlabel(), ylabel()
Pyenv support
It is possible to choose a python environment to run matplotlib with pyenv and pyenv-virtualenv support. Create Plot object by specifying existing names as follows.
// with pyenv name
Plot plt = Plot.create(PythonConfig.pyenvConfig("anaconda3-4.4.0"));
// with pyenv and virtualenv name
Plot plt = Plot.create(PythonConfig.pyenvVirtualenvConfig("anaconda3-4.4.0", "env_plot"));
Other way to specify your "python" environment
Also direct path to python binary is also supported. For example this way can be used if your python runtime is installed
by poetry and venv.
Plot plt = Plot.create(PythonConfig.pythonBinPathConfig("/Users/sh0nk/my_repos/.venv/bin/python"));
Dependency
- Java 8
- Python with Matplotlib installed
It may work with almost all not too old Python and Matplotlib versions, but no guarantee. It has been tested
on MacOS with
- Python 2.7.10, 3.6.1
- Matplotlib 1.3.1, 2.0.2
If it does not work on your environment, please report that through github issue with the error message and your environment (OS, python and matplotlib versions).
Configure on your project
This library is now found on maven central repository.
Import to your projects as follows.
Maven
<dependency>
    <groupId>com.github.sh0nk</groupId>
    <artifactId>matplotlib4j</artifactId>
    <version>0.4.0</version>
</dependency>
Gradle
compile 'com.github.sh0nk:matplotlib4j:0.4.0'
License
MIT

