简体中文 | English
MyPerf4J
一个针对高并发、低延迟应用设计的高性能 Java 性能监控和统计工具。


价值
- 快速定位性能瓶颈
- 快速定位故障原因
优势
- 高性能: 单线程支持每秒 1600 万次 响应时间的记录,每次记录只花费 63 纳秒
- 无侵入: 采用 JavaAgent 方式,对应用程序完全无侵入,无需修改应用代码
- 低内存: 采用内存复用的方式,整个生命周期只产生极少的临时对象,不影响应用程序的 GC
- 高实时: 支持秒级统计,最低统计粒度为 1 秒,并且是全量统计,不丢失任何一次记录
文档
监控指标
MyPerf4J 为每个应用收集数十个监控指标,所有的监控指标都是实时采集和展现的。
下面是 MyPerf4J 目前支持的监控指标列表:
-
Method Metrics
RPS,Count,Avg,Min,Max,StdDev,TP50, TP90, TP95, TP99, TP999, TP9999, TP100
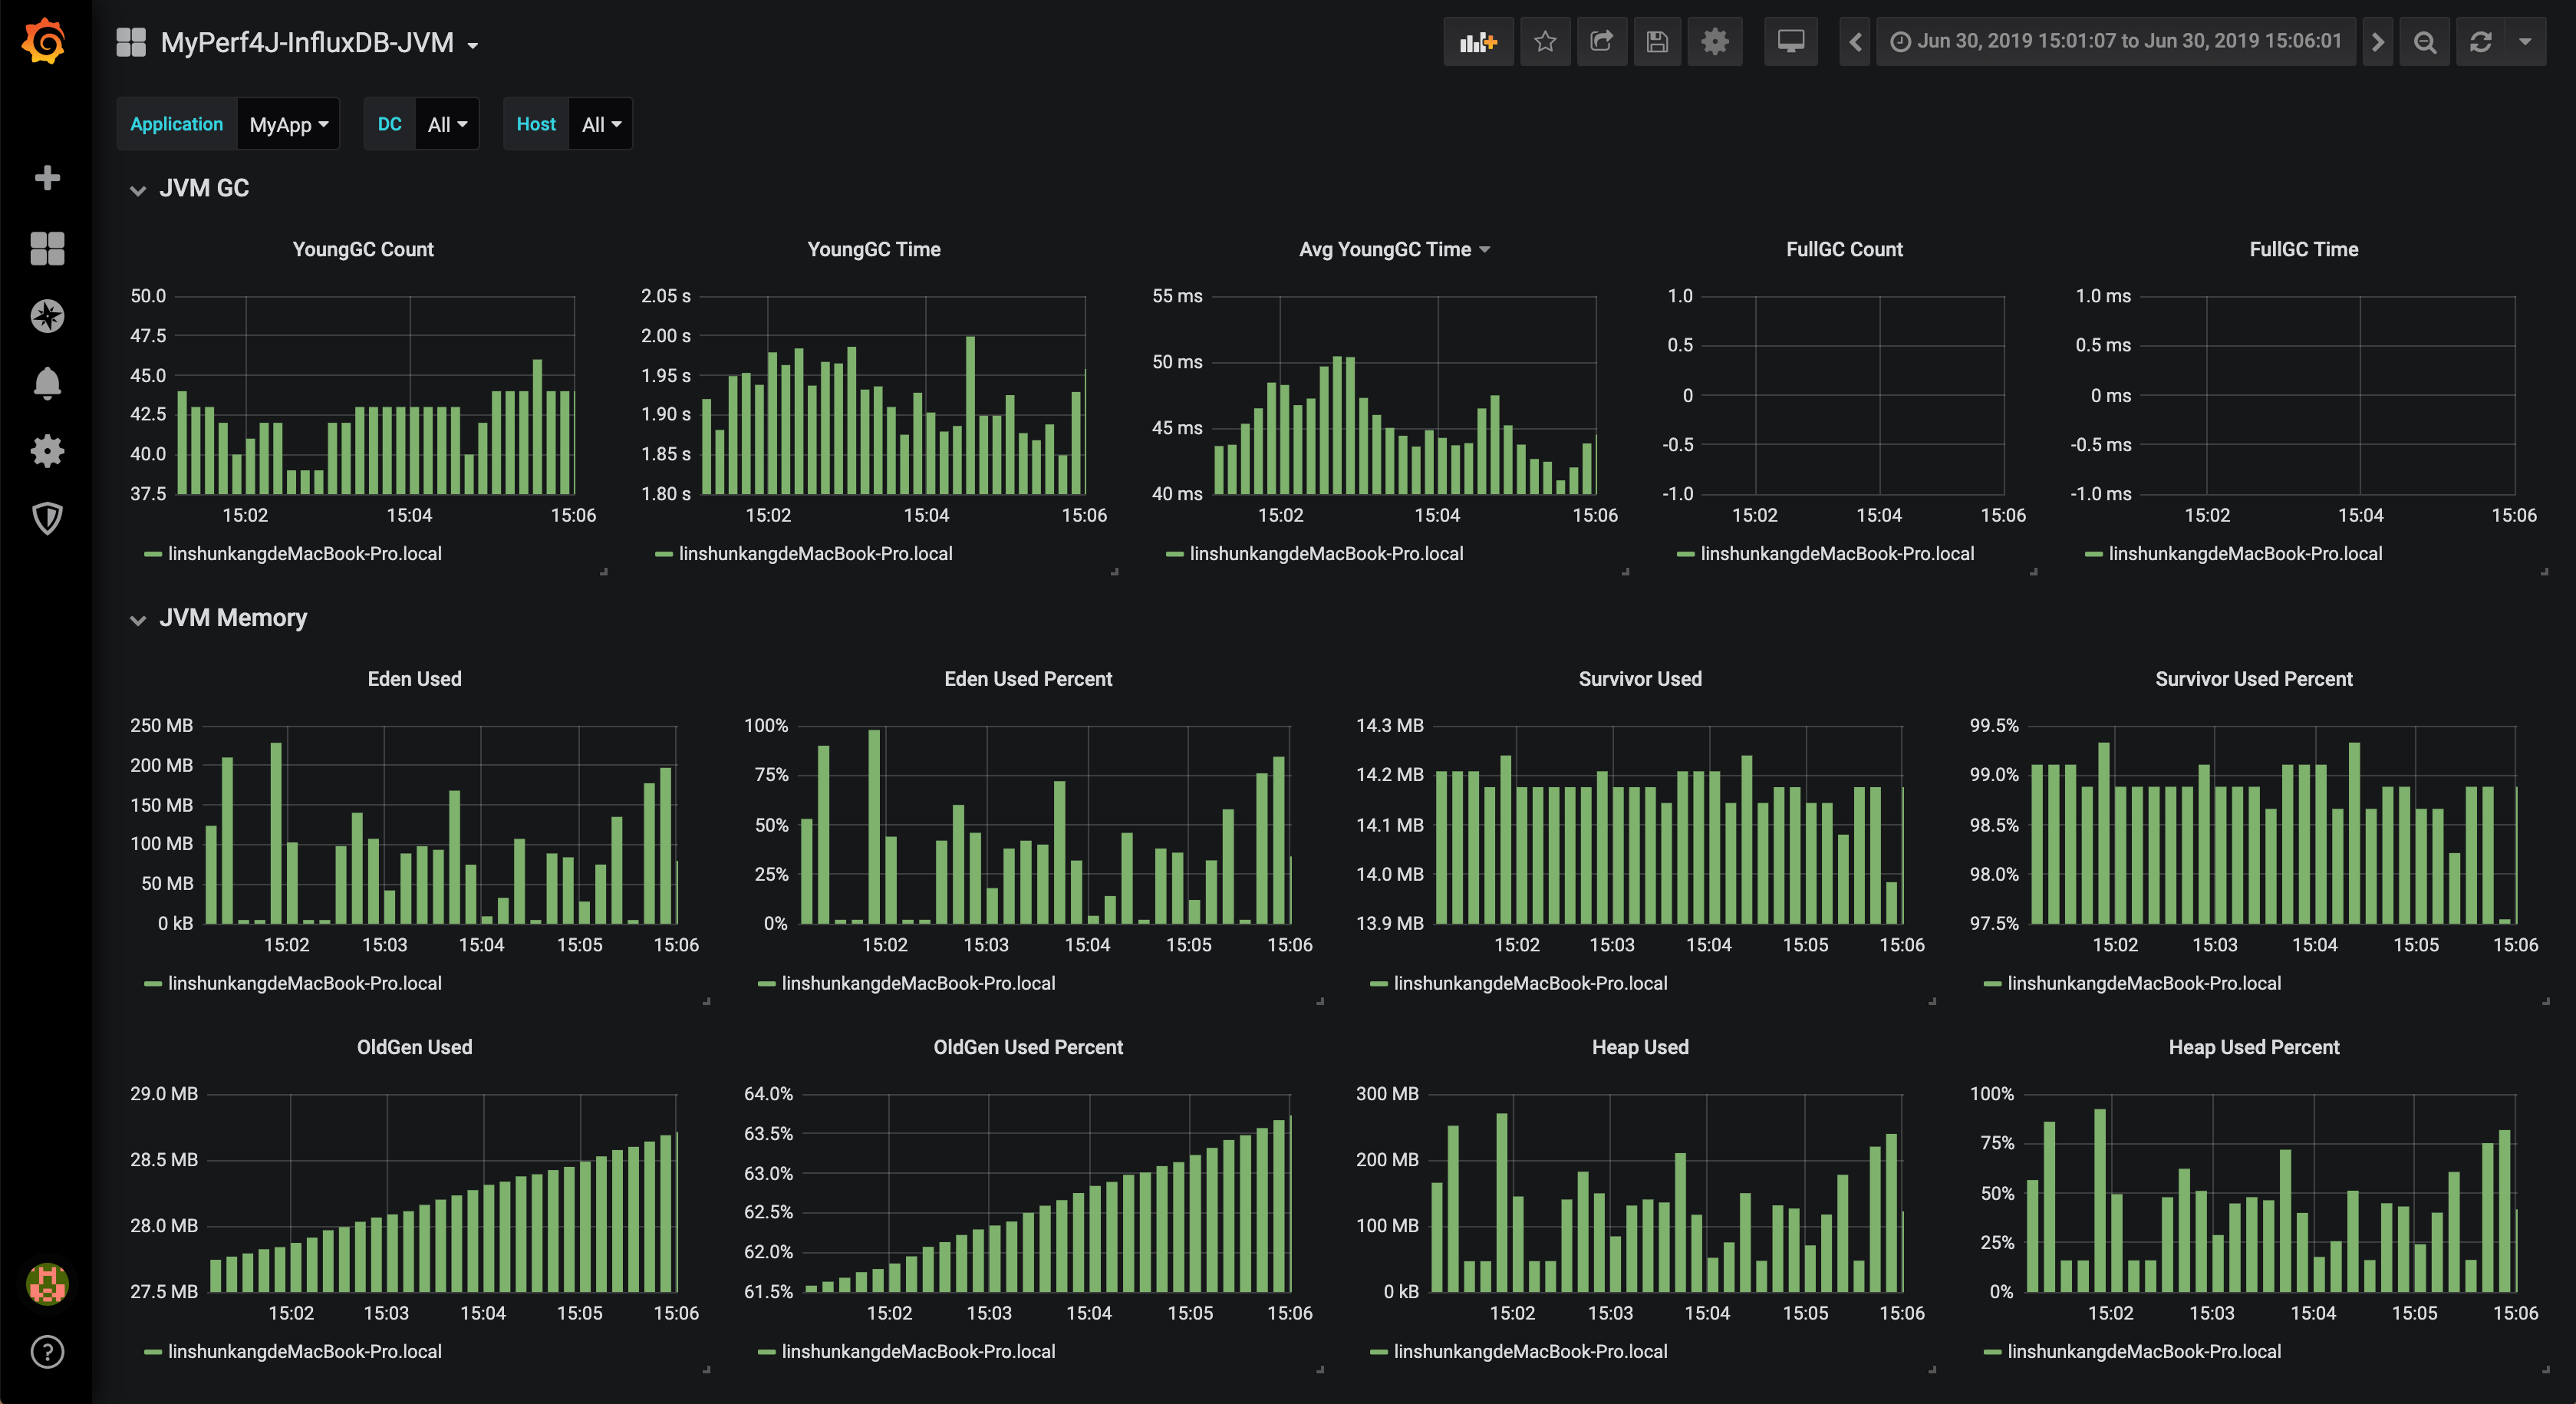
-
JVM Metrics
Thread,Memory,ByteBuff,GC,Class,Compilation,FileDescriptor
快速启动
MyPerf4J 采用 JavaAgent 配置方式,透明化接入应用,对应用代码完全没有侵入。
下载
- 下载并解压 MyPerf4J-ASM.zip
- 阅读解压出的
README文件 - 修改解压出的
MyPerf4J.properties配置文件中app_name、metrics.log.xxx和filter.packages.include的配置值
配置
在 JVM 启动参数里加上以下两个参数
- -javaagent:/path/to/MyPerf4J-ASM.jar
- -DMyPerf4JPropFile=/path/to/MyPerf4J.properties
形如:java -javaagent:/path/to/MyPerf4J-ASM.jar -DMyPerf4JPropFile=/path/to/MyPerf4J.properties
-jar yourApp.jar
运行
启动应用,监控日志输出到 /path/to/log/method_metrics.log:
MyPerf4J Method Metrics [2020-01-01 12:49:57, 2020-01-01 12:49:58]
Method[6]                            Type        Level  TimePercent      RPS  Avg(ms)  Min(ms)  Max(ms)    StdDev    Count     TP50     TP90     TP95     TP99    TP999   TP9999
DemoServiceImpl.getId2(long)      General      Service      322.50%     6524     0.49        0        1     0.50      6524        0        1        1        1        1        1
DemoServiceImpl.getId3(long)      General      Service      296.10%     4350     0.68        0        1     0.47      4350        1        1        1        1        1        1
DemoServiceImpl.getId4(long)      General      Service      164.60%     2176     0.76        0        1     0.43      2176        1        1        1        1        1        1
DemoServiceImpl.getId1(long)      General      Service        0.00%     8704     0.00        0        0     0.00      8704        0        0        0        0        0        0
DemoDAO.getId1(long)         DynamicProxy          DAO        0.00%     2176     0.00        0        0     0.00      2176        0        0        0        0        0        0
DemoDAO.getId2()             DynamicProxy          DAO        0.00%     2176     0.00        0        0     0.00      2176        0        0        0        0        0        0
卸载
在 JVM 启动参数中去掉以下两个参数,重启即可卸载此工具。
- -javaagent:/path/to/MyPerf4J-ASM.jar
- -DMyPerf4JPropFile=/path/to/MyPerf4J.properties
构建
您可以自行构建 MyPerf4J-ASM.jar
- git clone [email protected]:LinShunKang/MyPerf4J.git
- mvn clean package
MyPerf4J-ASM-${MyPerf4J-version}.jar 在 MyPerf4J-ASM/target/ 目录下
问题
如果您有任何问题、疑问或者建议,您可以 提交Issue 或者 发送邮件 :)
注意,为了保障大家的时间,请保证您已经完整阅读过以下内容:
已知用户
如果您在使用 MyPerf4J,请告诉我,您的使用对我来说非常重要:https://github.com/LinShunKang/MyPerf4J/issues/30(按登记顺序排列)


项目捐赠
如果 MyPerf4J 对您有帮助,可以使用微信扫描下面的赞赏码,请我喝杯咖啡 : )

参考项目
MyPerf4J 是受以下项目启发而来:
更多信息
想更深入的了解 MyPerf4J?请看 https://github.com/LinShunKang/MyPerf4J/wiki/Chinese-Doc。