Chicago / Osd Street Center Line
Programming Languages
Labels
Projects that are alternatives of or similar to Osd Street Center Line
README
The City of Chicago is releasing selected datasets from the data portal under the MIT License (see below). This repository contains:
- Data in a GeoJSON format.
- Examples of importing data into R, Python, and Ruby.
- Instructions to transform data from the data portal to data in the repository.
Working with GeoJSON Data
The data was released as a GeoJSON file. Below are some simple instructions which will show you how to load GeoJSON in R, Python, and Ruby.
R
Find an example script here. This example will import the data in R and create a couple of maps.
Instructions:
-
Set the working directory to the location of the downloaded repository.
setwd("path\\to\\folder")
-
Install the "rgdal" library to let R read and translate the data from GeoJSON to a Shapefile. We will use "ggplot2" library to transform the spatial data frame to a regular data frame--and to make a map.
install.packages(c("rgdal","ggplot2"))
-
Load the libraries:
library(rgdal)
library(ggplot2)
-
Import data to a spatial dataframe. City data is typically created using the transverse Mercator projection.
ogrInfo("data\\Transportation.json", layer="OGRGeoJSON")
transportation.shapefile <- readOGR(dsn="data\\Transportation.json", layer="OGRGeoJSON", p4s="+proj=tmerc +ellps=WGS84")
-
Ensure the map works:
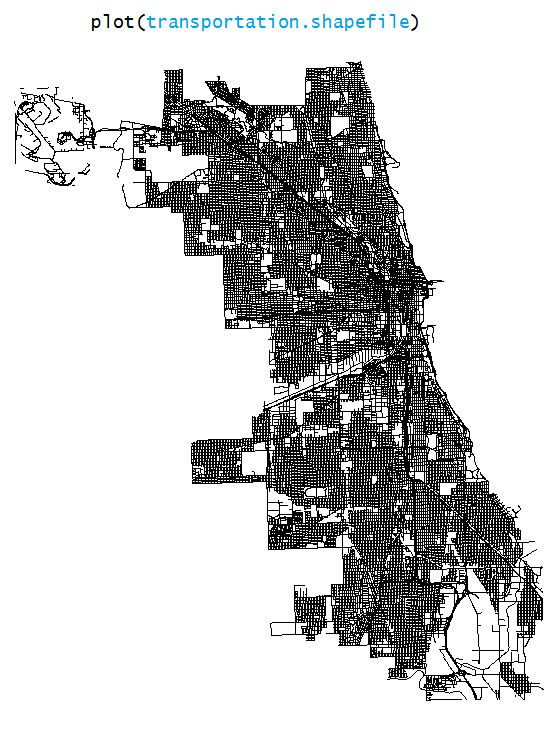
plot(transportation.shapefile)
-
Lets convert the spatial dataframe to a typical dataframe.
transportation.table <- fortify(transportation.shapefile)
-
Review the new dataframe.
head(transportation.table)
-
Plot the data.
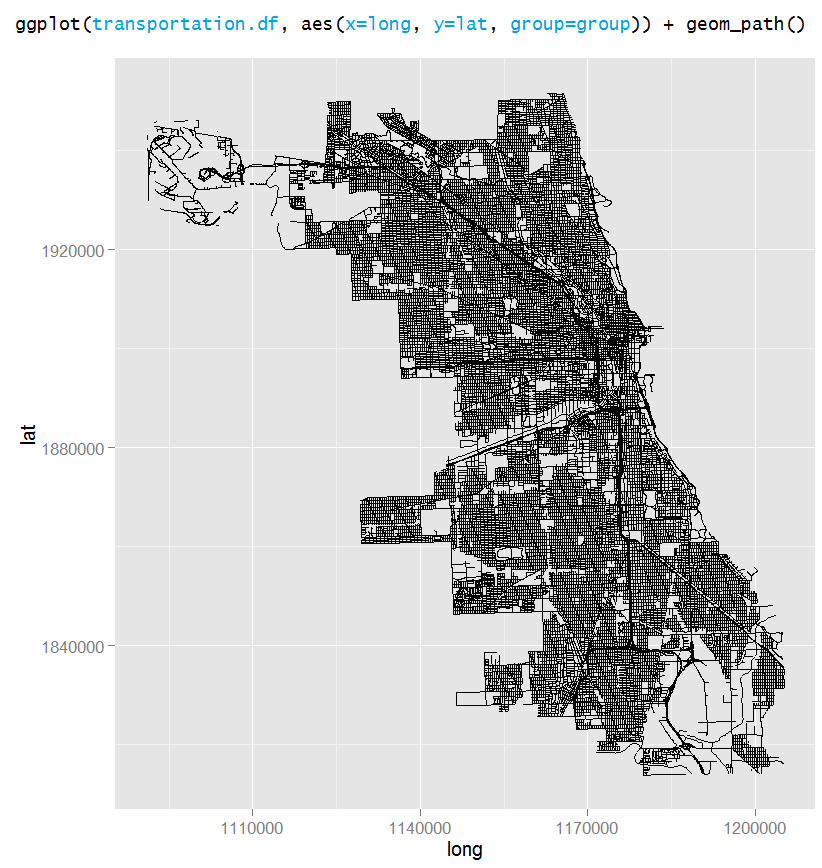
ggplot(transportation.table, aes(x=long, y=lat, group=group)) + geom_path()
Here is the output you should expect from the plot() command:

Here is the output you should expect from the ggplot() command:

Python
Find an example script here.
-
Load the necessary json and pprint libraries.
import json
-
Open GeoJSON data file.
transportation_json = open('PATH/TO/osd-street-center-line/data/Transportation.json', 'r')
-
Check first few lines of data (repeat this command several times)
transportation.readline()
-
Load GeoJSON file.
transportation = json.load(transportation_json)
-
Close the open GeoJSON file.
json.close(transportation_json)
Ruby
An example ruby script is provided to show loading GeoJSON and running spatial analysis using the RGeo suite. A simple Gemfile is provided to make getting the dependencies and using them easy.
$ cd PATH/TO/osd-street-center-line/examples/ruby
$ bundle
$ ruby example.rb
This example script filters the Transportation.json to street segments within a 500ft buffer of 50 W Washington.
Differences between data portal and this repository
Though the data in this repository is also available on Chicago's data portal, the data in this repository is different in several ways. First, the data within this repository is released under the MIT License. Second, this data has been edited to remove internal codes which do not provide useful information. Third, after changes were made to the dataset, the original shapefile was converted to GeoJSON using GDAL's ogr2ogr
The translation from portal to repository involves several steps. First, the original DBF file is transformed using OpenRefine to elminate unhelpful columns and clean data. The "Transformatons" folder contains the corresponding JSON, which contains the detailed list of changes made to the original table.
The resulting shapefile is then translated to GeoJSON using the ogr2ogr from the GDAL application. The transformation is completed in the command prompt:
$ ogr2ogr -f "GeoJSON" Transortation_ogr.json /path/to/portal/data/Transportation.shp
Unfortunately, ogr2ogr outputs in machine, but not human-readable files. We use Python's simplejson.tool to transform the data to the final JSON file.
$ type Transportation_ogr.json | python -m simplejson.tool > Transportation.json
The folder "Transformations" contains the necessary code to transform data on the portal to the release in this repository.
License
This data is released under the MIT License. See LICENSE.txt.
