fabfuel / Prophiler
Projects that are alternatives of or similar to Prophiler
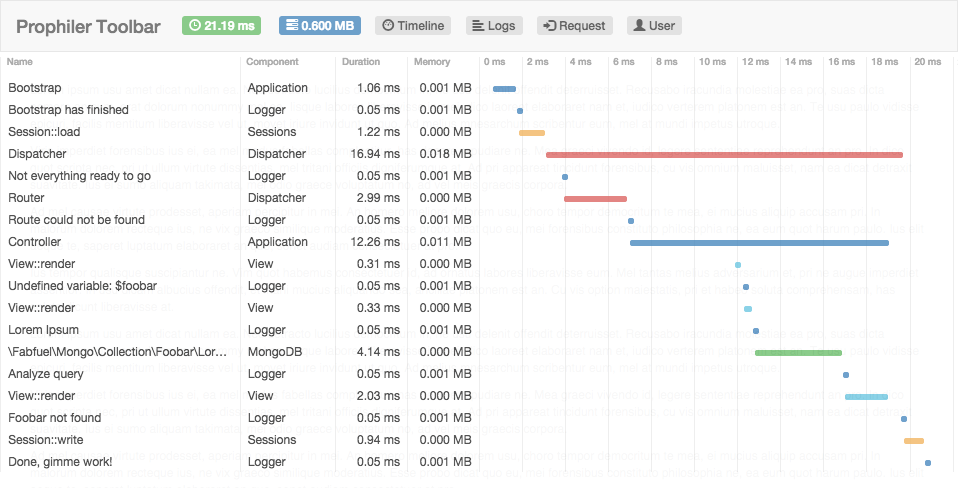
Prophiler - A PHP Profiler & Developer Toolbar built for Phalcon


Demo
The demo website has been moved to a separate repository: https://github.com/fabfuel/prophiler-demo
Here you can see the toolbar in action: http://prophiler.fabfuel.de/demo.php
Installation
You can use composer to install the Prophiler. Just add it as dependency:
"require": {
   	"fabfuel/prophiler": "~1.0",
}
Setup (general)
Setting up the Prophiler and the developer toolbar can be done via the following simple steps. It could all be done in your front-controller (e.g. public/index.php in Phalcon)
1. Initialize the Profiler (as soon as possible)
Generally it makes sense to initialize the profiler as soon as possible, to measure as much execution time as you can. You should initialize the profiler in your front-controller or the bootstrap file right after requiring the Composer autoloader.
$profiler = new \Fabfuel\Prophiler\Profiler();
2. Initialize and register the Toolbar
To visualize the profiling results, you have to initialize and render the Prophiler Toolbar. This component takes care for rendering all results of the profiler benchmarks and other data collectors. Put that at the end of the front-controller.
You can also add other data collectors to the Toolbar, to show e.g. request data like in this example.
$toolbar = new \Fabfuel\Prophiler\Toolbar($profiler);
$toolbar->addDataCollector(new \Fabfuel\Prophiler\DataCollector\Request());
echo $toolbar->render();
You can also easily create you own data collectors, by implementing the DataCollectorInterface and adding an instance to the Toolbar.
...
$toolbar->addDataCollector(new \My\Custom\DataCollector());
...
Additional setup for Phalcon applications
1. Add the profiler to the dependency injection container
Add the profiler instance to the DI container, that other plugins and adapters can use it across the application. This should be done in or after your general DI setup.
$di->setShared('profiler', $profiler);
2. Initialize the plugin manager
The plugin manager registers all included Phalcon plugins automatically and attaches them to the events manager. To make the plugins work properly, make sure that the default events manager is attached to your Dispatcher, View and Connection services.
$pluginManager = new \Fabfuel\Prophiler\Plugin\Manager\Phalcon($profiler);
$pluginManager->register();
Custom Benchmarks
You can easily add custom benchmarks to your code:
$benchmark = $profiler->start('\My\Class::doSomething', ['additional' => 'information'], 'My Component');
...
$profiler->stop($benchmark);
Or stop without passing the benchmark
In some scenarios (e.g. custom adapters) it might be hard to pass the received benchmark to the stop() method. Alternatively you can simply omit the $benchmark parameter. If that is the case, the profiler simply stops the last started benchmark, but it is not possible to run overlapping benchmarks.
$profiler->start('\My\Class::doSomeOtherThing', ['additional' => 'information'], 'My Component');
...
$profiler->stop();
Aggregations
Prophiler now features benchmark aggregations. These give you a lot more insights and are extremely useful to:
- quickly see the total number of recurring executions (e.g. database or cache queries)
- analyze minimum, maximum and average execution times of recurring executions
- easily see (e.g. accidentally) recurring executions of the same database query
- get a warning, if the total number of executions exceeds a custom threshold
- get a warning, if the maximum execution time exceeds a custom threshold
Setup
Prophiler comes with some aggregators, but you can easily create your own. To Set up an aggregator, all you need to do is to register the aggregator at the profiler instance:
$profiler->addAggregator(new \Fabfuel\Prophiler\Aggregator\Database\QueryAggregator());
$profiler->addAggregator(new \Fabfuel\Prophiler\Aggregator\Cache\CacheAggregator());
That's it. You immediately see all database and cache queries, grouped by command/query, including the total number of executions, the total duration of all executions as well as the minimum, maximum and average execution time.
Logging
You can use Prophiler to log events and other data and view it in the timeline and in the separate "Logs" tab. If you already have a logging infrastructure, you can add the PSR-3 compliant Logger adapter to it. Otherwise you can also just instantiate and use it directly:
$logger = new \Fabfuel\Prophiler\Adapter\Psr\Log\Logger($profiler);
$logger->warning('This is a warning!', ['some' => 'context']);
$logger->debug('Some debugging information', ['query' => ['user' => 12345], 'foo' => 'bar']);
Adapters and Decorators
Doctrine
To profile all SQL queries made by Doctrine, you just have to register the SQLLogger adapter in your Doctrine configuration, for example in your bootstrap.php like that:
$sqlLogger = new Fabfuel\Prophiler\Adapter\Doctrine\SQLLogger($profiler);
$entityManager->getConnection()->getConfiguration()->setSQLLogger($sqlLogger);
PDO
To profile your PDO database actions, you can use the Prophiler PDO decorator. It will record all query() & exec() calls and prepared statements as well. Just decorate your PDO instance with the Prophiler decorator and use that instead:
$pdo = new PDO('mysql:host=localhost;dbname=test', 'user', 'password');
$db = new \Fabfuel\Prophiler\Decorator\PDO\PDO($pdo, $profiler);

$db->query('SELECT * from users');
$db->exec('DELETE FROM users WHERE active = 0');
$db->prepare('SELECT * from users WHERE userId = ?');
Cache
To profile Phalcon cache backend requests, you only need to decorate the cache backend with the BackendDecorator. It will benchmark all cache operations automatically. Here is an example with the APC backend:
$cacheFrontend = new \Phalcon\Cache\Frontend\Data(['lifetime' => 172800]);
$cacheBackend = new \Phalcon\Cache\Backend\Apc($cacheFrontend, ['prefix' => 'app-data']);

$cache = \Fabfuel\Prophiler\Decorator\Phalcon\Cache\BackendDecorator($cacheBackend, $profiler);
Elasticsearch
To profile Elasticsearch requests, you only need to decorate the Elasticsearch client with the ClientDecorator:
$elasticsearch = new Elasticsearch\Client(['your' => 'config']);
$client = new \Fabfuel\Prophiler\Decorator\Elasticsearch\ClientDecorator($client, $profiler);
Tips
Record session writing
To record session writing, you can commit (this is also known as session_write_close()) the session before rendering the toolbar
session_commit();