All Projects → Flagsmith → React Native Performance Monitor

Flagsmith / React Native Performance Monitor

React Native Performance Monitor - Realtime graphing of React Native render performance

Programming Languages

javascript
184084 projects - #8 most used programming language

Projects that are alternatives of or similar to React Native Performance Monitor
Permon
A tool to monitor everything you want. Clean, simple, extensible and in one place.
Stars: ✭ 73 (-58.05%)
Mutual labels:  monitoring, performance
Icinga2
Icinga is a monitoring system which checks the availability of your network resources, notifies users of outages, and generates performance data for reporting.
Stars: ✭ 1,670 (+859.77%)
Mutual labels:  monitoring, performance
React Pinpoint
An open source utility library for measuring React component render times.
Stars: ✭ 93 (-46.55%)
Mutual labels:  performance, react-components
Node Servertiming
📊 Generate Server-Timing headers interactively in NodeJS
Stars: ✭ 19 (-89.08%)
Mutual labels:  monitoring, performance
Pinpoint
APM, (Application Performance Management) tool for large-scale distributed systems.
Stars: ✭ 11,883 (+6729.31%)
Mutual labels:  monitoring, performance
Stats Js
JavaScript Performance Monitor using canvas
Stars: ✭ 12 (-93.1%)
Mutual labels:  monitoring, performance
React Native Image Slider Box
A simple and fully customizable React Native component that implements an Image Slider UI.
Stars: ✭ 113 (-35.06%)
Mutual labels:  react-components, react-native-component
Inspectit
inspectIT is the leading Open Source APM (Application Performance Management) tool for analyzing your Java (EE) applications.
Stars: ✭ 513 (+194.83%)
Mutual labels:  monitoring, performance
Scouter
Scouter is an open source APM (Application Performance Management) tool.
Stars: ✭ 1,792 (+929.89%)
Mutual labels:  monitoring, performance
Lighthouse Monitor
Investigate performance over your whole company with lighthouse
Stars: ✭ 136 (-21.84%)
Mutual labels:  monitoring, performance
Pcp
Performance Co-Pilot
Stars: ✭ 716 (+311.49%)
Mutual labels:  monitoring, performance
Heapinspector For Ios
Find memory issues & leaks in your iOS app without instruments
Stars: ✭ 1,819 (+945.4%)
Mutual labels:  monitoring, performance
Swagger Stats
API Observability. Trace API calls and Monitor API performance, health and usage statistics in Node.js Microservices.
Stars: ✭ 559 (+221.26%)
Mutual labels:  monitoring, performance
Go Tdigest
A T-Digest implementation in golang
Stars: ✭ 67 (-61.49%)
Mutual labels:  monitoring, performance
Automon
Automon combines the power of AOP (AspectJ) with monitoring or logging tools you already use to declaratively monitor your Java code, the JDK, and 3rd party libraries.
Stars: ✭ 548 (+214.94%)
Mutual labels:  monitoring, performance
Amon
Amon is a modern server monitoring platform.
Stars: ✭ 1,331 (+664.94%)
Mutual labels:  monitoring, performance
Watchdoginspector
Shows your current framerate (fps) in the status bar of your iOS app
Stars: ✭ 497 (+185.63%)
Mutual labels:  monitoring, performance
Ruby server timing
Bring Rails server-side performance metrics 📈 to Chrome's Developer Tools via the Server Timing API. Production Safe™.
Stars: ✭ 508 (+191.95%)
Mutual labels:  monitoring, performance
Stagemonitor
an open source solution to application performance monitoring for java server applications
Stars: ✭ 1,664 (+856.32%)
Mutual labels:  monitoring, performance
React Live Chat Loader
Implement a live chat beacon in your React application without performance regressions.
Stars: ✭ 145 (-16.67%)
Mutual labels:  performance, react-components

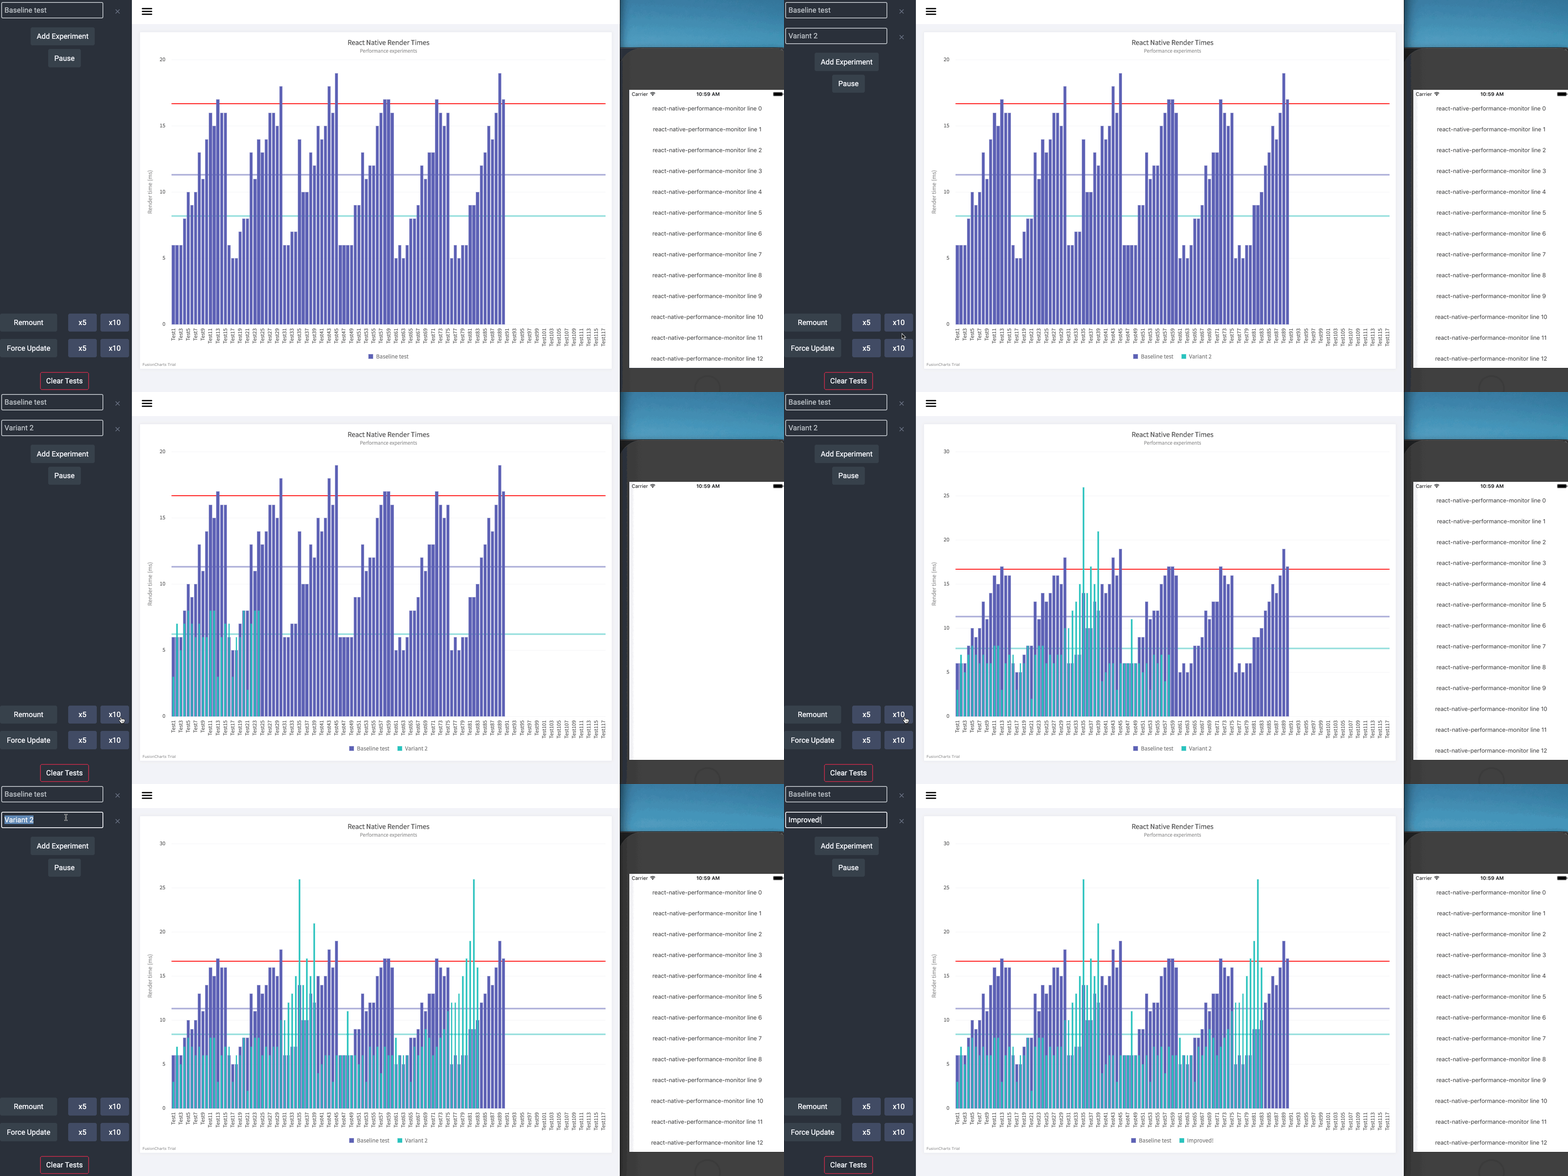
This project lets you see a realtime graph of render times within your React Native app. The purpose is for you to be able to create experiments (i.e. change markup and see how it affects render times).

Installation

npm i react-native-performance-monitor --save
npx react-native-performance-monitor get

Usage

import withPerformanceMonitor from 'react-native-performance-monitor/provider';
export default withPerformanceMonitor(YourScreen, 'Screen Name');

An example

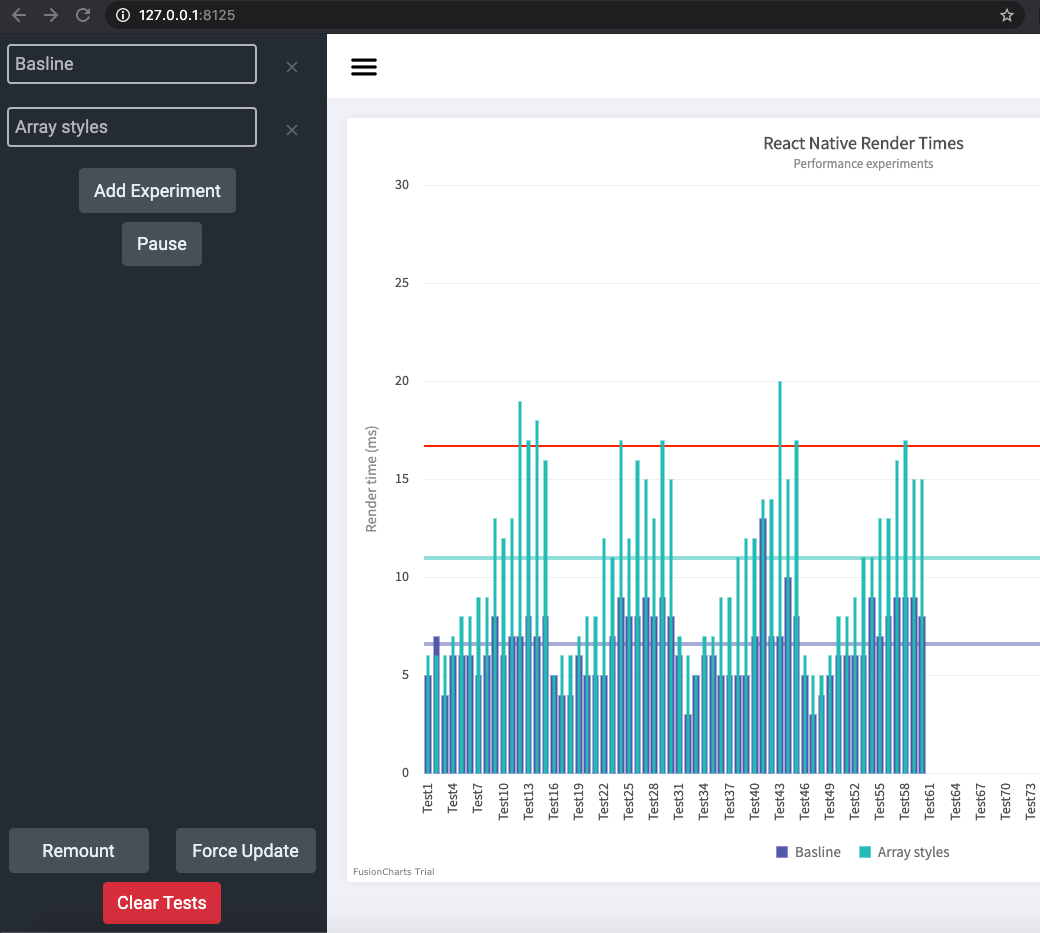
Set your baseline at http://127.0.0.1:8125/ by clicking remount. Pause the recorder, and adjust your component with what you think will improve performance.

Here's a before and after with this approach

Baseline

<Text style={[this.props.style]}>
    {this.props.children}
</Text>

Improved

<Text style={this.props.style}>
    {this.props.children}
</Text>

With this before and after I observed the following within a large flat list.
Connecting to a real device

In order to connect to a real device you will need to set the IP of your computer, for example:

export default withPerformanceMonitor(AwesomeChat, 'AwesomeChat', '192.168.1.10');

By default the server is listening on port 8125 for event updates and 8126 for websocket. If you need to configure the port, because you are tunneling your request or similar, and or disable the Websocket communication, you can do it like this:

export default withPerformanceMonitor(AwesomeChat, 'AwesomeChat', '192.168.1.10', undefined, undefined, 80, false);

How it works

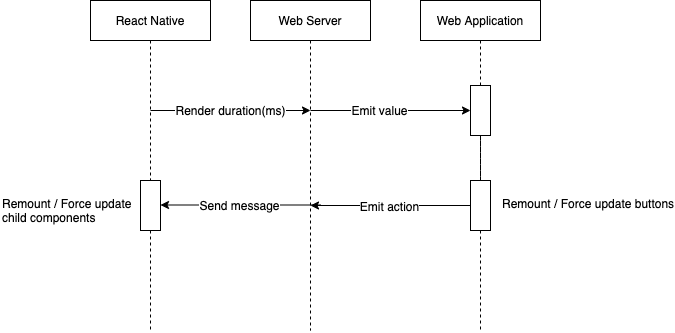
The overall implementation is quite straight forward and simply involved passing the onRenderCallback values via a websocket server to finally render them in a fancy graph.

There are 3 main components:

  • A React Native component that sends profile data to a server via REST and listens to messages (remount and forceUpdate) to trigger renders.
  • A Web socket server responsible for passing messages between the graph and the react native component
  • A Web application that receives websocket values and renders them to a graph

The following diagram is a brief explanation of the data flow:
Note that the project description data, including the texts, logos, images, and/or trademarks, for each open source project belongs to its rightful owner. If you wish to add or remove any projects, please contact us at [email protected].