empathy87 / Storytelling With Data
Plots from the book "Storytelling with data" implementation using Python and matplotlib
Stars: ✭ 100
Programming Languages
python
139335 projects - #7 most used programming language
Projects that are alternatives of or similar to Storytelling With Data
Adjusttext
A small library for automatically adjustment of text position in matplotlib plots to minimize overlaps.
Stars: ✭ 731 (+631%)
Mutual labels: jupyter-notebook, matplotlib
Machine Learning Alpine
Alpine Container for Machine Learning
Stars: ✭ 30 (-70%)
Mutual labels: jupyter-notebook, matplotlib
Crime Analysis
Association Rule Mining from Spatial Data for Crime Analysis
Stars: ✭ 20 (-80%)
Mutual labels: jupyter-notebook, matplotlib
Python Notlarim
Python notes in Turkish.
Stars: ✭ 356 (+256%)
Mutual labels: jupyter-notebook, matplotlib
Ds and ml projects
Data Science & Machine Learning projects and tutorials in python from beginner to advanced level.
Stars: ✭ 56 (-44%)
Mutual labels: jupyter-notebook, matplotlib
Stats Maths With Python
General statistics, mathematical programming, and numerical/scientific computing scripts and notebooks in Python
Stars: ✭ 381 (+281%)
Mutual labels: jupyter-notebook, matplotlib
Geopython
Notebooks and libraries for spatial/geo Python explorations
Stars: ✭ 268 (+168%)
Mutual labels: jupyter-notebook, matplotlib
Pyplotz
A light weight wrapper for matplotlib users with Chinese characters supported
Stars: ✭ 55 (-45%)
Mutual labels: jupyter-notebook, matplotlib
Ncar Python Tutorial
Numerical & Scientific Computing with Python Tutorial
Stars: ✭ 50 (-50%)
Mutual labels: jupyter-notebook, matplotlib
Thesemicolon
This repository contains Ipython notebooks and datasets for the data analytics youtube tutorials on The Semicolon.
Stars: ✭ 345 (+245%)
Mutual labels: jupyter-notebook, matplotlib
Coronavirus visualization and prediction
This repository tracks the spread of the novel coronavirus, also known as SARS-CoV-2. It is a contagious respiratory virus that first started in Wuhan in December 2019. On 2/11/2020, the disease is officially named COVID-19 by the World Health Organization.
Stars: ✭ 62 (-38%)
Mutual labels: jupyter-notebook, matplotlib
Joypy
Joyplots in Python with matplotlib & pandas 📈
Stars: ✭ 322 (+222%)
Mutual labels: jupyter-notebook, matplotlib
Audio Spectrum Analyzer In Python
A series of Jupyter notebooks and python files which stream audio from a microphone using pyaudio, then processes it.
Stars: ✭ 273 (+173%)
Mutual labels: jupyter-notebook, matplotlib
Pythondatasciencehandbook
The book was written and tested with Python 3.5, though other Python versions (including Python 2.7) should work in nearly all cases.
Stars: ✭ 31,995 (+31895%)
Mutual labels: jupyter-notebook, matplotlib
Contextily
Context geo-tiles in Python
Stars: ✭ 254 (+154%)
Mutual labels: jupyter-notebook, matplotlib
Matplotlib Venn
Area-weighted venn-diagrams for Python/matplotlib
Stars: ✭ 260 (+160%)
Mutual labels: jupyter-notebook, matplotlib
Machine Learning
notebooks with example for machine learning examples
Stars: ✭ 45 (-55%)
Mutual labels: jupyter-notebook, matplotlib
Matplotlib Multilayer Network
small template code to create a multilayer network using matplotlib and networkx
Stars: ✭ 60 (-40%)
Mutual labels: jupyter-notebook, matplotlib
storytelling-with-data (Python + matplotlib)
http://www.storytellingwithdata.com/book/
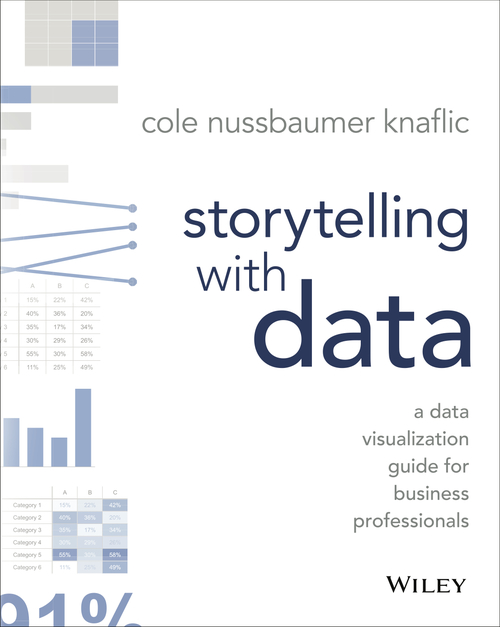
The book storytelling with data teaches you the fundamentals of data visualization and how to communicate effectively with data. You'll discover the power of storytelling and the way to make data a pivotal point in your story. The lessons in this illuminative text are grounded in theory, but made accessible through numerous real-world examples—ready for immediate application to your next graph or presentation.
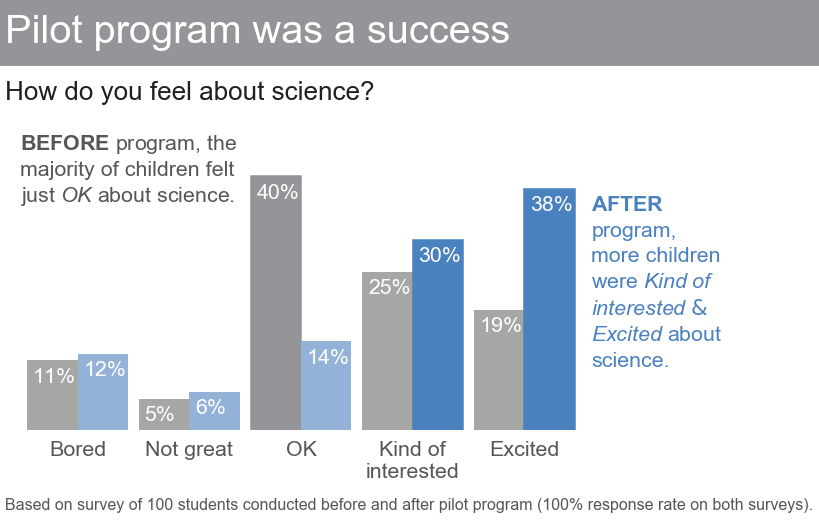
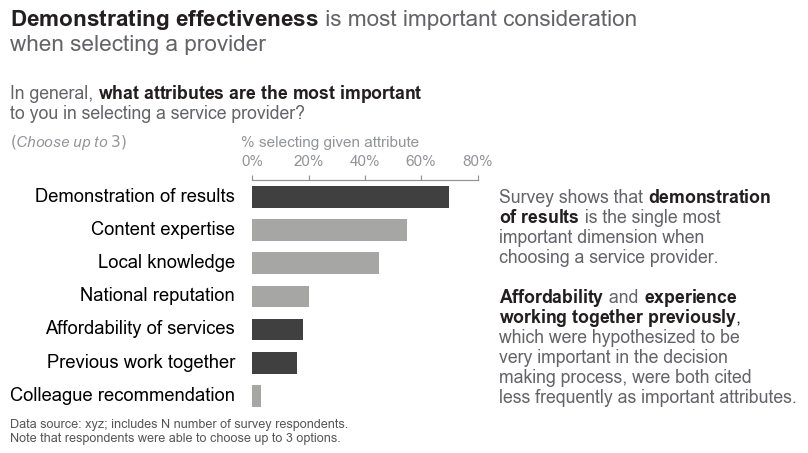
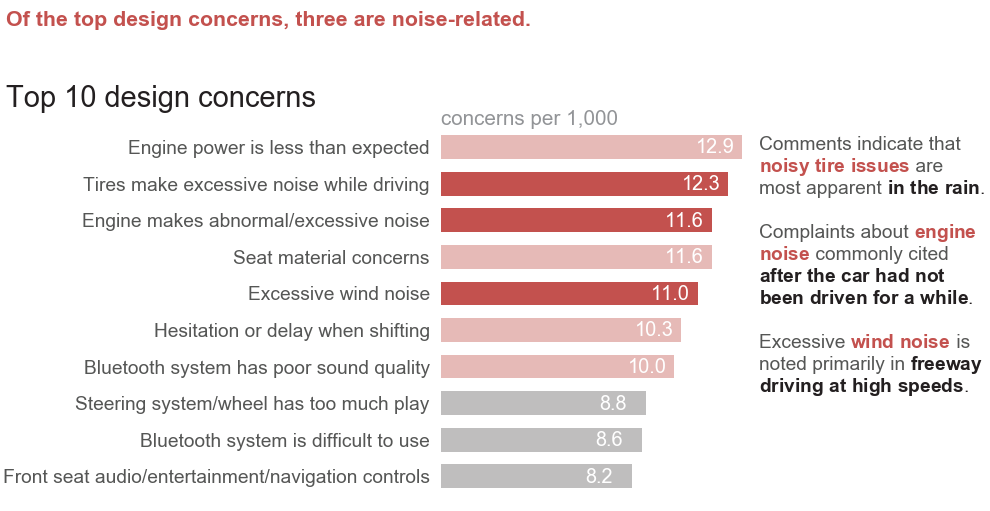
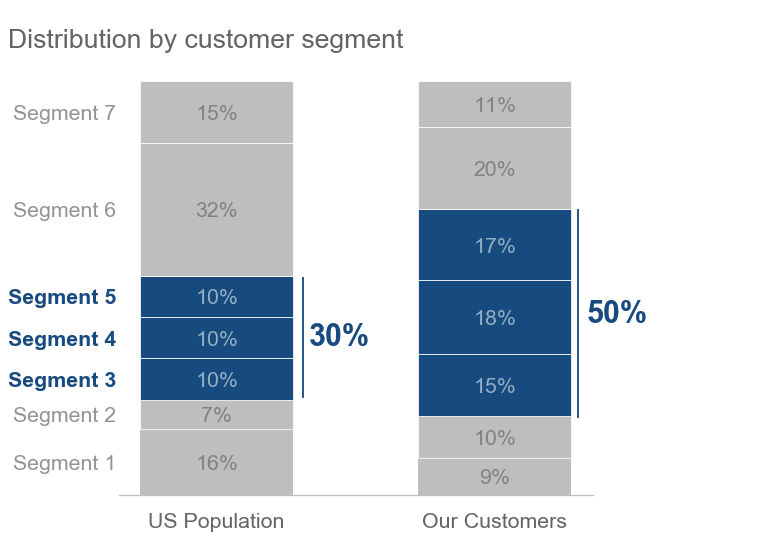
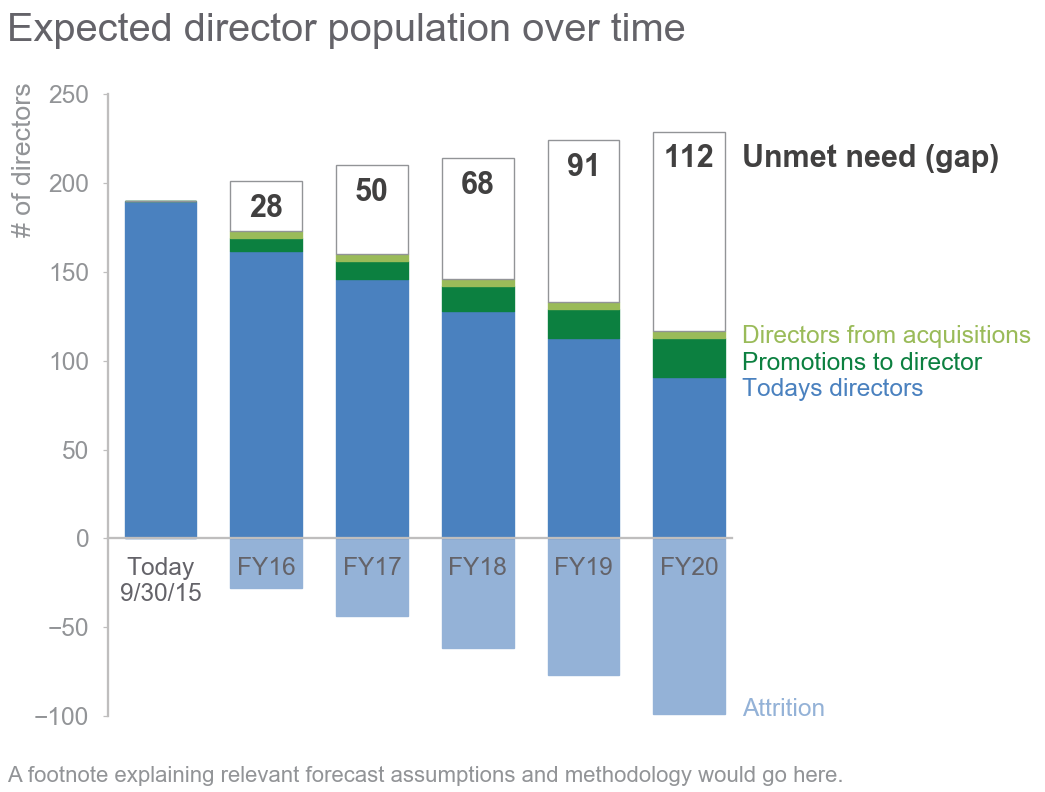
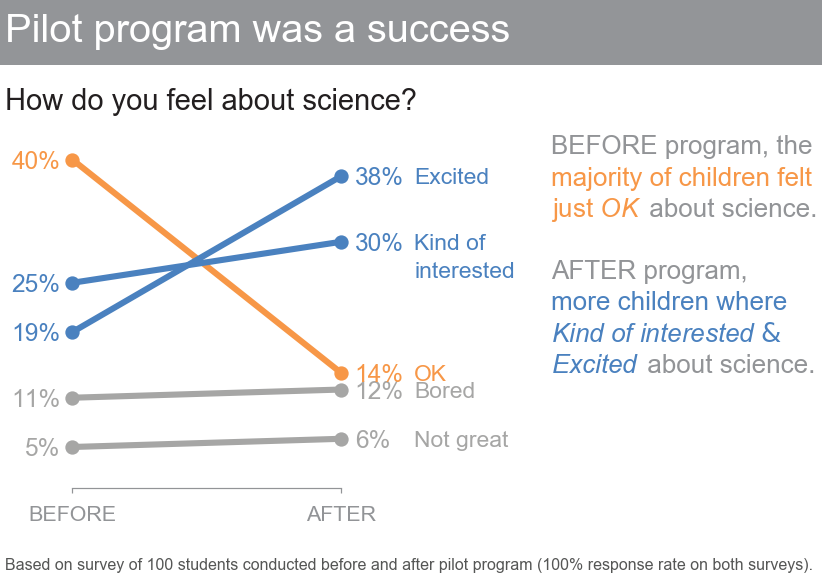
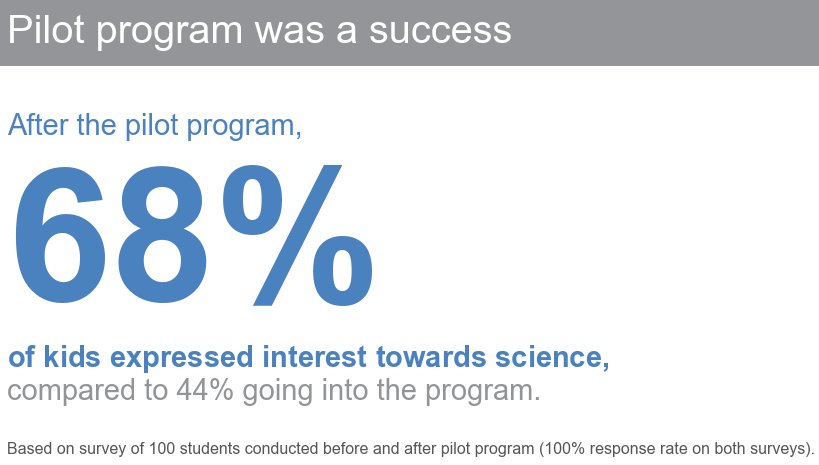
Here I have implemented few graphs from the book using Python and matplotlib library. Kindly find well documented Jupyter Notebooks for plots.
Vertical & Horizontal Bars
| Figure 0.5 | Figure 3.34 |
|---|---|
 |
 |
| Figure 4.9 | Figure 5.13 |
 |
 |
| Figure 6.4 | |
 |
Slopegraphs
| Figure 9.32 |
|---|
 |
Simple Texts
| Figure 9.29 |
|---|
 |
Scatterplots
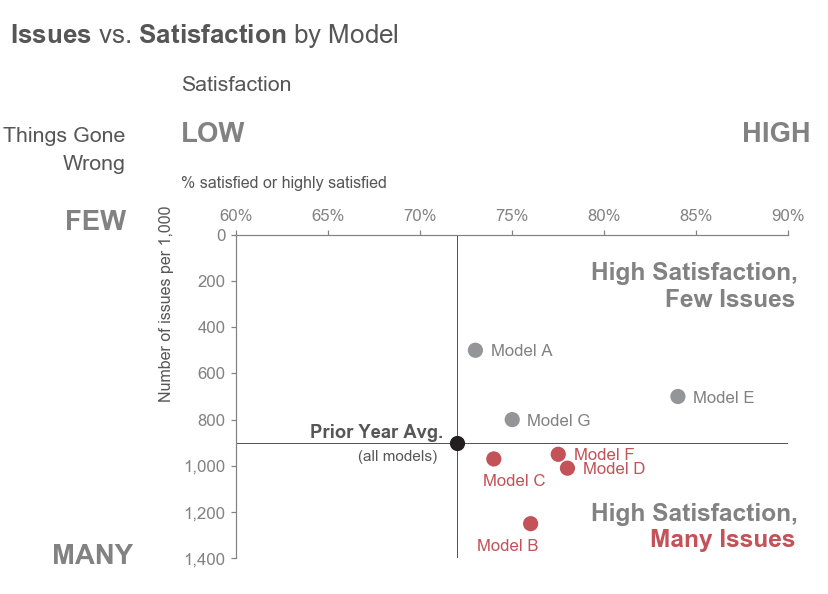
| Figure 5.6 |
|---|
 |
Lines
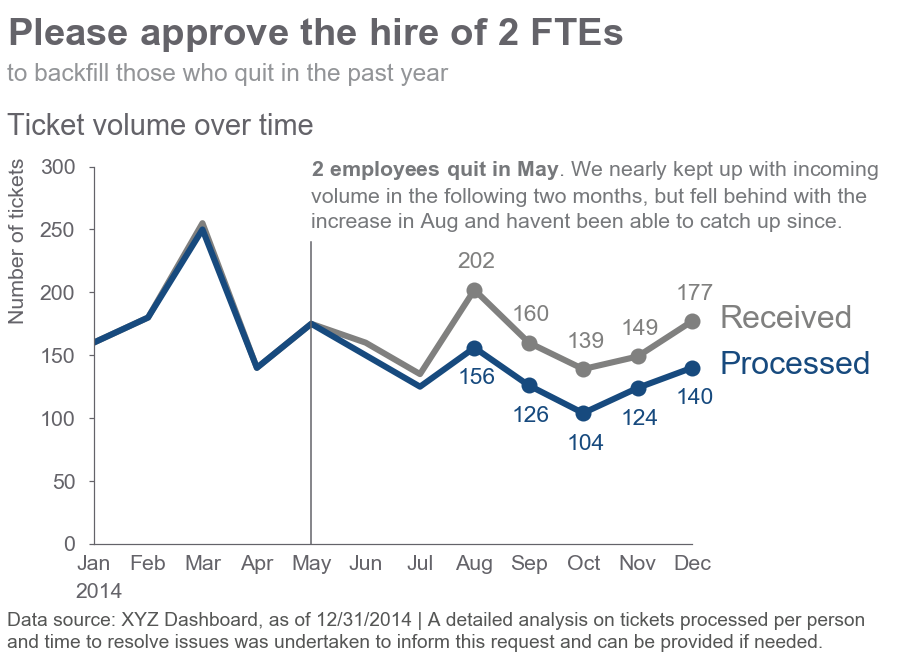
| Figure 5.10 |
|---|
 |
Colors
Gray
Blue
| #174A7E BLUE1. Chathams Blue | #4A81BF BLUE2. Steel Blue | #94B2D7 BLUE3. Polo Blue | #94AFC5 BLUE4. Nepal | |||||
|---|---|---|---|---|---|---|---|---|
 |
 |
 |
 |
 |
 |
 |
 |
 |
RED
| #C3514E RED1. Fuzzy Wuzzy Brown | #E6BAB7 RED2. Rose Fog | |||||||
|---|---|---|---|---|---|---|---|---|
 |
 |
 |
 |
 |
 |
 |
 |
 |
GREEN
| #0C8040 GREEN1. Salem | #9ABB59 GREEN2. Celery | |||||||
|---|---|---|---|---|---|---|---|---|
 |
 |
 |
 |
 |
 |
 |
 |
 |
ORANGE
| #F79747 ORANGE1. Tan Hide | ||||||||
|---|---|---|---|---|---|---|---|---|
 |
 |
 |
 |
 |
 |
 |
 |
 |
Note that the project description data, including the texts, logos, images, and/or trademarks,
for each open source project belongs to its rightful owner.
If you wish to add or remove any projects, please contact us at [email protected].


