daveleroy / Sublime_debugger
Programming Languages
Labels
Projects that are alternatives of or similar to Sublime debugger
Sublime Debugger
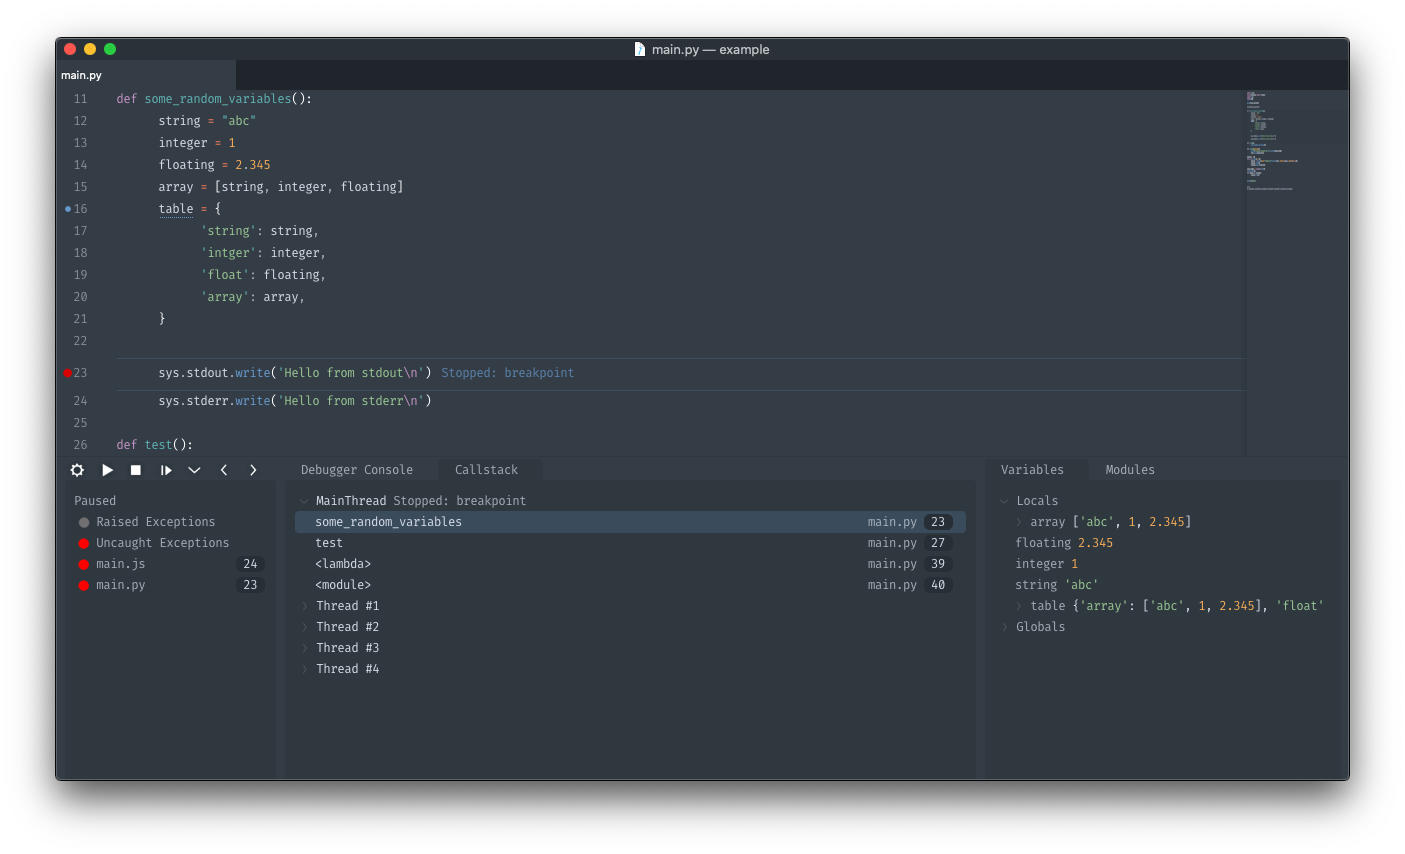
Graphical Debugger for sublime text for debuggers that support the debug adapter protocol.
Installing
Using package control run Package Control: Install Package and select Debugger.
or clone into your sublime Packages directory (If you are on Sublime Text 3 use the st3 branch)
Getting Started
This project attempts to match Visual Studio Code's Debugger fairly closely so their documentation can be pretty helpful. See https://code.visualstudio.com/docs/editor/debugging
Debuggers
This project comes with some pre-configured debuggers (They can be installed using Debugger: Install adapter)
LLDB
Chrome
Firefox
Node
- For an overview see https://code.visualstudio.com/docs/nodejs/nodejs-debugging
- See https://github.com/microsoft/vscode-node-debug2
Python
- For an overview see https://code.visualstudio.com/docs/python/debugging
- See https://github.com/Microsoft/vscode-python
Go
- For an overview see https://github.com/golang/vscode-go/blob/master/docs/debugging.md
- See https://github.com/golang/vscode-go
PHP
Setup
-
Open the debug panel
- from the command palette
Debugger: Open
- from the command palette
-
Install a debug adapter by running:
Debugger: Install adapterfrom the command palette. -
Add a configuration
Debugger: Add Configurationfrom the command palette (or add one manually, see below).- Configurations are added to
debugger_configurationsto your sublime-projec and use the same configuration format as Visual Studio Code - Consult the debugger specific documentation links above for creating a configuration for your debugger. Most debuggers come with some configuration snippets to choose from but I highly recommend looking at the documentation for the debugger.
- Configurations are added to
-
Your configuration will look something like the following but with some debugger specific fields.
"debugger_configurations" : [
    {
        "name" : "Name of your configuration",
        "request" : "launch"|"attach",
        "type" : "debugger name",
         ...
    }
]
- Start debugging
- click the gear icon to select a configuration to use
- click the play icon to start the debugger or run
Debugger: Start(if no configuration is selected it will ask you to select or create one)
Tasks
Tasks are based on sublime build_systems with more integration so they can be used more seamlessly while debugging. When errors occur while running a task they are reported in the debugger ui (problem detection is the same as sublime, you must add file_regex to your task)
see https://www.sublimetext.com/docs/3/build_systems.html
Tasks are basically the same as sublime builds but there are a few additional paramters.
name which will show up in the debugger ui and the be the name of the panel
"debugger_tasks" : [
    {
        "name" : "Name of your configuration",
        "request" : "launch"|"attach",
        "type" : "debugger name",
         ...
    }
]
- Tasks can be run with
Debugger: Run Tasks - You can run tasks before and after debugging by adding
pre_debug_taskorpost_debug_taskto your configuration specifiying the name of the task to run.
Settings
Settings can either be set at the project level or globally.
Project settings can be changed by appending debug. to the setting name.
Within a .sublime_settings file
-
open_at_startuptrueOpen the debugger automatically when a project that is set up for debugging has been opened -
ui_scale12scales the entire debugger UI
Within a .sublime_project file settings object
debug.open_at_startupdebug.ui_scale
for a full list of settings see debugger.sublime-settings
Troubleshooting
- Look in the debug console for errors (usually red)
- Look in the sublime console for errors
- Try the same configuration/adapter in Visual Studio Code (There is a good chance your issue is with the adapter so check out the outstanding issues for it)

