lgervasoni / Urbansprawl
Programming Languages
Projects that are alternatives of or similar to Urbansprawl
Urbansprawl
The urbansprawl project provides an open source framework for assessing urban sprawl using open data. It uses OpenStreetMap (OSM) data to calculate its sprawling indices, divided in Accessibility, Land use mix, and Dispersion.
Locations of residential and activity (e.g. shop, commerce, office, among others) units are used to measure mixed use development and built-up dispersion, whereas the street network is used to measure the accessibility between different land uses. The output consists of spatial indices, which can be easily integrated with GIS platforms.
Additionally, a method to perform dissagregated population estimates at building level is provided. Our goal is to estimate the number of people living at the fine level of individual households by using open urban data (OpenStreetMap) and coarse-scaled population data (census tract).
Motivation:
Urban sprawl has been related to numerous negative environmental and socioeconomic impacts. Meanwhile, the number of people living in cities has been increasing considerably since 1950, from 746 million to 3.9 billion in 2014. More than 66% of the world's population are projected to live in urban areas by 2050, against 30% in 1950 (United Nations, 2014). The fact that urban areas have been growing at increasing rates urges for assessing urban sprawl towards sustainable development. However, sprawl is an elusive term and different approaches to measure it have lead to heterogeneous results.
Moreover, most studies rely on private/commercial data-sets and their software is rarely made public, impeding research reproducibility and comparability. Furthermore, many works give as result a unique value for a region of analysis, dismissing spatial information which is vital for urban planners and policy makers.
This situation brings new challenges on how to conceive cities that host such amounts of population in a sustainable way. Thus, this sustainability question should address several aspects, ranging from economical to social and environmental matters among others. Urbansprawl provides an open framework to aid in the process of calculating sprawling indices.
Framework characteristics:
- Open data: we rely solely on open data in order to ensure replicability.
- Open source: users are free to use the framework for any purpose.
- World-wide coverage: the analysis can be applied to any city in the world, as long as sufficient data exists.
- Data homogeneity: a set of statistical tools are applied to homogeneous and well-defined map features data.
- Geo-localized data: precise location of features allow to cope with the Modifiable Areal Unit Problem (avoid using gridded data, e.g. Land Use Land Cover data).
- Crowd-sourced data: rapid updates given an ever-increasing community.
- GIS output: easy to integrate with other GIS frameworks.
- Potential missing data: still few data exist for some regions in the world.
Disclaimer: This package is no longer maintained.
For more details, refer to:
- Gervasoni Luciano, 2018. "Contributions to the formalization and implementation of spatial urban indices using open data : application to urban sprawl studies." Computers and Society [cs.CY]. Université Grenoble Alpes, 2018.
- Gervasoni Luciano, Bosch Martí, Fenet Serge, and Sturm Peter. 2016. "A framework for evaluating urban land use mix from crowd-sourcing data." 2nd International Workshop on Big Data for Sustainable Development (IEEE Big Data 2016).
- Gervasoni Luciano, Bosch Martí, Fenet Serge, and Sturm Peter. 2017. "LUM_OSM: une plateforme pour l'évaluation de la mixité urbaine à partir de données participatives." GAST Workshop, Conférence Extraction et Gestion de Connaissances (EGC 2017).
- Gervasoni Luciano, Bosch Martí, Fenet Serge, and Sturm Peter. 2017. "Calculating spatial urban sprawl indices using open data." 15th International Conference on Computers in Urban Planning and Urban Management (CUPUM 2017).
- Gervasoni Luciano, Fenet Serge, and Sturm Peter. 2018. "Une méthode pour l’estimation désagrégée de données de population à l’aide de données ouvertes." Conférence Internationale sur l'Extraction et la Gestion des Connaissances (EGC 2018).
- Gervasoni Luciano, Fenet Serge, Perrier Régis and Sturm Peter. 2018. "Convolutional neural networks for disaggregated population mapping using open data." IEEE International Conference on Data Science and Advanced Analytics (DSAA 2018).
Installation
The urbansprawl framework works with Python 2+3.
- Python dependencies:
osmnx scikit-learn psutil tensorflow keras jupyter
Using pip
- Install the
spatialindexlibrary. Using apt-get (Linux):
sudo apt-get install libspatialindex-dev
- Install the dependencies using pip
pip install osmnx scikit-learn psutil tensorflow keras jupyter
Using Miniconda
- Install Miniconda
- [Optional] Create a conda virtual environment
conda create --name urbansprawl-env
source activate urbansprawl-env
- Install the dependencies using the conda package manager and the conda-forge channel
conda install -c conda-forge libspatialindex osmnx scikit-learn psutil tensorflow keras jupyter
Using Anaconda
- Install Anaconda
- [Optional] Create a conda virtual environment
conda create --name urbansprawl-env
source activate urbansprawl-env
- Install the dependencies using the conda package manager and the conda-forge channel
conda update -c conda-forge --all
conda install -c conda-forge osmnx scikit-learn psutil tensorflow keras jupyter
Usage
The framework is presented through different examples in the form of notebooks. As well, the computational running times involved in each procedure are shown for each example. To this end, a r5.large AWS EC2 instance was employed (2 vCPU and 16GiB memory) to run the notebooks.
Please note that the different procedures can be both memory and time consuming, according to the size of the chosen region of interest. In order to run the different notebooks, type in a terminal:
jupyter notebook
Example: Urban sprawl
OpenStreetMap data is retrieved using the Overpass API. An input region of interest can be extracted by:
- Place + result number: The name of the city/region, and the resulting number to retrieve (as seen in OpenStreetMap result order)
- Polygon: A polygon with the coordinates delimitating the desired region of interest
- Bounding box: Using northing, southing, easting, and westing coordinates
- Point + distance (meters): Use the (latitude, longitude) central point plus an input distance around it
- Address + distance (meters): Set the address as central point and an input distance around it
Additionally, the state of the data-base can be retrieved for a specific data. This allows for comparisons across time and keeping track of a city's evolution.
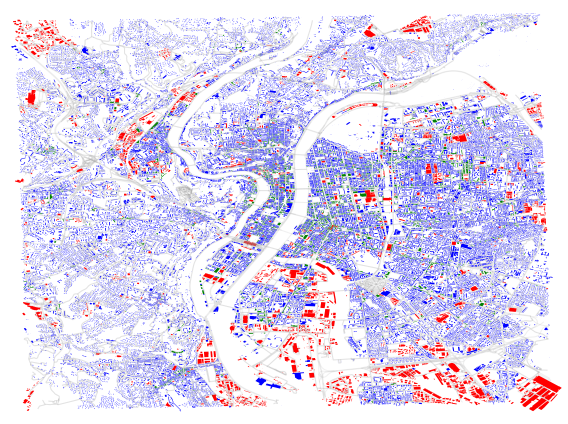
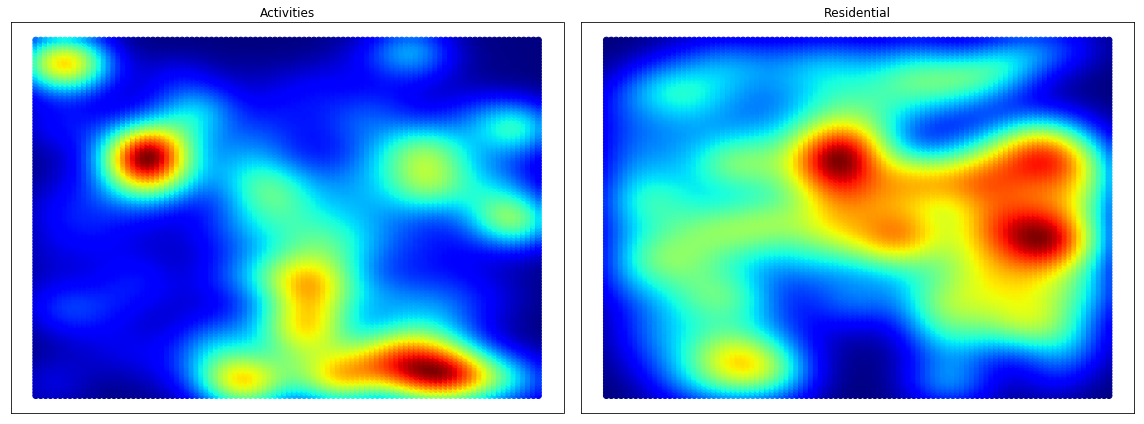
Results are depicted for the city of Lyon, France:
- Locations of residential and activity land uses are retrieved
- Buildings with defined land use:
- Blue: Residential use
- Red: Activity use
- Green: Mixed use
- Points of interest (POIs) with defined land use:

-
Densities for each land use are estimated:
- Probability density function estimated using Kernel Density Estimation (KDE)
- Activity uses can be further classified using the OSM wiki:
- Leisure and amenity
- Shop
- Commercial and industrial

- Street network:

Sprawling indices:
- Land use mix indices: Degree of co-occurence of differing land uses within 'walkable' distances.

-
Accessibility indices: Denotes the degree of accessibility to differing land uses (from residential to activity uses).
-
Fixed activities: Represents the distance needed to travel in order to reach a certain number of activity land uses
-
Fixed distance: Denotes the cumulative number of activity opportunities found within a certain travel distance
-

-
Dispersion indices: Denotes the degree of scatteredness of the built-up area.
- "A landscape suffers from urban sprawl if it is permeated by urban development or solitary buildings [...]. The more area built over and the more dispersed the built-up area, [...] the higher the degree of urban sprawl" (Jaeger and Schwick 2014)

Example: Population densities
Gridded population data is used in the context of population densities downscaling:
-
A fine scale description of residential land use (surface) per building is built exploiting OpenStreetMap.
-
Using coarse-scale gridded population data, we perform the down-scaling for each household given their containing area for residential usage
-
The evaluation is carried out using fine-grained census block data (INSEE) for cities in France as ground-truth.
Population count images are depicted for the city of Grenoble, France:
- Population densities (INSEE census data):

- Population densities (INSEE census data, Gridded Population World resolution):
