All Projects → vaadin → Vaadin Charts

vaadin / Vaadin Charts

Licence: other
Vaadin Charts is a feature-rich interactive graph library that answers the data visualization needs of modern web applications

Programming Languages

javascript
184084 projects - #8 most used programming language

Projects that are alternatives of or similar to Vaadin Charts

Paper Timezone
Polymer based timezone selection component
Stars: ✭ 19 (-59.57%)
Mutual labels:  web-components, polymer, web-component
paper-countries
Select Dropdown with list of countries with flags and autocomplete
Stars: ✭ 16 (-65.96%)
Mutual labels:  web-component, polymer, web-components
Polymer
Our original Web Component library.
Stars: ✭ 21,723 (+46119.15%)
Mutual labels:  web-components, polymer
Chartkick.py
Create beautiful Javascript charts with minimal code
Stars: ✭ 695 (+1378.72%)
Mutual labels:  chart, charting-library
Gdg.es
The GDG Spain official website
Stars: ✭ 16 (-65.96%)
Mutual labels:  web-components, polymer
Chartjs Chart Financial
Chart.js module for charting financial securities
Stars: ✭ 469 (+897.87%)
Mutual labels:  chart, charting-library
Polymer Cli
Moved to Polymer/tools monorepo
Stars: ✭ 518 (+1002.13%)
Mutual labels:  web-components, polymer
Web Component Tester
Moved to Polymer/tools monorepo
Stars: ✭ 571 (+1114.89%)
Mutual labels:  web-components, polymer
Timesheet.js
JavaScript library for HTML5 & CSS3 time sheets
Stars: ✭ 6,881 (+14540.43%)
Mutual labels:  chart, charting-library
Vaadin Form Layout
The Web Component providing configurable responsive layout for form elements. Part of the Vaadin components.
Stars: ✭ 15 (-68.09%)
Mutual labels:  polymer, web-component
Teechart Firemonkey Samples
Sample programs showing how to use TeeChart for FireMonkey
Stars: ✭ 21 (-55.32%)
Mutual labels:  chart, charting-library
Polymer Redux
Polymer bindings for Redux.
Stars: ✭ 450 (+857.45%)
Mutual labels:  polymer, web-component
Aachartkit
📈📊🚀🚀🚀An elegant modern declarative data visualization chart framework for iOS, iPadOS and macOS. Extremely powerful, supports line, spline, area, areaspline, column, bar, pie, scatter, angular gauges, arearange, areasplinerange, columnrange, bubble, box plot, error bars, funnel, waterfall and polar chart types. 极其精美而又强大的跨平台数据可视化图表框架,支持柱状图、条形图、折…
Stars: ✭ 4,358 (+9172.34%)
Mutual labels:  chart, charting-library
Chart
Quick & smart charting for STDIN
Stars: ✭ 521 (+1008.51%)
Mutual labels:  chart, charting-library
Vaadin
An evolving set of open source web components for building mobile and desktop web applications in modern browsers.
Stars: ✭ 424 (+802.13%)
Mutual labels:  web-components, polymer
Flutter echarts
A Flutter widget to use Apache ECharts (incubating) in a reactive way.
Stars: ✭ 420 (+793.62%)
Mutual labels:  chart, charting-library
Contactlab Ui Components
DEPRECATED - Basic UI components for ContactLab UX design pattern library
Stars: ✭ 31 (-34.04%)
Mutual labels:  web-components, polymer
Vaadin Core
An evolving set of free, open source web components for building mobile and desktop web applications in modern browsers.
Stars: ✭ 382 (+712.77%)
Mutual labels:  web-components, polymer
React Chartjs 2
React components for Chart.js, the most popular charting library
Stars: ✭ 4,667 (+9829.79%)
Mutual labels:  chart, charting-library
Amcharts4
The most advanced amCharts charting library for JavaScript and TypeScript apps.
Stars: ✭ 907 (+1829.79%)
Mutual labels:  chart, charting-library

Vaadin Charts

Live Demo ↗ | API documentation ↗

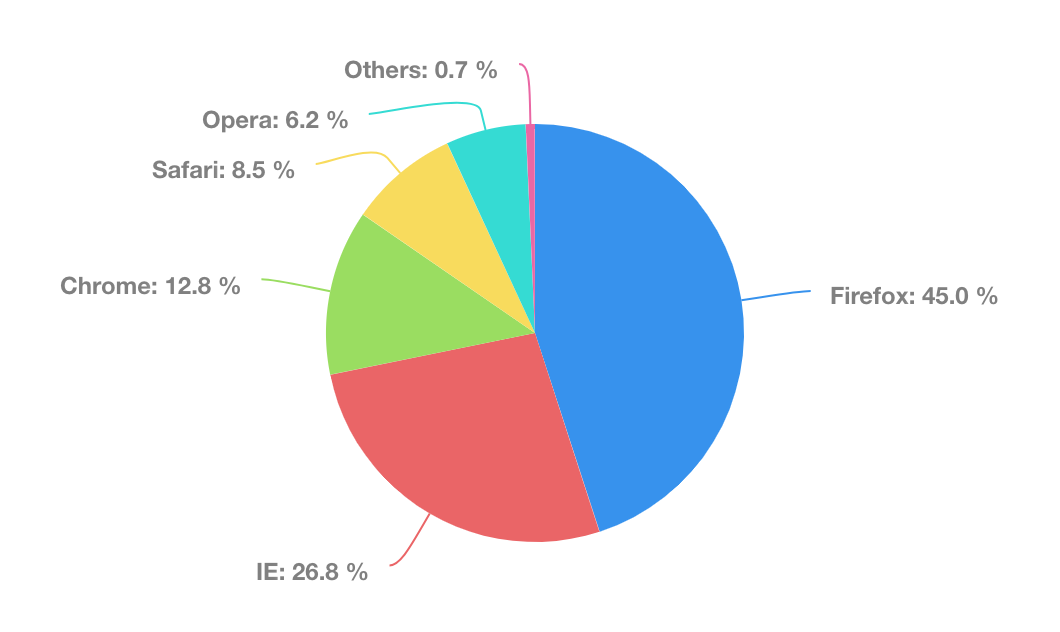
Vaadin Charts is a Web Component for creating high quality charts, part of the Vaadin components.

npm version Build Status Published on webcomponents.org Published on Vaadin Directory Stars on vaadin.com/directory Discord

<vaadin-chart type="pie">
  <vaadin-chart-series values='[
      ["Firefox", 45.0],
      ["IE", 26.8],
      ["Chrome", 12.8],
      ["Safari", 8.5],
      ["Opera", 6.2],
      ["Others", 0.7]]'>
  </vaadin-chart-series>
</vaadin-chart>

Screenshot of vaadin-chart

Relevant links

Installation

Install vaadin-charts:

npm i @vaadin/vaadin-charts --save

Once installed, import it in your application:

import '@vaadin/vaadin-charts/vaadin-chart.js';

Install License Key

After one day using Vaadin Charts in a development environment you will see a pop-up that asks you to enter the license key. You can get your trial key from https://vaadin.com/pro/licenses. If the license is valid, it will be saved to the local storage of the browser and you will not see the pop-up again.

Running API docs and tests in a browser

  1. Fork the vaadin-charts repository and clone it locally.

  2. Make sure you have node.js 12.x installed.

  3. Make sure you have npm installed.

  4. When in the vaadin-charts directory, run npm install to install dependencies.

  5. Run npm start, browser will automatically open the component API documentation.

  6. You can also open visual tests, for example:

Running tests from the command line

  1. When in the vaadin-charts directory, run npm test

Debugging tests in the browser

  1. Run npm run debug, then choose manual mode (M) and open the link in browser.

Following the coding style

We are using ESLint for linting JavaScript code. You can check if your code is following our standards by running npm run lint, which will automatically lint all .js files.

Contributing

To contribute to the component, please read the guideline first.

License

Vaadin Charts is distributed under the terms of Commercial Vaadin Developer License 4.0 ("CVDLv4"). A copy of the license is included as LICENSE.txt in this software package.

Vaadin collects development time usage statistics to improve this product. For details and to opt-out, see https://github.com/vaadin/vaadin-usage-statistics.

Note that the project description data, including the texts, logos, images, and/or trademarks, for each open source project belongs to its rightful owner. If you wish to add or remove any projects, please contact us at [email protected].