Azure-Samples / Academic Knowledge Analytics Visualization
title: Analytics and Visualization Samples for Academic Graph services: academic-knowledge platforms: dotnet author: alch-msft ms.topic: tutorial ms.service: data-lake-analytics description: This project illustrates how to perform analystics and visualization for Microsoft Academic Graph using Data Lake Analytics (USQL) and Power BI.
Analytics & Visualization Samples for Academic Graph
This project aims to help data scientists become familar with the Microsoft Academic Graph through analystics and visualization samples using Data Lake Analytics (USQL) and Power BI.
Samples
The project contains 13 samples
- Field of Study Top Authors
- Field of Study Entity Counts
- Field of Study Top Entities
- Conference Top Authors By Static Rank
- Conference Paper Statistics
- Conference Top Papers
- Conference Top Authors
- Conference Top Institutions
- Conference Memory of References
- Conference Top Referenced Venues
- Conference Top Citing Venues
- Conference Tredning Topics
- Organization Insight
Getting Started
Pre-requisites
- Get Microsoft Academic Graph on Azure Storage
- Set up Azure Data Lake Analytics for Microsoft Academic Graph
- Microsoft Power BI Desktop client
- Visual Studio 2017 or Visual Studio 2015 with Data Lake tools
Gather the information that you need
Before you begin, you should have these items of information:
✔️ The name of your Azure Storage (AS) account containing MAG dataset from Get Microsoft Academic Graph on Azure storage.
✔️ The name of your Azure Data Lake Analytics (ADLA) service from Set up Azure Data Lake Analytics.
✔️ The name of your Azure Data Lake Storage (ADLS) from Set up Azure Data Lake Analytics.
✔️ The name of the container in your Azure Storage (AS) account containing MAG dataset.
Define functions to extract MAG data
In prerequisite Set up Azure Data Lake Analytics, you added the Azure Storage (AS) created for MAG provision as a data source for the Azure Data Lake Analytics service (ADLA). In this section, you submit an ADLA job to create functions extracting MAG data from Azure Storage (AS).
Follow instructions in Define MAG functions.
Running Example Analytics
- Download or clone the repository.
- Open the solution /src/AcademicAnalytics.sln
- For each tutorial there should be: A USQL script(.usql), a Power BI report(.pbix), a Power BI template(.pbit) and a README explaining the tutorial.
- Althought each tutorial is different, running the USQL script as is and filling out the Power BI template using the same USQL parameters should give you a Power BI report with visualizations that match the Power BI report example included in the tutorial. Since the Microsoft Academic graph is contently improving, different graph verions may give you slightly different results.
Working with USQL scripts
-
How to run
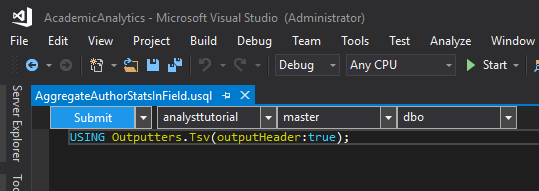
- Make sure you have selected your ADLA account
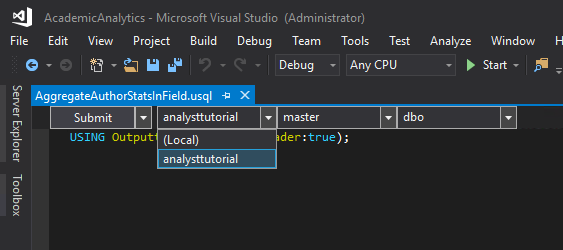
- Build the script first to validate syntax
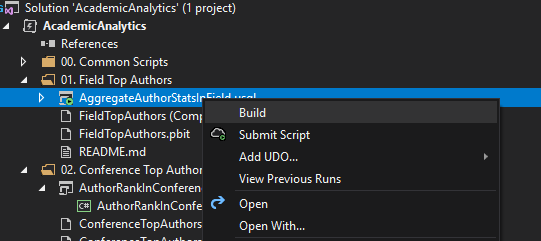
- Submit your script to your ADLA account
-
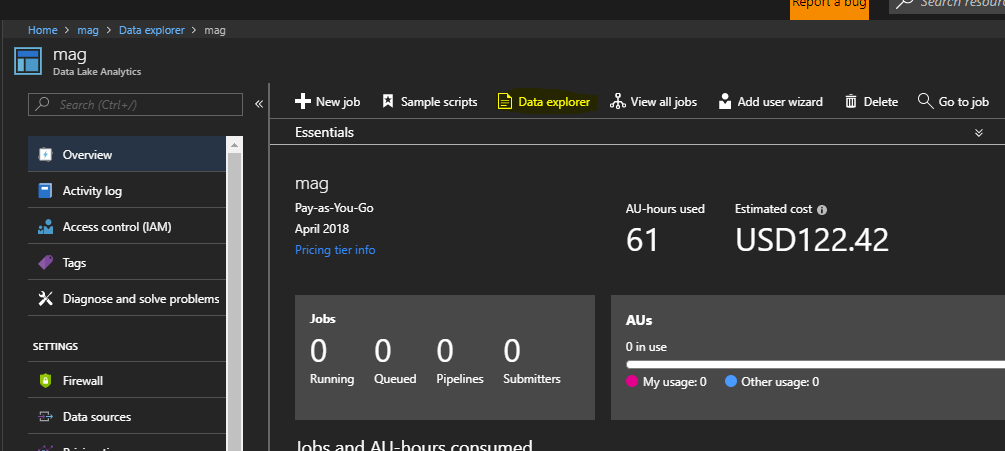
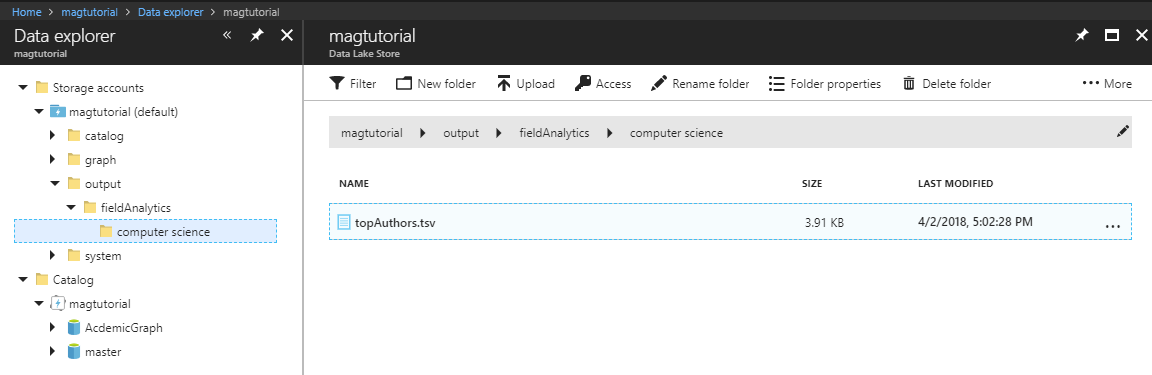
How to view the results
- You can view the results via azure portal


Using Power BI
- Make sure USQL script finished sucessfully
- Open up corresponding Power BI Template(.pbit) from file explorer (Visual studio doesn't recognize Power BI files)
- Enter your ADL information and parameters corrisponding to your scripts
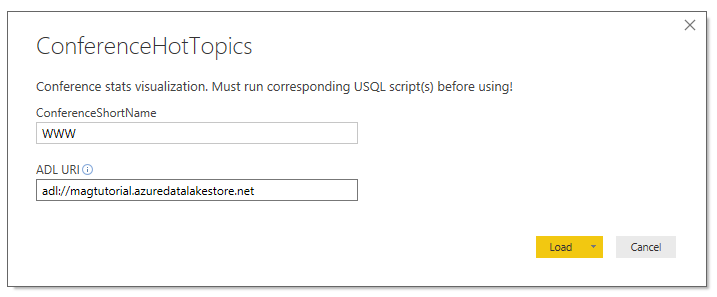
- Make sure the parameters cases are the same as your script and "click" to load

Resources
- Get started with Azure Data Lake Analytics using Azure portal
- Develop USQL scripts by using Data Lake Tools for Visual Studio
- Get started with USQL
- Deep Dive into Query Parameters and Power BI Templates
- Manage Azure Data Lake Store resources by using Storage Explorer
- Scalable Data Science with Azure Data Lake: An end-to-end Walkthrough
- Microsoft Academic Website