Advanced KPI 
This project is about creating a smart KPI object for Qlik Sense that fits to 90% of the needs of the users. From an information design perspective, the KPI object is one of the most important objects when we want to display information. For most of the users it is an indicator providing a variety of information on the first view within a couple of seconds.
Important !
Please keep in mind, the files you find within the GitHub Repository are the "uncompiled" project files. These files can be downloaded to create your own version of "advanced-kpi". A description can be found here (Developing the extension). Under the "Releases" tab you can find the compiled version. This zip package can be imported into Qlik Sense.
Installation
You can download the extension here. Upload to Qlik Sense server or extract to appropriate Qlik Sense Desktop folder.
-
Qlik Sense Desktop: unzip to a directory under [My Documents]/Qlik/Sense/Extensions.
-
Qlik Sense Server: import the zip file in the QMC.
Demo
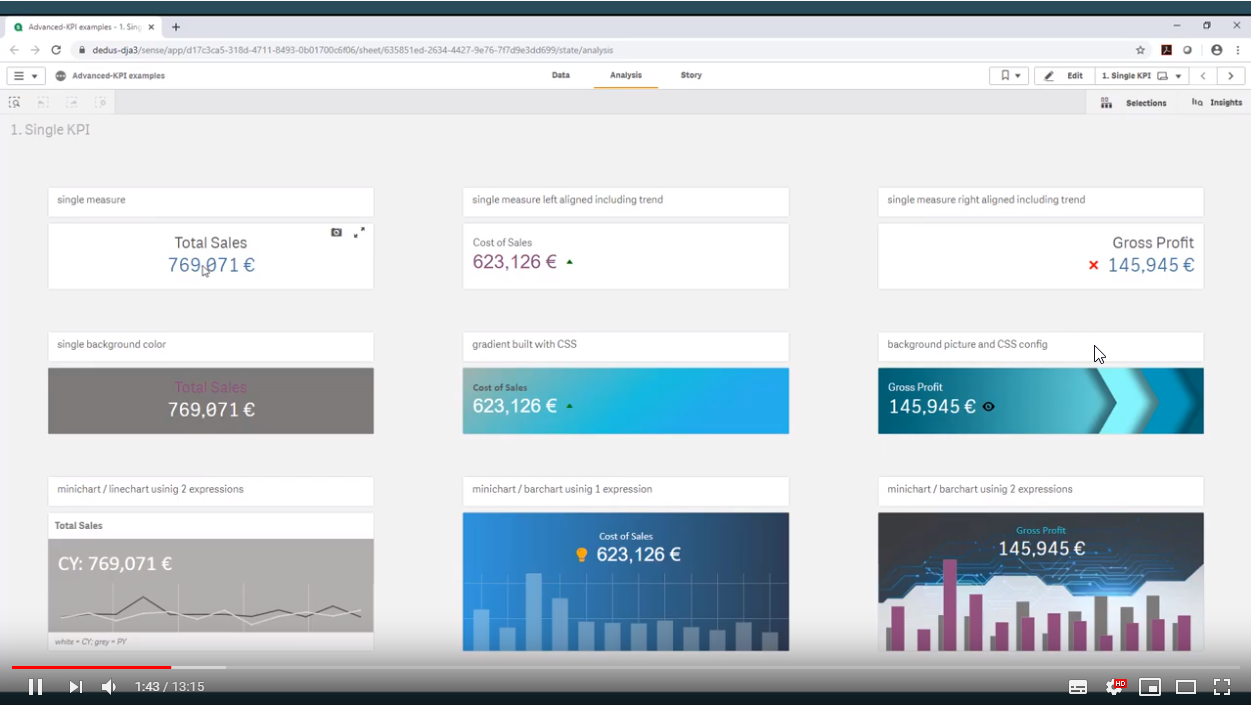
You can donwload a Qlik Sense Demo app to see a couple of possible charts.
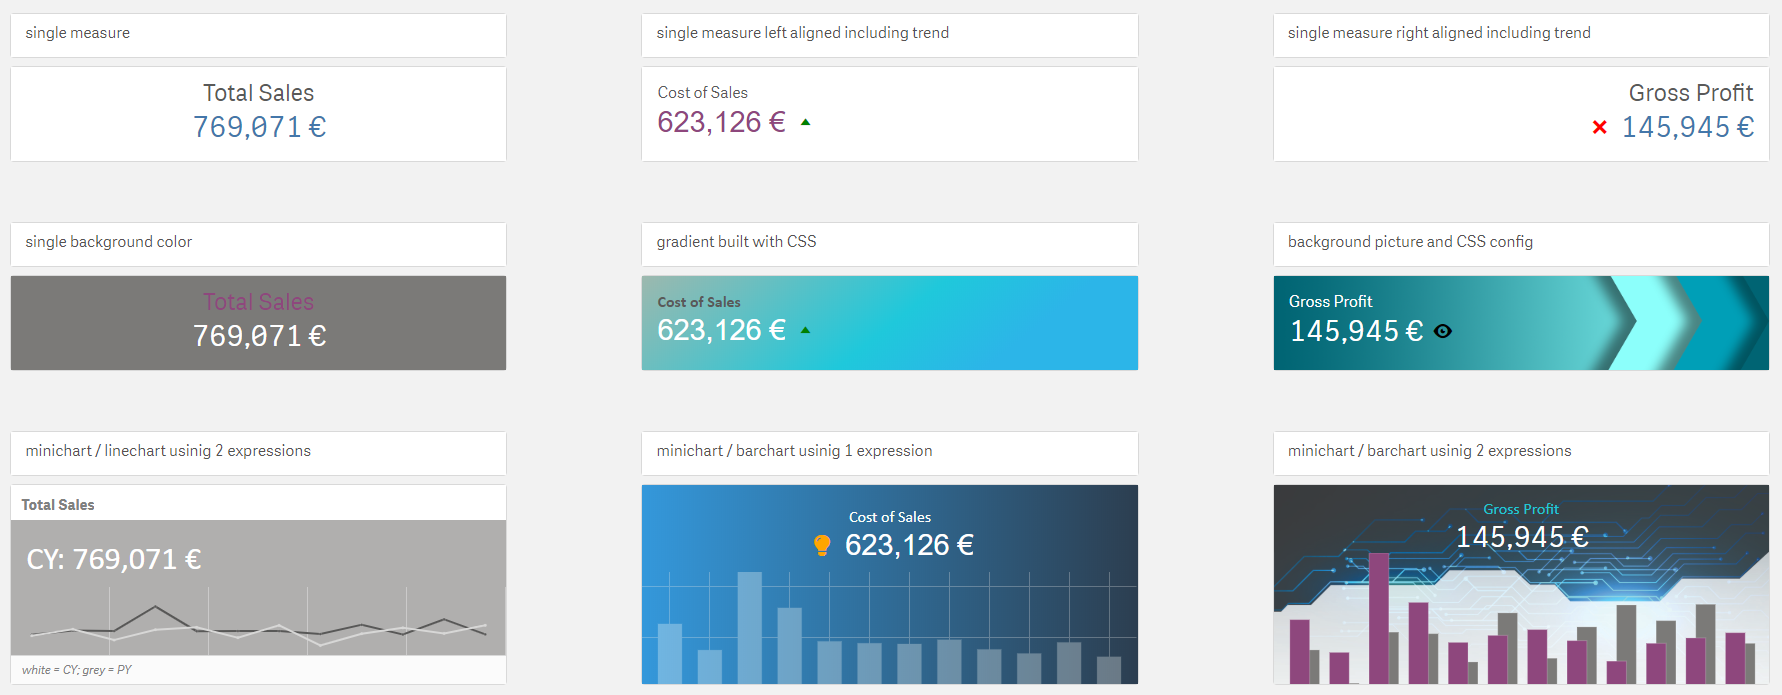
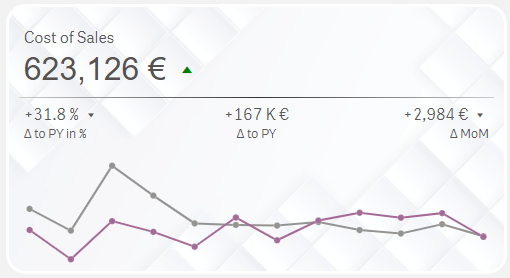
This example shows how results could look like with one single measure by using the possible configuration options.
It's possible to add more KPIs. They are called "explaining KPIs". You will find them in the accordion under "Measures".
Table of contents
Concept
Top Level KPI
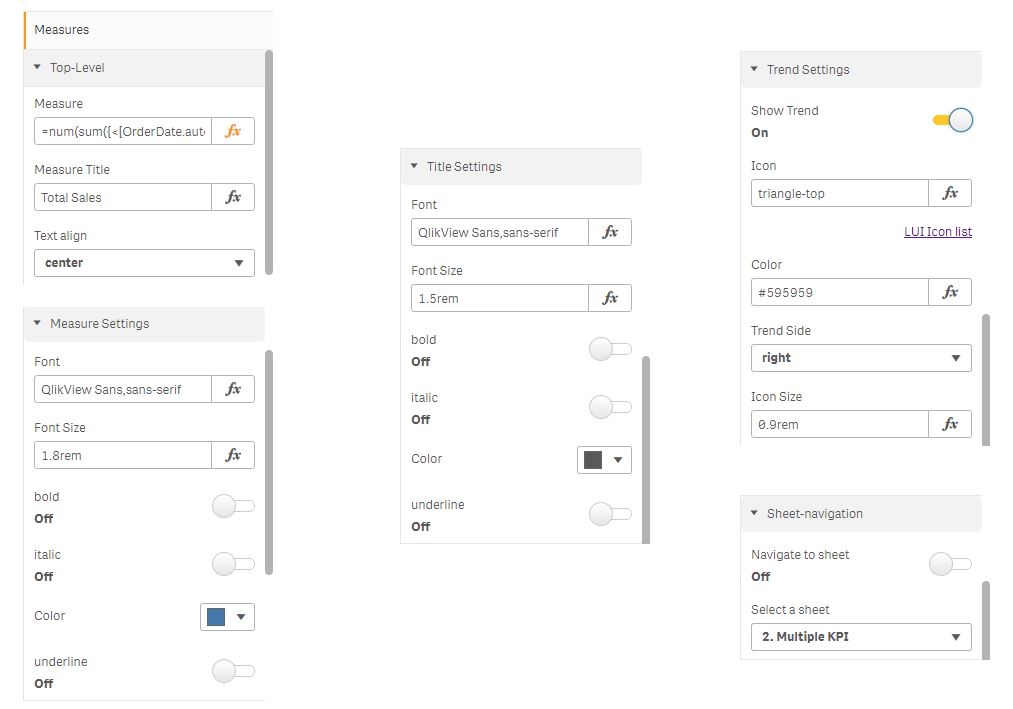
The "main" KPI can be defined under "Measures / Top-Level".
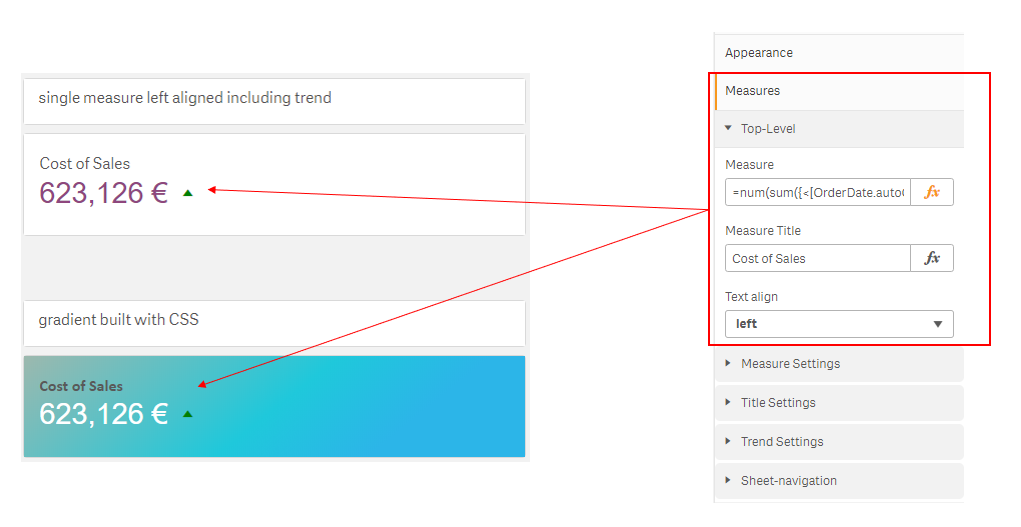
- Measure Settings: contains styling options for the measure
- Title Settings: contains styling options for the title of the measure
- Trend Settings: contains options to define an icon to display trending
- Sheet-navigation: contains config to jump to a different sheet
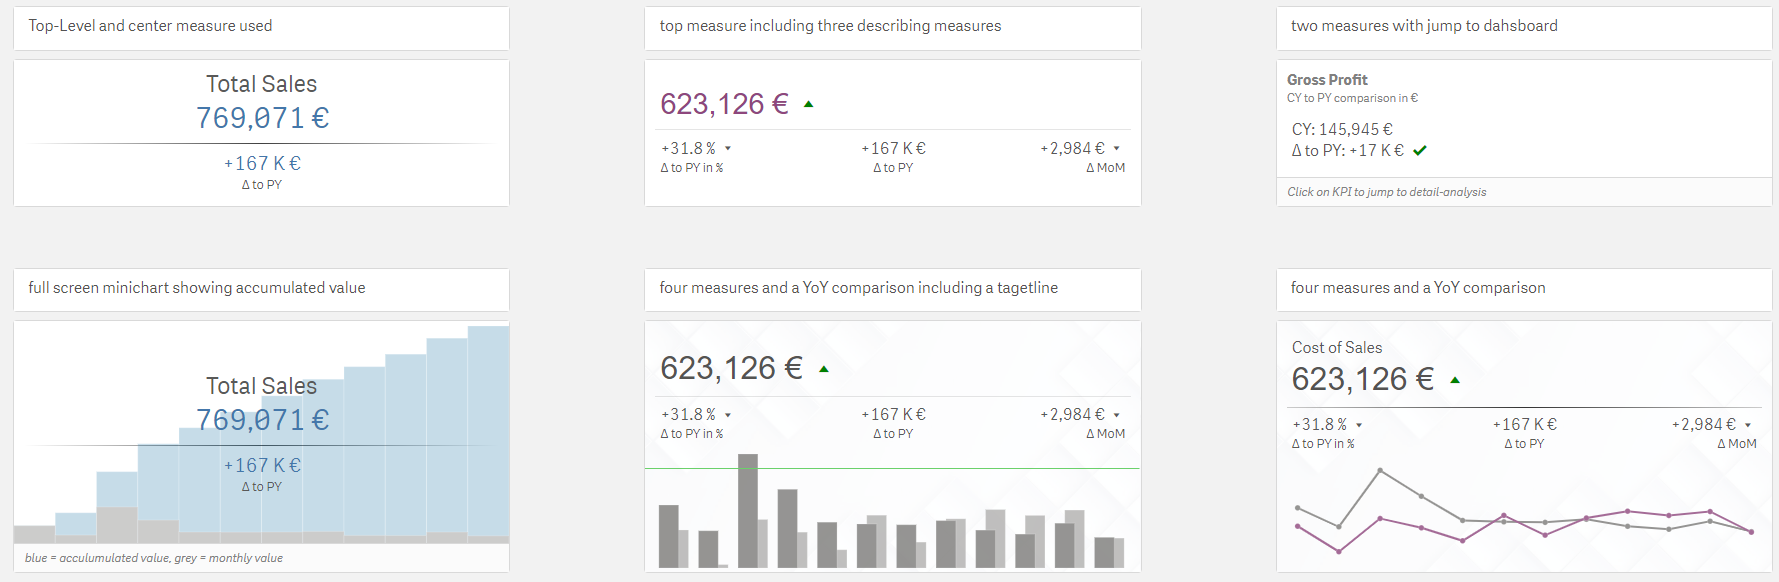
"describing KPIs" left, center and right
It's possible to add up to 3 additional measurers. For configuration go to "Measures / Left, Center, Right".
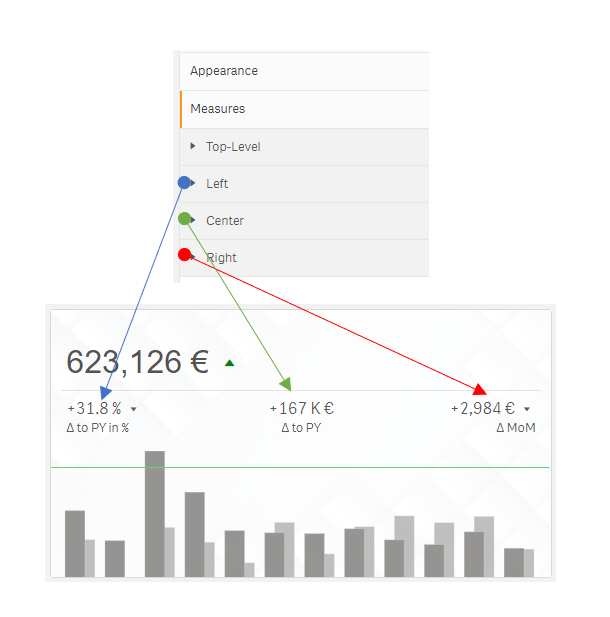
All Measures (Top, Left, Center and Right) will provide you with the following configuration parameters.
Charts
To create a chart you need at least 1 measure and 1 dimension within the "Data" area. If you like to create a comparison you need to define 2 measures.
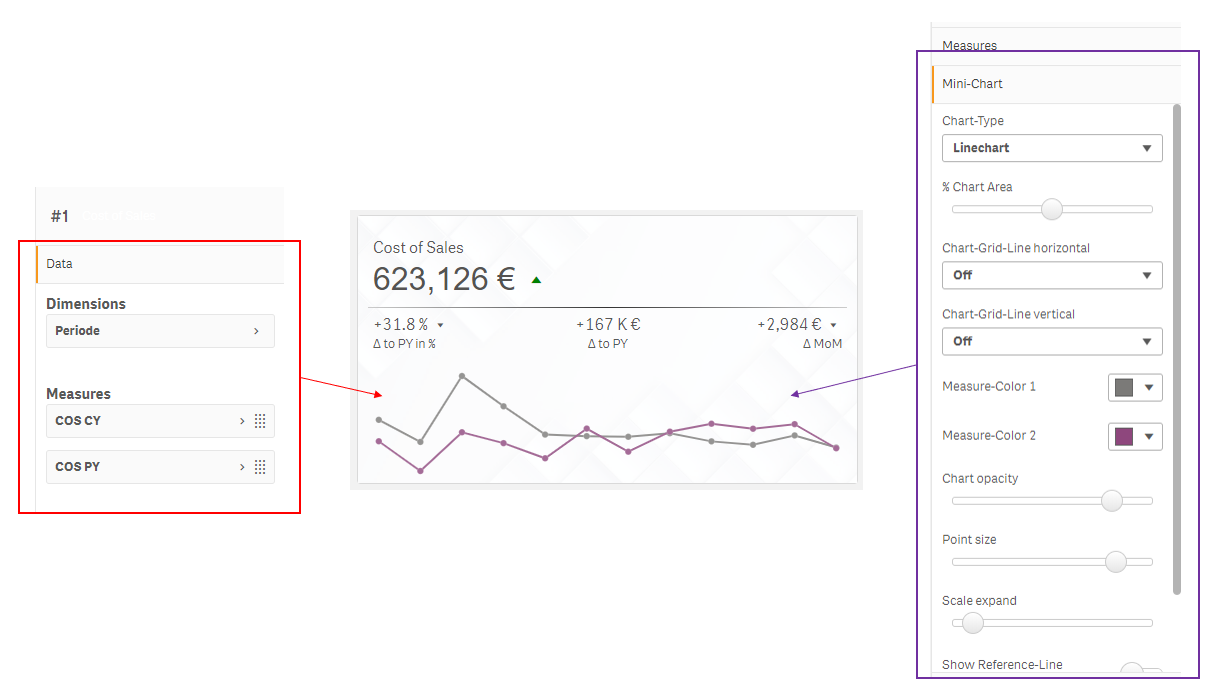
The look and feel (bar-spacing, colors, grid, width and height, padding etc.) and the chart-typ can be defined under "Mini-Chart"
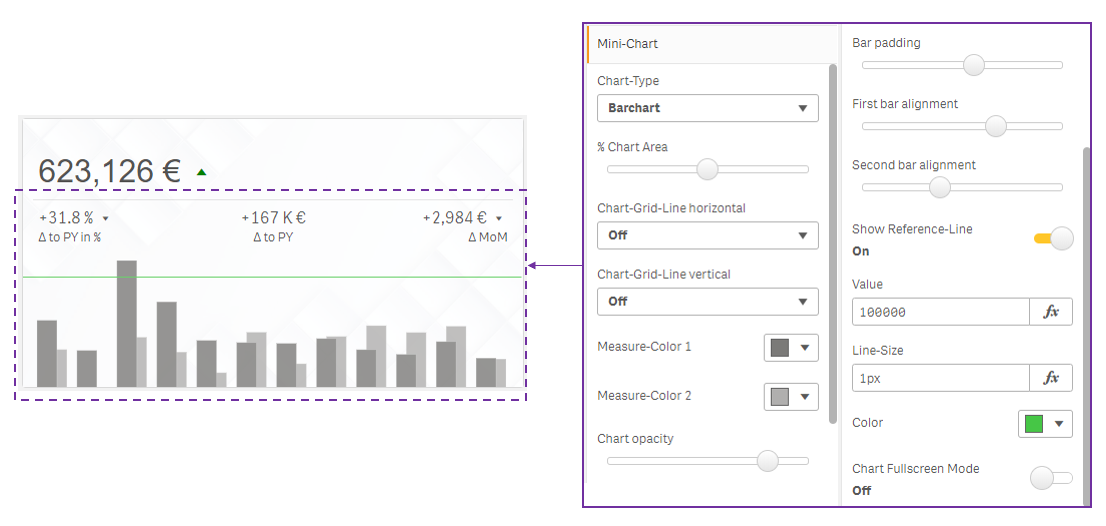
- Chart-Type: define the chart-type you want to use
- % Chart Area: changes the proportion of the chart and the KPI area
- Chart-Grid-Line horizontal: enables the horizontal chart-grid
- Chart-Grid-Line vertical: enables the vertical chart-grid
- Measure-Color 1 & 2: defines the color of the graph
- Chart opacity: changes the opacity of the whole chart-area
- Bar padding: defines the spacing between the bar
- First & Second bar alignment: positioning of the corresponding bars
- Show Reference-Line: enables the reference-line
- Chart Fullscreen Mode: sets the chart to fullscreen. It'll cover the whole background-area of the object.
etc
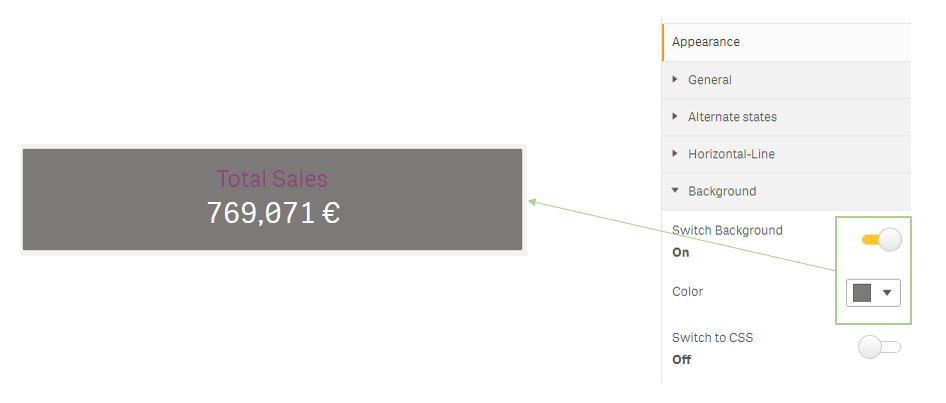
You can configure also a couple of other definitions (background, horizontal-ruler etc.). If you like to define the background you can choose from 3 different options:
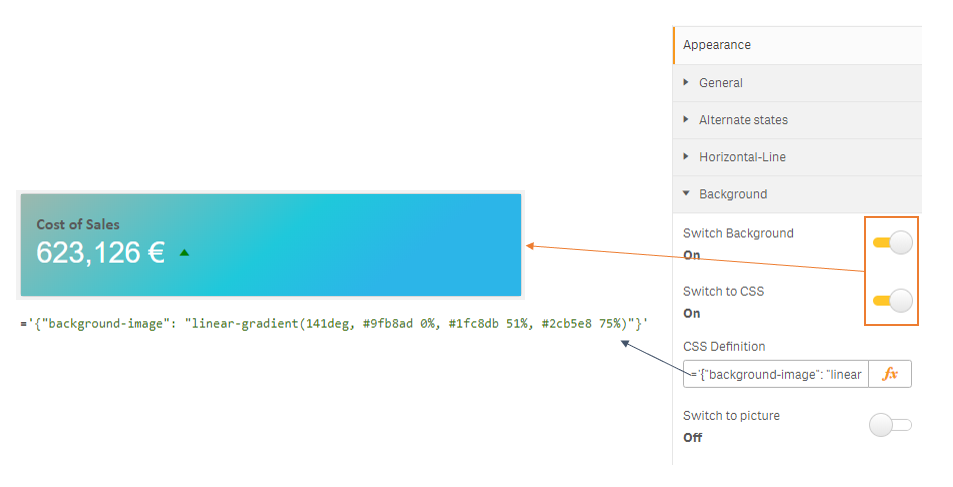
This helps you to define gradients or very specific color configurations. You need to insert the CSS definition as a JSON string.
example:

='{"background-image": "linear-gradient(141deg, #9fb8ad 0%, #1fc8db 51%, #2cb5e8 75%)"}'
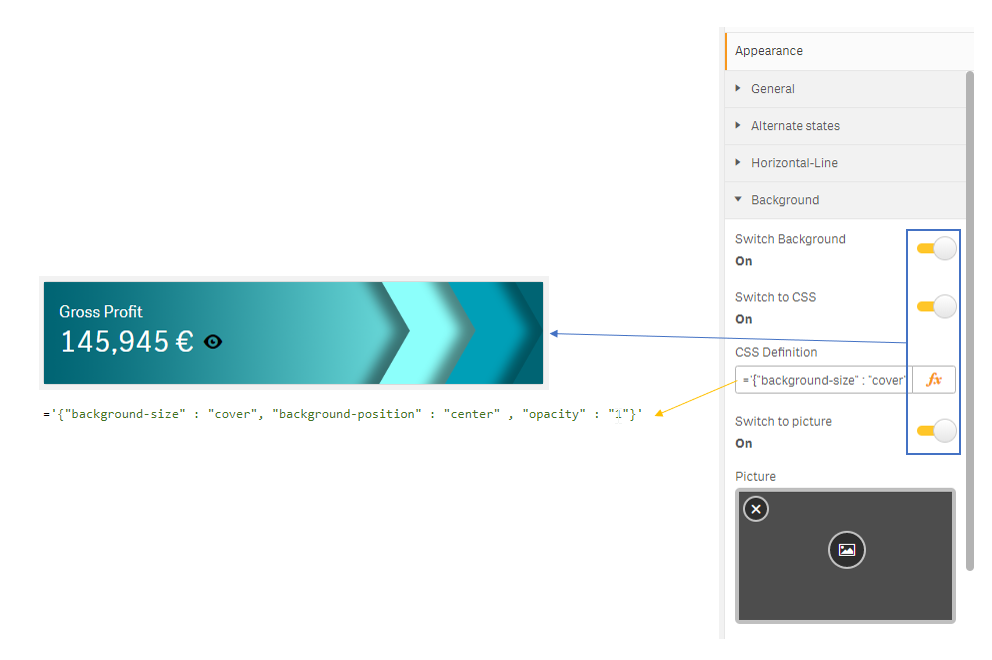
You can select a picture that has been uploaded to the application. To manage the best positioning it is possible to add CSS definition. This also requires JSON notation.
example:

='{"background-size" : "cover", "background-position" : "center" , "opacity" : "1"}'
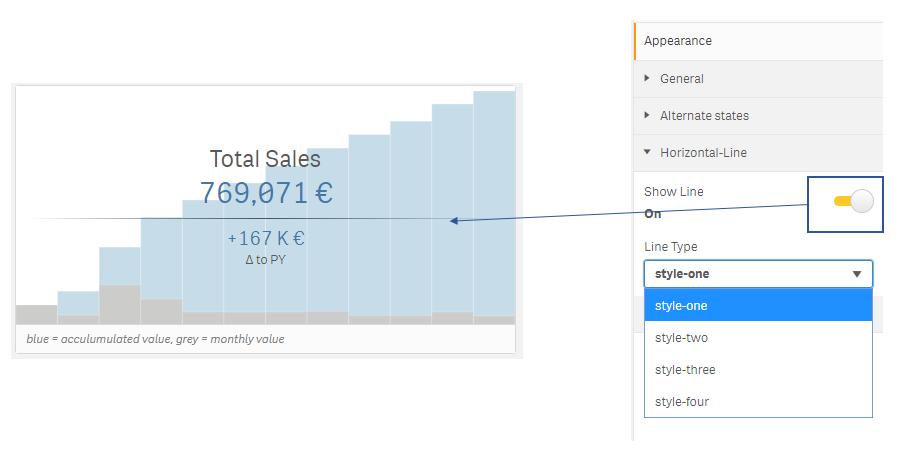
A horizontal-ruler helps you to separate the main KPI from the rest of the object. To enable a horizontal-ruler just activate the cswitch under "Appearance / Horizontal-Line". Now you can choose from a couple of pre-defined designs.
| Menu | Object |
|---|---|
 |
 |
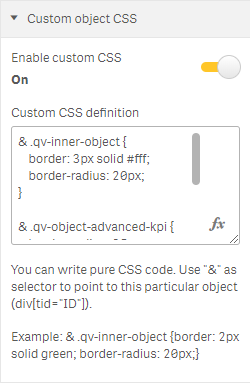
You can define "Custom object CSS". his gives you the possibility to write CSS for the whole object and sheet. If you like to write specific CSS for just your created object it is possible to use the CSS selector "&". It will be replaced by "div[tid="objID"]" to define code that effects just a single object.
In this example I used the following code to set a border with a radius and to overwrite theme CSS setting:
& .qv-inner-object {
  border: 3px solid #fff;
  border-radius: 20px;
}

& .qv-object-advanced-kpi {
  border-radius: 25px !important;
}

& article {
  border: 0px !important;
}
| Menu | Object |
|---|---|
 |
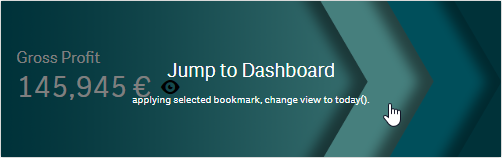 |
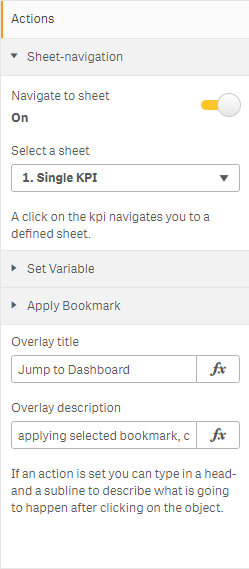
With the "Actions" section it is possible to define events that will be executed as soon as a user clicks on the KPI object. The follwoing funtions are included:
- "Sheet-navigation" - jumps to a defined worksheet
- "Set Variable" - sets a variable to a defined value. (It's possible to use an expression to define the value)
- "Apply Bookmark" - applies a selected bookmark
- "Open URL" - opens a defined URL
This actions can be combined. Just turn the dedicated switch to on to enable the function. Functions will be executed in a top-down order.
Developing the extension
If you want to do code changes to the extension follow these simple steps to get going.
- Get Qlik Sense Desktop
- Create a new app and add advanced-kpi to a sheet.
- Clone the repository
- Run
npm install - Run
npm run build- to build a dev-version to the /dist folder. - Move the content of the /dist folder to the extension directory. Usually in
C:/Users/<user>/Documents/Qlik/Sense/Extensions/advanced-kpi.
Original authors
License
Released under the MIT License.