Agoodle: GDAL + numpy
Access raster datasets through GDAL as numpy arrays. Perform polygon querires on raster datasets.
| Author: | Brent Pedersen (brentp), Josh Livni (jlivni) |
|---|---|
| Email: | [email protected] |
| License: | MIT |
Summary
There are 2 use cases for AGoodle.
- you want to access raster data as a numpy array. This is very powerful and gives you all of the power of numpy on your raster data. So you can do things like count the number of raster cells of a give class, mask values, or perform general calculations.
- you want to query raster data with a polygon. That is, you have a polygon and want a summary of the various cells falling within that raster. This is encapsulated in a single method in AGoodle: AGoodle.summarize_wkt. see example below.
>>> from agoodle import AGoodle
>>> g = AGoodle('agoodle/tests/data/z.tif')
>>> g.raster_info.extent
(-13249847.854555907, 4515032.8277741019, -13181883.342945984, 4598109.0017419849)

# you'll more likely get wkt from an openlayers query or shapely.
>>> wkt = """POLYGON ((-13249847.8545559067279100 4564878.5321548320353031, -13236254.9522339217364788 4581493.7669484084472060, -13222662.0499119367450476 4598109.0017419848591089, -13209069.1475899536162615 4515032.8277741018682718, -13195476.2452679686248302 4531648.0625676782801747, -13181883.3429459836333990 4548263.2973612546920776, -13249847.8545559067279100 4564878.5321548320353031))"""

>>> summary = g.summarize_wkt(wkt)

# now summary is a dict of raster-class => area. where the sum of the areas
# is about equal to the area of the wkt query polygon.

>>> import pprint
>>> pprint.pprint(summary)
{11: 2006769.8807835164,
 21: 4002006.6013326449,
 22: 846245.6321982214,
 23: 25949.610527373057,
 31: 6582551.2037769658,
 41: 5512850.5920374766,
 42: 344535862.26199067,
 43: 1069700.6117394895,
 52: 967202533.44642437,
 71: 19593397.593195956,
 81: 707847.70938556513,
 82: 126864.76257826829,
 90: 2145167.8035961729,
 95: 44690.995908253601}
summary_wkt is the workhorse, it can also accept the kwarg of wkt_epsg, if you are specifying WKT in a projection that is different from the raster which is being queried. The units returned in the summary are always those of the raster being queried. Generally, you will want to convert the keys in summary to their human readable names.
Installation
Requirements
- GDAL configure with --with-python to enable python bindings.
- numpy
- matplotlib
Agoodle
get agoodle, run tests, install:
git clone http://github.com/brentp/agoodle/
cd agoodle
python setup.py install
Usage
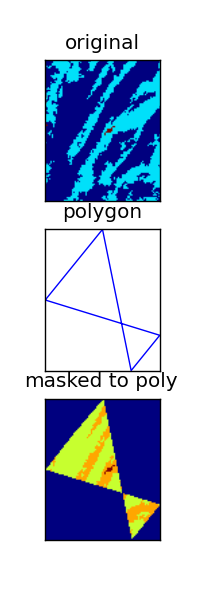
See Summary and landsummary demo where you can query a raster dataset by drawing a polygon on an openlayers map. Generally, you'll grab an array, mask it to a polygon, then query it. The following is generated from the example script included in the agoodle repo. (colors are different between top, bottom because matplotlib is automatically choosing the colors.) In the bottom figure, blue values are masked.
Development
please fork, patch, document, contribute.
Note
There are some major rounding issues at the edges, so if your query polygon is small compared to the size of the raster, the result will not be very accurate. This is something someone could fix with some thinking, I just haven't had the time or inclination. For large polygon queries, it won't make a difference.