grafana / Azure Data Explorer Datasource
Programming Languages
Azure Data Explorer Datasource For Grafana


![]()
Azure Data Explorer is a log analytics cloud platform optimized for ad-hoc big data queries.
Installation
This plugin requires Grafana 7.1.0 or newer as of version 3.0.0. Plugin versions prior to 3.0.0 require Grafana 6.3.6.
Grafana Cloud
If you do not have a Grafana Cloud account, you can sign up for one here.
-
Click on the
Install Nowbutton on the Azure Data Explorer page on Grafana.com. This will automatically add the plugin to your Grafana instance. It might take up to 30 seconds to install.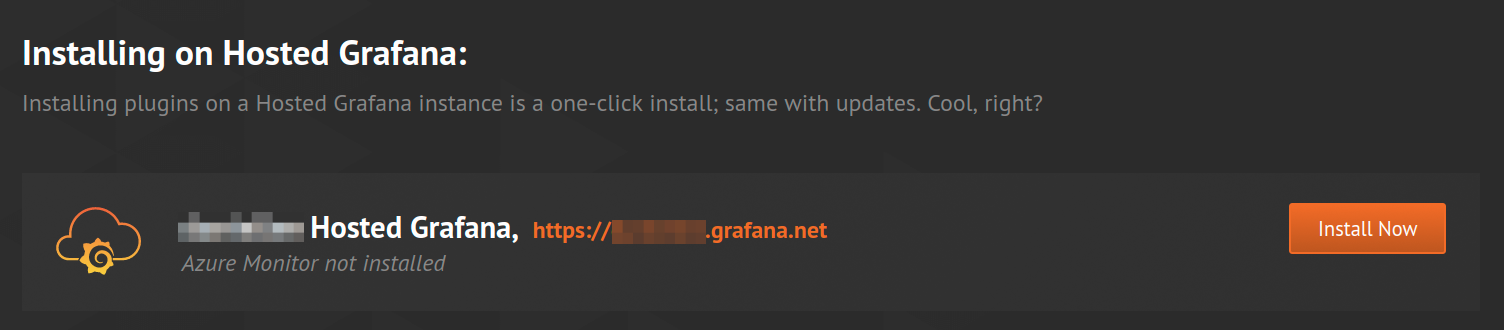
-
Login to your Hosted Grafana instance (go to your instances page in your profile):
https://grafana.com/orgs/<yourUserName>/instances/and the Azure Data Explorer datasource will be installed.
Installation Instructions on the Grafana Docs Site
- Installing on Debian/Ubuntu
- Installing on RPM-based Linux (CentOS, Fedora, OpenSuse, RedHat)
- Installing on Windows
- Installing on Mac
Metric Naming & Aliasing
TODO: link to document on names in grafana 7.1+
Docker
-
Fetch the latest version of grafana from Docker Hub:
docker pull grafana/grafana:latest -
Run Grafana and install the Azure Data Explorer plugin with this command:
docker run -d --name=grafana -p 3000:3000 -e "GF_INSTALL_PLUGINS=grafana-azure-data-explorer-datasource" grafana/grafana:latest
-
Open the browser at: http://localhost:3000 or http://your-domain-name:3000
-
Login in with username:
adminand password:admin -
To make sure the plugin was installed, check the list of installed datasources. Click the Plugins item in the main menu. Both core datasources and installed datasources will appear.
This ia an alternative command if you want to run Grafana on a different port than the default 3000 port:
docker run -d --name=grafana -p 8081:8081 -e "GF_SERVER_HTTP_PORT=8081" -e "GF_INSTALL_PLUGINS=grafana-azure-data-explorer-datasource" grafana/grafana:master
It is recommended that you use a volume to save the Grafana data in. Otherwise if you remove the docker container, you will lose all your Grafana data (dashboards, users etc.). You can create a volume with the Docker Volume Driver for Azure File Storage.
Installing the Plugin on an Existing Grafana with the CLI
Grafana comes with a command line tool that can be used to install plugins.
- Upgrade Grafana to the latest version. Get that here.
- Run this command:
grafana-cli plugins install grafana-azure-data-explorer-datasource - Restart the Grafana server.
- Open the browser at: http://localhost:3000 or http://your-domain-name:3000
- Login in with a user that has admin rights. This is needed to create datasources.
- To make sure the plugin was installed, check the list of installed datasources. Click the Plugins item in the main menu. Both core datasources and installed datasources will appear.
Installing the Plugin Manually on an Existing Grafana
If the server where Grafana is installed has no access to the Grafana.com server, then the plugin can be downloaded and manually copied to the server.
- Upgrade Grafana to the latest version. Get that here.
- Get the zip file from Grafana.com: https://grafana.com/plugins/grafana-azure-data-explorer-datasource/installation and click on the link in step 1 (with this text: "Alternatively, you can manually download the .zip file")
- Extract the zip file into the data/plugins subdirectory for Grafana.
- Restart the Grafana server
- To make sure the plugin was installed, check the list of installed datasources. Click the Plugins item in the main menu. Both core datasources and installed datasources will appear.
Configuring the datasource in Grafana
The steps for configuring the integration between the Azure Data Explorer service and Grafana are:
- Create an Azure Active Directory (AAD) Application and AAD Service Principle.
- Log into the Azure Data Explorer WebExplorer and connect the AAD Application to an Azure Data Explorer database user.
- Use the AAD Application to configure the datasource connection in Grafana.
Creating an Azure Active Directory Service Principle
Follow the instructions in the guide to setting up an Azure Active Directory Application.
An alternative way to create an AAD application is with the Azure CLI:
az ad sp create-for-rbac -n "http://url.to.your.grafana:3000"
This should return the following:
{
  "appId": "XXXXXXXX-XXXX-XXXX-XXXX-XXXXXXXXXXXX",
  "displayName": "azure-cli-2018-09-20-13-42-58",
  "name": "http://url.to.your.grafana:3000",
  "password": "XXXXXXXX-XXXX-XXXX-XXXX-XXXXXXXXXXXX",
  "tenant": "XXXXXXXX-XXXX-XXXX-XXXX-XXXXXXXXXXXX"
}
Assign the Reader role to the Service Principal and remove the Contributor role:
az role assignment create --assignee <your appId> --role Reader
az role assignment delete --assignee <your appId> --role Contributor
Connecting AAD with an Azure Data Explorer User
Navigate to the Azure Web UI for Azure Data Explorer: https://dataexplorer.azure.com/clusters/nameofyourcluster/databases/yourdatabasename
You can find the link to the Web UI in the Azure Portal by navigating to:
- All services-> Azure Data Explorer Clusters option
- Choose your cluster
- Databases -> click on your database
- Choose the Query option -> then click on the "Open in web UI" link
To create a cluster and database, follow the instructions here.
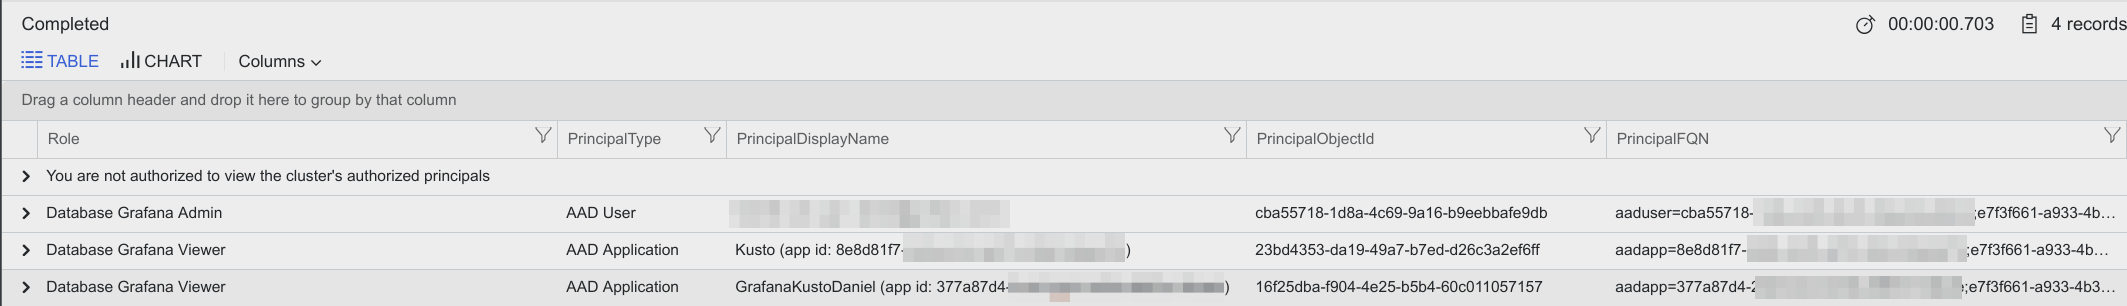
The AAD application that you created above needs to be given viewer access to your Azure Data Explorer database (in this example the database is called Grafana). This is done using the dot command add. The argument for .add contains both the client and tenant id separated by a semicolon:
.add database Grafana viewers ('aadapp=<your client id>;<your tenantid>')
A real example with a client/app id and tenant id:
.add database Grafana viewers ('aadapp=377a87d4-2cd3-44c0-b35a-8887a12fxxx;e7f3f661-a933-4b3f-8176-51c4f982exxx')
If the command succeeds you should get a result like this:
Configuring Grafana
-
Accessed from the Grafana main menu, newly installed datasources can be added immediately within the Data Sources section. Next, click the "Add datasource" button in the upper right.
-
Select Azure Data Explorer Datasource from the datasource list:
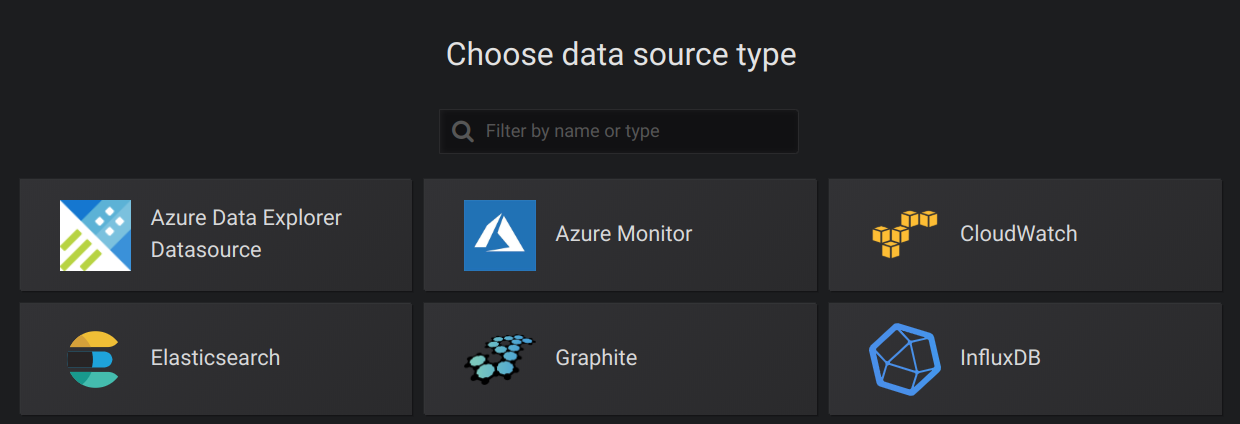
-
In the name field, a default name is filled in automatically but it can be changed to anything.
-
You need 3 pieces of information from the Azure portal (see link above for detailed instructions):
- Tenant Id (Azure Active Directory -> Properties -> Directory ID)
- Client Id (Azure Active Directory -> App Registrations -> Choose your app -> Application ID)
- Client Secret ( Azure Active Directory -> App Registrations -> Choose your app -> Keys)
-
Paste these three items into the fields in the Azure Data Explorer API Details section:
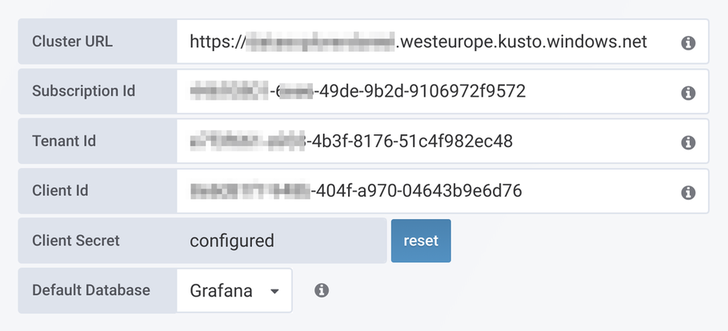
-
Click the
Save & Testbutton. After a few seconds once Grafana has successfully connected then choose the default database and save again.
Writing Queries
Queries are written in the new Kusto Query Language.
Queries can be formatted as Table, Time Series, or ADX Time Series data.
Table Queries
Table queries are mainly used in the Table panel and row a list of columns and rows. This example query returns rows with the 6 specified columns:
AzureActivity
| where $__timeFilter()
| project TimeGenerated, ResourceGroup, Category, OperationName, ActivityStatus, Caller
| order by TimeGenerated desc
Time Series Queries
Time Series queries are for the Graph Panel (and other panels like the Single Stat panel). The query must contain exactly one datetime column, one or more number valued columns, and optionally one more more string columns as labels. Here is an example query that returns the aggregated count grouped by the Category column and grouped by hour:
AzureActivity
| where $__timeFilter(TimeGenerated)
| summarize count() by Category, bin(TimeGenerated, 1h)
| order by TimeGenerated asc
The number valued columns are considered metrics and the optional string columns are treated as tags. A time series is returned for each value column + unique set of string column values. Each series has name of valueColumnName {stringColumnName=columnValue, ... }.
For example, the following query will produce series like AvgDirectDeaths {EventType=Excessive Heat, State=DELAWARE}``EventCount {EventType=Excessive Heat, State=NEW JERSEY}:
StormEvents
| where $__timeFilter(StartTime)
| summarize EventCount=count(), AvgDirectDeaths=avg(DeathsDirect) by EventType, State, bin(StartTime, $__timeInterval)
| order by StartTime asc
ADX Time Series Queries
ADX Time Series are for queries that use the Kusto make-series operator. The query must have exactly one datetime column named Timestamp and at least one value column. There may also optionally be string columns that will be labels.
Example:
let T = range Timestamp from $__timeFrom to ($__timeTo + -30m) step 1m
  | extend   Person = dynamic(["Torkel", "Daniel", "Kyle", "Sofia"])
  | extend   Place  = dynamic(["EU",     "EU",     "US",   "EU"])
  | mvexpand Person, Place
  | extend   HatInventory = rand(5)
  | project  Timestamp, tostring(Person), tostring(Place), HatInventory;

T | make-series AvgHatInventory=avg(HatInventory) default=double(null) on Timestamp from $__timeFrom to $__timeTo step 1m by Person, Place
  | extend series_decompose_forecast(AvgHatInventory, 30) | project-away *residual, *baseline, *seasonal
Time Macros
To make writing queries easier there are two Grafana macros that can be used in the where clause of a query:
-
$__timeFilter()- Expands toTimeGenerated ≥ datetime(2018-06-05T18:09:58.907Z) and TimeGenerated ≤ datetime(2018-06-05T20:09:58.907Z)where the from and to datetimes are taken from the Grafana time picker. -
$__timeFilter(datetimeColumn)- Expands todatetimeColumn ≥ datetime(2018-06-05T18:09:58.907Z) and datetimeColumn ≤ datetime(2018-06-05T20:09:58.907Z)where the from and to datetimes are taken from the Grafana time picker. -
$__timeFrom- Expands todatetime(2018-06-05T18:09:58.907Z), the start time of the query. -
$__timeTo- expands todatetime(2018-06-05T20:09:58.907Z), the end time of the query. -
$__timeInterval- expands to5000ms, Grafana's recommended bin size based on the timespan of the query, in milliseconds. In alerting this will always be1000ms, it is recommended not to use this macro in alert queries.
Templating Macros
-
$__escapeMulti($myVar)- is to be used with multi-value template variables that contains illegal characters. If $myVar has the value'\\grafana-vm\Network(eth0)\Total','\\hello!', it expands to:@'\\grafana-vm\Network(eth0)\Total', @'\\hello!'. If using single value variables there no need for this macro, simply escape the variable inline instead -@'\$myVar' -
$__contains(colName, $myVar)- is to be used with multi-value template variables. If $myVar has the value'value1','value2', it expands to:colName in ('value1','value2').If using the
Alloption, then check theInclude All Optioncheckbox and in theCustom all valuefield type in the following value:all. If $myVar has valueallthen the macro will instead expand to1 == 1. For template variables with a lot of options, this will increase the query performance by not building a large where..in clause.
Templating with Variables
Instead of hard-coding things like server, application and sensor name in your metric queries you can use variables in their place. Variables are shown as dropdown select boxes at the top of the dashboard. These dropdowns make it easy to change the data being displayed in your dashboard.
Create the variable in the dashboard settings. Usually you will need to write a query in the Kusto Query Language to get a list of values for the dropdown. It is however also possible to have a list of hard-coded values.
-
Fill in a name for your variable. The
Namefield is the name of the variable. There is also aLabelfield for the friendly name. -
In the Query Options section, choose the
Azure Data Explorerdatasource in theData sourcedropdown. -
Write the query in the
Queryfield. Useprojectto specify one column - the result should be a list of string values.
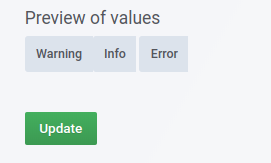
-
At the bottom, you will see a preview of the values returned from the query:
-
Use the variable in your query (in this case the variable is named
level):MyLogs | where Level == '$level'
For variables where multiple values are allowed then use the
inoperator instead:MyLogs | where Level in ($level)
Read more about templating and variables in the Grafana documentation.
Databases Variable
There is no way to fetch a list of databases with the Kusto query language. When creating a template variable as described in the Templating with variables section, use the following function in the Query field to return a list of databases:
databases()
This variable can be used in the databases dropdown. This gives you the ability to switch databases without editing the query in the panel.
To use the variable, type the name of your variable into the dropdown. For example, if the name of your variable is database, then type $database.
Annotations
An annotation is an event that is overlaid on top of graphs. The query can have up to three columns per row, the datetime column is mandatory. Annotation rendering is expensive so it is important to limit the number of rows returned.
- column with the datetime type.
- column with alias: Text or text for the annotation text
- column with alias: Tags or tags for annotation tags. This should return a comma separated string of tags e.g. 'tag1,tag2'
Example query:
MyLogs
| where $__timeFilter(Timestamp)
| project Timestamp, Text=Message , Tags="tag1,tag2"
CHANGELOG
See the Changelog.