grafana / Azure Monitor Datasource
Programming Languages
Azure Monitor Data Source For Grafana (deprecated - now included in core Grafana)
This codebase has been moved into Grafana since version 6.0 of Grafana - announcement here.
Documentation for Azure Monitor in Grafana
Azure Monitor is the platform service that provides a single source for monitoring Azure resources. Application Insights is an extensible Application Performance Management (APM) service for web developers on multiple platforms and can be used to monitor your live web application - it will automatically detect performance anomalies.
The Azure Monitor Data Source plugin supports Azure Monitor, Azure Log Analytics and Application Insights metrics in Grafana.
Features
- Support for all the Azure Monitor metrics
- includes support for the latest API version that allows multi-dimensional filtering for the Storage and SQL metrics.
- Automatic time grain mode which will group the metrics by the most appropriate time grain value depending on whether you have zoomed in to look at fine-grained metrics or zoomed out to look at an overview.
- Application Insights metrics
- Write raw log analytics queries, and select x-axis, y-axis, and grouped values manually.
- Automatic time grain support
- Support for Log Analytics (both for Azure Monitor and Application Insights)
- You can combine metrics from both services in the same graph.
Installation
This plugin requires Grafana 4.5.0 or newer (5.2.0 or newer if you are querying Azure Log Analytics).
Grafana Cloud
If you do not have a Grafana Cloud account, you can sign up for one here.
-
Click on the
Install Nowbutton on the Azure Monitor page on Grafana.com. This will automatically add the plugin to your Grafana instance. It might take up to 30 seconds to install.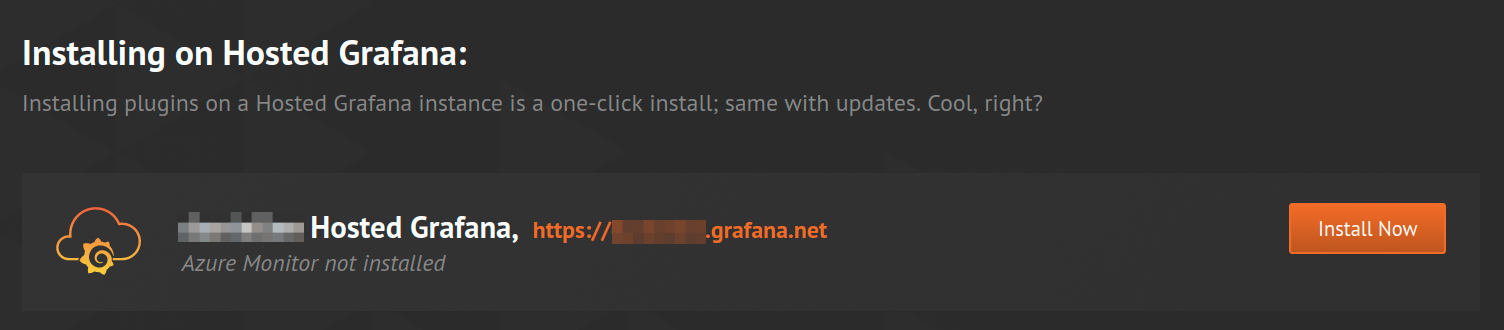
-
Login to your Hosted Grafana instance (go to your instances page in your profile):
https://grafana.com/orgs/<yourUserName>/instances/and the Azure Monitor data source will be installed.
Installation Instructions on the Grafana Docs Site
- Installing on Debian/Ubuntu
- Installing on RPM-based Linux (CentOS, Fedora, OpenSuse, RedHat)
- Installing on Windows
- Installing on Mac
Docker
- Fetch the latest version of grafana from Docker Hub:
docker pull grafana/grafana:latest - Run Grafana and install the Azure Monitor plugin with this command:
docker run -d --name=grafana -p 3000:3000 -e "GF_INSTALL_PLUGINS=grafana-azure-monitor-datasource" grafana/grafana:latest
- Open the browser at: http://localhost:3000 or http://your-domain-name:3000
- Login in with username:
adminand password:admin - To make sure the plugin was installed, check the list of installed data sources. Click the Plugins item in the main menu. Both core data sources and installed data sources will appear.
This ia an alternative command if you want to run Grafana on a different port than the default 3000 port:
docker run -d --name=grafana -p 8081:8081 -e "GF_SERVER_HTTP_PORT=8081" -e "GF_INSTALL_PLUGINS=grafana-azure-monitor-datasource" grafana/grafana:master
It is recommended that you use a volume to save the Grafana data in. Otherwise if you remove the docker container, you will lose all your Grafana data (dashboards, users etc.). You can create a volume with the Docker Volume Driver for Azure File Storage.
Installing the Plugin on an Existing Grafana with the CLI
Grafana comes with a command line tool that can be used to install plugins.
- Upgrade Grafana to the latest version. Get that here.
- Run this command:
grafana-cli plugins install grafana-azure-monitor-datasource - Restart the Grafana server.
- Open the browser at: http://localhost:3000 or http://your-domain-name:3000
- Login in with a user that has admin rights. This is needed to create data sources.
- To make sure the plugin was installed, check the list of installed data sources. Click the Plugins item in the main menu. Both core data sources and installed data sources will appear.
Installing the Plugin Manually on an Existing Grafana
If the server where Grafana is installed has no access to the Grafana.com server, then the plugin can be downloaded and manually copied to the server.
- Upgrade Grafana to the latest version. Get that here.
- Get the zip file from Grafana.com: https://grafana.com/plugins/grafana-azure-monitor-datasource/installation and click on the link in step 1 (with this text: "Alternatively, you can manually download the .zip file")
- Extract the zip file into the data/plugins subdirectory for Grafana.
- Restart the Grafana server
- To make sure the plugin was installed, check the list of installed data sources. Click the Plugins item in the main menu. Both core data sources and installed data sources will appear.
Configure the data source
The plugin can access metrics from both the Azure Monitor service and the Application Insights API. You can configure access to one service or both services.
- Guide to setting up an Azure Active Directory Application for Azure Monitor.
- Guide to setting up an Azure Active Directory Application for Azure Log Analytics.
- Quickstart Guide for Application Insights.
-
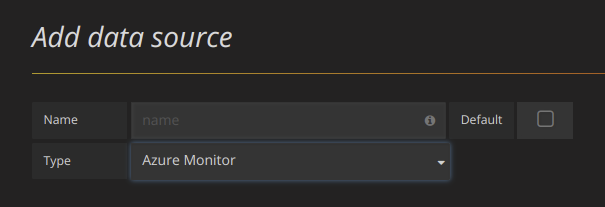
Accessed from the Grafana main menu, newly installed data sources can be added immediately within the Data Sources section. Next, click the "Add data source" button in the upper right. The data source will be available for selection in the Type select box.
-
Select Azure Monitor from the Type dropdown:
-
In the name field, fill in a name for the data source. It can be anything. Some suggestions are Azure Monitor or App Insights.
-
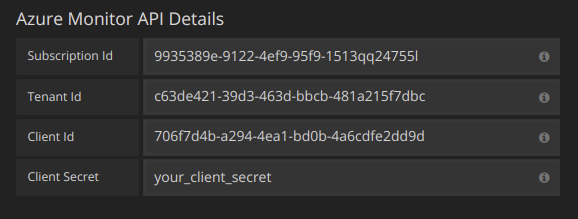
If you are using Azure Monitor, then you need 4 pieces of information from the Azure portal (see link above for detailed instructions):
- Tenant Id (Azure Active Directory -> Properties -> Directory ID)
- Subscription Id (Subscriptions -> Choose subscription -> Overview -> Subscription ID)
- Client Id (Azure Active Directory -> App Registrations -> Choose your app -> Application ID)
- Client Secret ( Azure Active Directory -> App Registrations -> Choose your app -> Keys)
-
Paste these four items into the fields in the Azure Monitor API Details section:
-
If you are also using the Azure Log Analytics service, then you need to specify these two config values (or you can reuse the Client Id and Secret from the previous step).
- Client Id (Azure Active Directory -> App Registrations -> Choose your app -> Application ID)
- Client Secret ( Azure Active Directory -> App Registrations -> Choose your app -> Keys -> Create a key -> Use client secret)
-
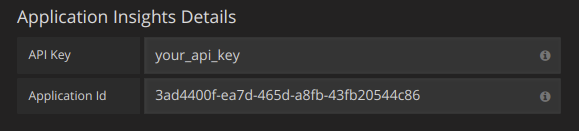
If you are are using Application Insights, then you need two pieces of information from the Azure Portal (see link above for detailed instructions):
- Application ID
- API Key
-
Paste these two items into the appropriate fields in the Application Insights API Details section:
-
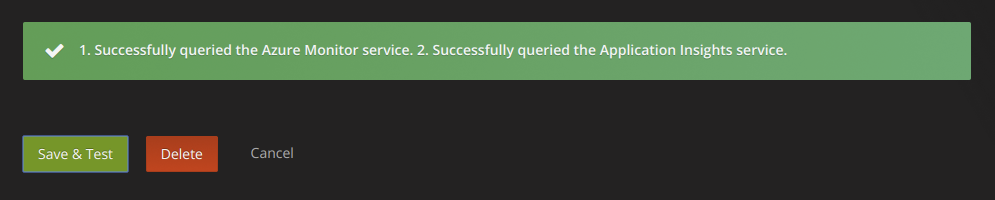
Test that the configuration details are correct by clicking on the "Save & Test" button:
Alternatively on step 4 if creating a new Azure Active Directory App, use the Azure CLI:
az ad sp create-for-rbac -n "http://localhost:3000"
Formatting Legend Keys with Aliases
The default legend formatting for the Azure Monitor API is:
resourceName{dimensionValue=dimensionName}.metricName
and for the Application Insights API is:
metric/name{group/by="groupbyvalue"}
These can be quite long but this formatting can be changed using aliases. In the Legend Format field, the aliases which are defined below can be combined any way you want.
Azure Monitor Examples:
dimension: {{dimensionvalue}}{{resourcegroup}} - {{resourcename}}
Application Insights Examples:
server: {{groupbyvalue}}city: {{groupbyvalue}}{{groupbyname}}: {{groupbyvalue}}
Alias Patterns for Application Insights
-
{{groupbyvalue}}= replaced with the value of the group by -
{{groupbyname}}= replaced with the name/label of the group by -
{{metric}}= replaced with metric name (e.g. requests/count)
Alias Patterns for Azure Monitor
-
{{resourcegroup}}= replaced with the value of the Resource Group -
{{namespace}}= replaced with the value of the Namespace (e.g. Microsoft.Compute/virtualMachines) -
{{resourcename}}= replaced with the value of the Resource Name -
{{metric}}= replaced with metric name (e.g. Percentage CPU) -
{{dimensionname}}= replaced with dimension key/label (e.g. blobtype) -
{{dimensionvalue}}= replaced with dimension value (e.g. BlockBlob)
Filter Expressions for Application Insights
The filter field takes an OData filter expression.
Examples:
client/city eq 'Boydton'client/city ne 'Boydton'client/city ne 'Boydton' and client/city ne 'Dublin'client/city eq 'Boydton' or client/city eq 'Dublin'
Azure Log Analytics
Queries are written in the new Azure Log Analytics (or KustoDB) Query Language. A Log Analytics Query can be formatted as Time Series data or as Table data.
Time Series queries are for the Graph Panel (and other panels like the Single Stat panel) and must contain a datetime column, a metric name column and a value column. Here is an example query that returns the aggregated count grouped by the Category column and grouped by hour:
AzureActivity
| where $__timeFilter(TimeGenerated)
| summarize count() by Category, bin(TimeGenerated, 1h)
| order by TimeGenerated asc
Table queries are mainly used in the Table panel and row a list of columns and rows. This example query returns rows with the 6 specified columns:
AzureActivity
| where $__timeFilter()
| project TimeGenerated, ResourceGroup, Category, OperationName, ActivityStatus, Caller
| order by TimeGenerated desc
Azure Log Analytics Macros
To make writing queries easier there are two Grafana macros that can be used in the where clause of a query:
-
$__timeFilter()- Expands toTimeGenerated ≥ datetime(2018-06-05T18:09:58.907Z) and TimeGenerated ≤ datetime(2018-06-05T20:09:58.907Z)where the from and to datetimes are taken from the Grafana time picker. -
$__timeFilter(datetimeColumn)- Expands todatetimeColumn ≥ datetime(2018-06-05T18:09:58.907Z) and datetimeColumn ≤ datetime(2018-06-05T20:09:58.907Z)where the from and to datetimes are taken from the Grafana time picker. -
$__escapeMulti($myVar)- is to be used with multi-value template variables that contains illegal characters. If $myVar has the value'\\grafana-vm\Network(eth0)\Total','\\hello!', it expands to:@'\\grafana-vm\Network(eth0)\Total', @'\\hello!'. If using single value variables there no need for this macro, simply escape the variable inline instead -@'\$myVar' -
$__contains(colName, $myVar)- is to be used with multi-value template variables. If $myVar has the value'value1','value2', it expands to:colName in ('value1','value2').If using the
Alloption, then check theInclude All Optioncheckbox and in theCustom all valuefield type in the following value:all. If $myVar has valueallthen the macro will instead expand to1 == 1. For template variables with a lot of options, this will increase the query performance by not building a large where..in clause.
Azure Log Analytics Builtin Variables
There are also some Grafana variables that can be used in Azure Log Analytics queries:
-
$__from- Returns the From datetime from the Grafana picker. Example:datetime(2018-06-05T18:09:58.907Z). -
$__to- Returns the From datetime from the Grafana picker. Example:datetime(2018-06-05T20:09:58.907Z). -
$__interval- Grafana calculates the minimum time grain that can be used to group by time in queries. More details on how it works here. It returns a time grain like5mor1hthat can be used in the bin function. E.g.summarize count() by bin(TimeGenerated, $__interval)
Writing Analytics Queries For Application Insights
If you change the service type to "Application Insights", the menu icon to the right adds another option, "Toggle Edit Mode". Once clicked, the query edit mode changes to give you a full text area in which to write log analytics queries. (This is identical to how the InfluxDB datasource lets you write raw queries.)
Once a query is written, the column names are automatically parsed out of the response data. You can then select them in the "X-axis", "Y-axis", and "Split On" dropdown menus, or just type them out.
There are some important caveats to remember:
- You'll want to order your y-axis in the query, eg.
order by timestamp asc. The graph may come out looking bizarre otherwise. It's better to have Microsoft sort it on their side where it's faster, than to implement this in the plugin. - If you copy a log analytics query, typically they'll end with a render instruction, like
render barchart. This is unnecessary, but harmless. - Currently, four default dashboard variables are supported:
$__timeFilter(),$__from,$__to, and$__interval. If you're searching in timestamped data, replace the beginning of your where clause towhere $__timeFilter(). Dashboard changes by time region are handled as you'd expect, as long as you leave the name of thetimestampcolumn alone. Likewise,$__intervalwill automatically change based on the dashboard's time region and the width of the chart being displayed. Use it in bins, sobin(timestamp,$__interval)changes into something likebin(timestamp,1s). Use$__fromand$__toif you just want the formatted dates to be inserted. - Templated dashboard variables are not yet supported! They will come in a future version.
Templating with Variables
Instead of hard-coding things like server, application and sensor name in you metric queries you can use variables in their place. Variables are shown as dropdown select boxes at the top of the dashboard. These dropdowns makes it easy to change the data being displayed in your dashboard.
The Azure Monitor Datasource Plugin provides the following queries you can specify in the Query field in the Variable edit view. They allow you to fill a variable's options list.
Application Insights
| Name | Description |
|---|---|
| AppInsightsMetricNames() | Returns a list of metric names. |
| AppInsightsGroupBys(aMetricName) | Returns a list of group bys for the specified metric name. |
Examples:
- Metric Names query:
AppInsightsMetricNames() - Passing in metric name variable:
AppInsightsGroupBys(requests/count) - Chaining template variables:
AppInsightsGroupBys($metricnames)
Azure Monitor
| Name | Description |
|---|---|
| ResourceGroups() | Returns a list of resource groups. |
| Namespaces(aResourceGroup) | Returns a list of namespaces for the specified resource group. |
| ResourceNames(aResourceGroup, aNamespace) | Returns a list of resource names. |
| MetricNames(aResourceGroup, aNamespace, aResourceName) | Returns a list of metric names. |
Examples:
- Resource Groups query:
ResourceGroups() - Passing in metric name variable:
Namespaces(cosmo) - Chaining template variables:
ResourceNames($rg, $ns) - Do not quote parameters:
MetricNames(hg, Microsoft.Network/publicIPAddresses, grafanaIP)
Development
To install and build the plugin:
-
git clonethis project into yourdata/pluginssubdirectory in your Grafana instance. yarn install --pure-lockfilegrunt-
karma start --single-runto run the tests once. - Restart your Grafana server to start using the plugin in Grafana (Grafana only needs to be restarted once).
grunt watch will build the TypeScript files and copy everything to the dist directory automatically when a file changes. This is useful for when working on the code. karma start will turn on the karma file watcher so that it reruns all the tests automatically when a file changes.
The plugin is written in TypeScript and changes should be made in the src directory. The build task transpiles the TypeScript code into JavaScript and copies it to the dist directory. Grafana will load the JavaScript from the dist directory and ignore the src directory.
CHANGELOG
v0.3.0
- Update to whitelist for Azure Monitor metrics. Some new services now supported.
- Fix for loading the Monaco editor when using Grafana behind a reverse proxy. #75 Thank you, @netiperher
v0.2.2
- Adds support for the $__escapeMulti macro for multi value template variables in the Azure Log Analytics datasource
v0.2.1
- Adds support for $__contain macro for multi value template variables in the Azure Log Analytics datasource
v0.2.0
- Added raw query support for Application Insights.
- Add support for Azure Log Analytics with Monaco Editor and intellisense.
- Basic support for Application Insights Log Analytics.
v0.1.2
Fix for long metric names which means that the Azure WebApp Slots metrics now work. #27
v0.1.1
Small bugfix for the query editor when adding a new panel.
v0.1.0
- Variable support for both Azure Monitor and Application Insights
- Support for Azure US Government, Azure Germany and Azure China clouds
- Filter support for Application Insights
- Azure Monitor API version updated and time grain changes implemented. This is a possible breaking change for some dashboards - previously a wider range of time grains was allowed so you might get the following error after upgrading:
Detected invalid time grain input. To fix, choose a valid time grain for that metric.
v0.0.9
- Adds support for the
uniqueaggregation for Application Insights.
v0.0.8
- Adds support for legend formatting with aliases.
v0.0.7
- Adds support for the CosmoDB API.
v0.0.6
- Auto time grain fix.
v0.0.5
- Fix for breaking change in Grafana master to prevent problems in future.
v0.0.4
- Multi-dimensional filtering
- Support for the Microsoft.Sql API and for the Storage API.
v0.0.3
Uses the latest version of the Azure Monitor REST API (2017-05-01-preview). Does not currently change anything for the user but enables new features in the future.
v0.0.2
- Changes legend format for Azure Monitor to
resourceName.metricNameinstead of justmetricName.
v0.0.1
- First version. Can show metrics from both the Azure Monitor service and the Application Insights service. Can combine metrics from both services on the same dashboard.