beastcraft-telemetry
Santak IPV-2012C UPS, DS18B20 one-wire temperature, ZTE MF823 hostless modem + A5-V11 (MiFi) router and U-blox7 USB GPS monitoring with Grafana and Python on a Raspberry Pi 2 inside a motorhome.
Installation
I've built InfluxDB and Grafanates thanks to a number of existing guides.
# install InfluxDB
wget https://s3.eu-central-1.amazonaws.com/belodetech/influxdb_0.13.0~209dd00_armhf.deb
sudo dpkg -i influxdb_0.13.0~209dd00_armhf.deb
sudo service influxdb start
sudo update-rc.d influxdb defaults 95 10
Install pre-built Node.js for Raspberry Pi using the handy Adafruit guide.
# install Grafana
wget https://s3.eu-central-1.amazonaws.com/belodetech/grafana_3.0.2-1463058303_armhf.deb
sudo dpkg -i grafana_3.0.2-1463058303_armhf.deb
sudo service grafana-server start
sudo update-rc.d grafana-server defaults 95 10
Configuration
This repository contains configuration specific to my environment, with five DS18B20 sensors in total. To personalise it:
- run
pip install -r requirement.txt - update
DS18B201sensor list and database name inw1_thermy.py - create database (e.g.
grafana) for your metrics by runninginflux -execute 'CREATE DATABASE grafana;' - optionally create retention policy otherwise
default(store forever) RP applies
Temperature Dashboard

- add
w1_therm.confto/etc/supervisor/conf.d/and reloadsupervisorprocess - go to http://localhost:3000, add a new datasource and configure other options
- import
temp.jsondashboard and modify it to suit your needs or build your own from scratch (change URLs to suit your environment)
UPS/Inverter Dashboard
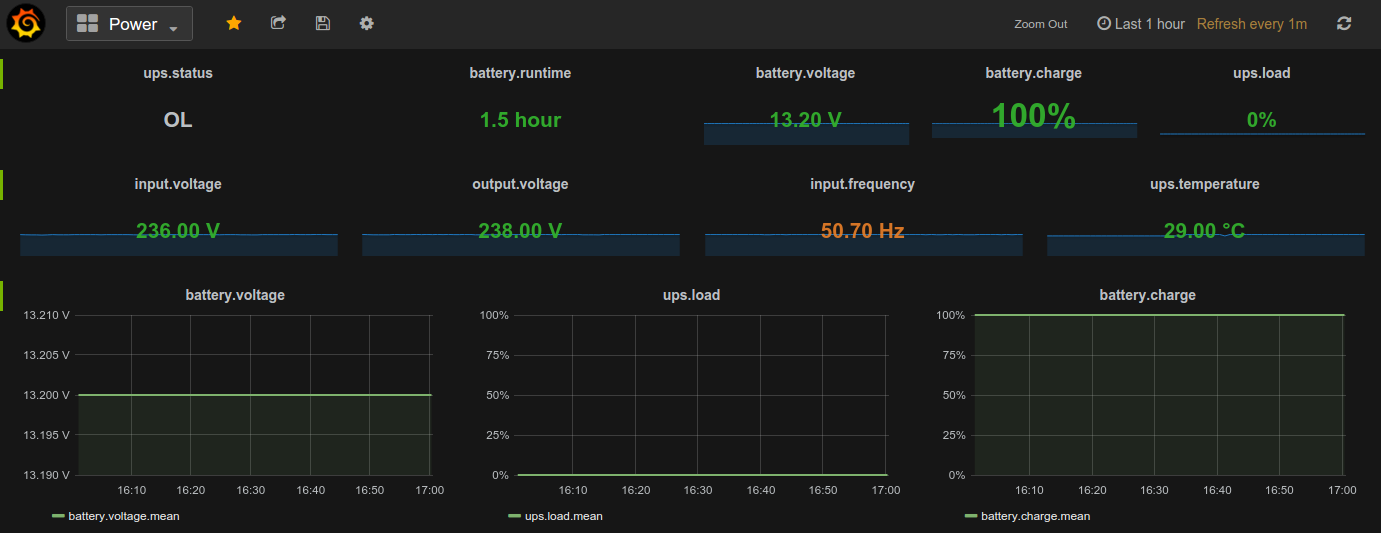
- ensure Network UPS Tools is correctly configured to work with the UPS (use
blazer_serdriver) - edit
ups.pyand adjust the defaultupsname(mine isupsoem) or pass from the command line using--upsparameter - add
ups.confto/etc/supervisor/conf.d/and reloadsupervisorprocess - import
ups.jsondashboard and modify it to suit your needs or build your own from scratch (change URLs to suit your environment)
It may be nesessary to modify UDEV rules and change the default dialout group assigned by kernel to the USB serial device to nut as follows:
printf "KERNEL==\"ttyUSB0\", GROUP=\"nut\"\n" > /etc/udev/rules.d/99_nut-serialups.rules
Traffic Dashboard
- install
sflowtoolusing this or this guide - add
traffic.confto/etc/supervisor/conf.d/and reloadsupervisorprocess - import
traffic.jsondashboard and modify it to suit your needs or build your own from scratch
Mobile Broadband Dashboard
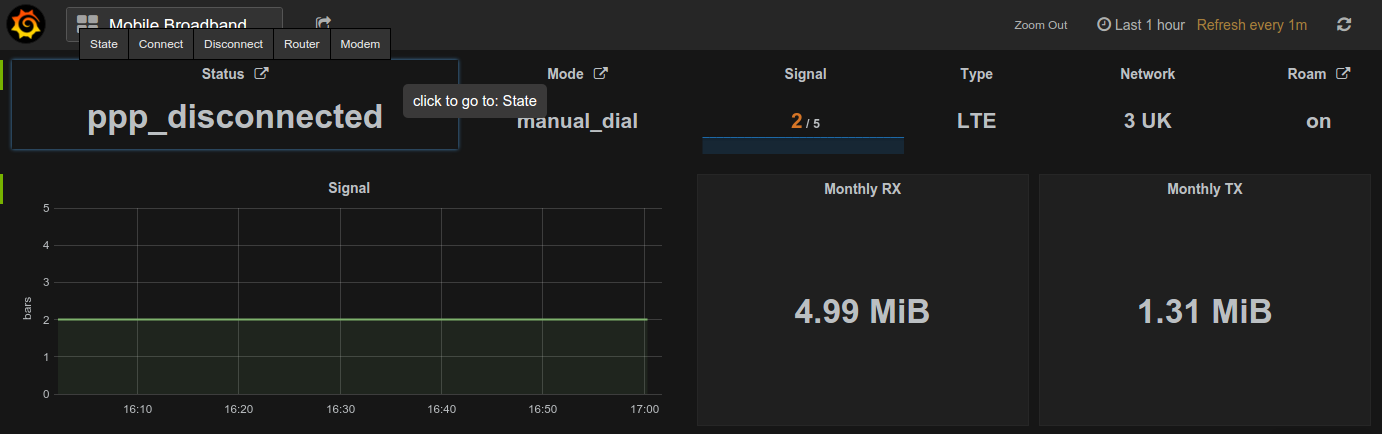
- update
hostvariable inmobilebroadband.pyto match your ZTE MF823 modem IP address - add
mobilebroadband.confto/etc/supervisor/conf.d/, change DNS details and reloadsupervisorprocess - install
nginxorCaddyserverand configure it as a reverse proxy for both Grafana and ZTE web GUIs (the later is required to set theRefererheader) - import
mobilebroadband.jsondashboard and modify it to suit your needs or build your own from scratch (change URLs to suit your environment)
pi@localhost ~ $ cat /etc/nginx/sites-enabled/grafana
server {

	listen 80;
	server_name <your_host_name>;

	location / {
		proxy_pass http://localhost:3000/;
	}

	location /public/ {
		alias /usr/share/grafana/public/;
	}

	location /goform/ {
		proxy_set_header Referer http://<your_ZTE-MF823_modem_IP>/;
		proxy_pass http://<your_ZTE-MF823_modem_IP>:80/goform/;
	}
}
The ZTE MF823 has a REST API apart from the web GUI, which we are using to communicate with the modem from within the Grafana dashboard. The full list of commands isn't published, but looking at the modem's web interface with Chrome Developer Tools, the following commands were evident.
# connect mobile network (HTTP GET)
http://<modem_IP>/goform//goform_set_cmd_process?isTest=false¬Callback=true&goformId=CONNECT_NETWORK
# disconnect mobile network (HTTP GET)
http://<modem_IP>/goform//goform_set_cmd_process?isTest=false¬Callback=true&goformId=DISCONNECT_NETWORK
# modem state (HTTP GET)
http://<modem_IP>/goform/goform_get_cmd_process?multi_data=1&isTest=false&sms_received_flag_flag=0&sts_received_flag_flag=0&cmd=modem_main_state%2Cpin_status%2Cloginfo%2Cnew_version_state%2Ccurrent_upgrade_state%2Cis_mandatory%2Csms_received_flag%2Csts_received_flag%2Csignalbar%2Cnetwork_type%2Cnetwork_provider%2Cppp_status%2CEX_SSID1%2Cex_wifi_status%2CEX_wifi_profile%2Cm_ssid_enable%2Csms_unread_num%2CRadioOff%2Csimcard_roam%2Clan_ipaddr%2Cstation_mac%2Cbattery_charging%2Cbattery_vol_percent%2Cbattery_pers%2Cspn_display_flag%2Cplmn_display_flag%2Cspn_name_data%2Cspn_b1_flag%2Cspn_b2_flag%2Crealtime_tx_bytes%2Crealtime_rx_bytes%2Crealtime_time%2Crealtime_tx_thrpt%2Crealtime_rx_thrpt%2Cmonthly_rx_bytes%2Cmonthly_tx_bytes%2Cmonthly_time%2Cdate_month%2Cdata_volume_limit_switch%2Cdata_volume_limit_size%2Cdata_volume_alert_percent%2Cdata_volume_limit_unit%2Croam_setting_option%2Cupg_roam_switch%2Chplmn
# ConnectionMode (dial mode auto|manual)
http://<modem_IP>/goform/goform_get_cmd_process?isTest=false&cmd=ConnectionMode
# enable roaming
http://<modem_IP>/goform/goform_set_cmd_process?isTest=false¬Callback=true&goformId=SET_CONNECTION_MODE&roam_setting_option=on
# disable roaming
http://<modem_IP>/goform/goform_set_cmd_process?isTest=false¬Callback=true&goformId=SET_CONNECTION_MODE&roam_setting_option=off
# enable auto-dial
http://<modem_IP>/goform/goform/goform_set_cmd_process?isTest=false¬Callback=true&goformId=SET_CONNECTION_MODE&ConnectionMode=auto_dial
# disable auto-dial
http://<modem_IP>/goform/goform/goform_set_cmd_process?isTest=false¬Callback=true&goformId=SET_CONNECTION_MODE&ConnectionMode=manual_dial
# upgrade_result
http://<modem_IP>/goform/goform_get_cmd_process?isTest=false&cmd=upgrade_result
# current_upgrade_state
http://<modem_IP>/goform/goform_get_cmd_process?isTest=false&cmd=current_upgrade_state
# sms_data_total
http://<modem_IP>/goform/goform_get_cmd_process?isTest=false&cmd=sms_data_total&page=0&data_per_page=500&mem_store=1&tags=10&order_by=order+by+id+desc
# sms_capacity_info
http://<modem_IP>/goform/goform_get_cmd_process?isTest=false&cmd=sms_capacity_info
# sms_parameter_info
http://<modem_IP>/goform/goform_get_cmd_process?isTest=false&cmd=sms_parameter_info
# pbm_init_flag
http://<modem_IP>/goform/goform_get_cmd_process?isTest=false&cmd=pbm_init_flag
# pbm_capacity_info&pbm_location=pbm_sim
http://<modem_IP>/goform/goform_get_cmd_process?isTest=false&cmd=pbm_capacity_info&pbm_location=pbm_sim
# mem__data_total
http://<modem_IP>/goform/goform_get_cmd_process?isTest=false&mem_store=2&cmd=pbm_data_total&page=0&data_per_page=2000&orderBy=name&isAsc=true
# m_ssid_enable
http://<modem_IP>/goform/goform_get_cmd_process?isTest=false&cmd=m_ssid_enable%2CSSID1%2CAuthMode%2CHideSSID%2CWPAPSK1%2CMAX_Access_num%2CEncrypType%2Cm_SSID%2Cm_AuthMode%2Cm_HideSSID%2Cm_WPAPSK1%2Cm_MAX_Access_num%2Cm_EncrypType&multi_data=1
# pbm_capacity_info&pbm_location=pbm_native
http://<modem_IP>/goform/goform_get_cmd_process?isTest=false&cmd=pbm_capacity_info&pbm_location=pbm_native
# sim_imsi
http://<modem_IP>/goform/goform_get_cmd_process?isTest=false&multi_data=1&cmd=sim_imsi%2Csim_imsi_lists
# wifi_coverage
http://<modem_IP>/goform/goform_get_cmd_process?isTest=false&cmd=wifi_coverage%2Cm_ssid_enable%2Cimei%2Cweb_version%2Cwa_inner_version%2Chardware_version%2CMAX_Access_num%2CSSID1%2Cm_SSID%2Cm_HideSSID%2Cm_MAX_Access_num%2Clan_ipaddr%2Cwan_active_band%2Cmac_address%2Cmsisdn%2CLocalDomain%2Cwan_ipaddr%2Cipv6_wan_ipaddr%2Cipv6_pdp_type%2Cpdp_type%2Cppp_status%2Csim_iccid%2Csim_imsi%2Crmcc%2Crmnc%2Crssi%2Crscp%2Clte_rsrp%2Cecio%2Clte_snr%2Cnetwork_type%2Clte_rssi%2Clac_code%2Ccell_id%2Clte_pci%2Cdns_mode%2Cprefer_dns_manual%2Cstandby_dns_manual%2Cprefer_dns_auto%2Cstandby_dns_auto%2Cipv6_dns_mode%2Cipv6_prefer_dns_manual%2Cipv6_standby_dns_manual%2Cipv6_prefer_dns_auto%2Cipv6_standby_dns_auto%2Cmodel_name&multi_data=1
# current_network_mode
http://<modem_IP>/goform/goform_get_cmd_process?isTest=false&cmd=current_network_mode%2Cm_netselect_save%2Cnet_select_mode%2Cm_netselect_contents%2Cnet_select%2Cppp_status%2Cmodem_main_state%2Clte_band_lock%2Cwcdma_band_lock&multi_data=1
# APN_config0
http://<modem_IP>/goform/goform_get_cmd_process?isTest=false&cmd=APN_config0%2CAPN_config1%2CAPN_config2%2CAPN_config3%2CAPN_config4%2CAPN_config5%2CAPN_config6%2CAPN_config7%2CAPN_config8%2CAPN_config9%2CAPN_config10%2CAPN_config11%2CAPN_config12%2CAPN_config13%2CAPN_config14%2CAPN_config15%2CAPN_config16%2CAPN_config17%2CAPN_config18%2CAPN_config19%2Cipv6_APN_config0%2Cipv6_APN_config1%2Cipv6_APN_config2%2Cipv6_APN_config3%2Cipv6_APN_config4%2Cipv6_APN_config5%2Cipv6_APN_config6%2Cipv6_APN_config7%2Cipv6_APN_config8%2Cipv6_APN_config9%2Cipv6_APN_config10%2Cipv6_APN_config11%2Cipv6_APN_config12%2Cipv6_APN_config13%2Cipv6_APN_config14%2Cipv6_APN_config15%2Cipv6_APN_config16%2Cipv6_APN_config17%2Cipv6_APN_config18%2Cipv6_APN_config19%2Cm_profile_name%2Cprofile_name%2Cwan_dial%2Capn_select%2Cpdp_type%2Cpdp_select%2Cpdp_addr%2Cindex%2CCurrent_index%2Capn_auto_config%2Cipv6_apn_auto_config%2Capn_mode%2Cwan_apn%2Cppp_auth_mode%2Cppp_username%2Cppp_passwd%2Cdns_mode%2Cprefer_dns_manual%2Cstandby_dns_manual%2Cipv6_wan_apn%2Cipv6_pdp_type%2Cipv6_ppp_auth_mode%2Cipv6_ppp_username%2Cipv6_ppp_passwd%2Cipv6_dns_mode%2Cipv6_prefer_dns_manual%2Cipv6_standby_dns_manual&multi_data=1
# lan_ipaddr
http://<modem_IP>/goform/goform_get_cmd_process?isTest=false&cmd=lan_ipaddr%2Clan_netmask%2Cmac_address%2CdhcpEnabled%2CdhcpStart%2CdhcpEnd%2CdhcpLease_hour&multi_data=1
# DMZEnable
http://<modem_IP>/goform/goform_get_cmd_process?isTest=false&cmd=DMZEnable%2CDMZIPAddress&multi_data=1
# PortMapEnable
http://<modem_IP>/goform/goform_get_cmd_process?isTest=false&cmd=PortMapEnable%2CPortMapRules_0%2CPortMapRules_1%2CPortMapRules_2%2CPortMapRules_3%2CPortMapRules_4%2CPortMapRules_5%2CPortMapRules_6%2CPortMapRules_7%2CPortMapRules_8%2CPortMapRules_9&multi_data=1
# IPPortFilterEnable
http://<modem_IP>/goform/goform_get_cmd_process?isTest=false&cmd=IPPortFilterEnable%2CDefaultFirewallPolicy%2CIPPortFilterRules_0%2CIPPortFilterRules_1%2CIPPortFilterRules_2%2CIPPortFilterRules_3%2CIPPortFilterRules_4%2CIPPortFilterRules_5%2CIPPortFilterRules_6%2CIPPortFilterRules_7%2CIPPortFilterRules_8%2CIPPortFilterRules_9%2CIPPortFilterRulesv6_0%2CIPPortFilterRulesv6_1%2CIPPortFilterRulesv6_2%2CIPPortFilterRulesv6_3%2CIPPortFilterRulesv6_4%2CIPPortFilterRulesv6_5%2CIPPortFilterRulesv6_6%2CIPPortFilterRulesv6_7%2CIPPortFilterRulesv6_8%2CIPPortFilterRulesv6_9&multi_data=1
All the API requests require the Referer: http://<your_ZTE-MF823_modem_IP>/ request header present. No additional headers are required.
Satellite Internet Dashboard
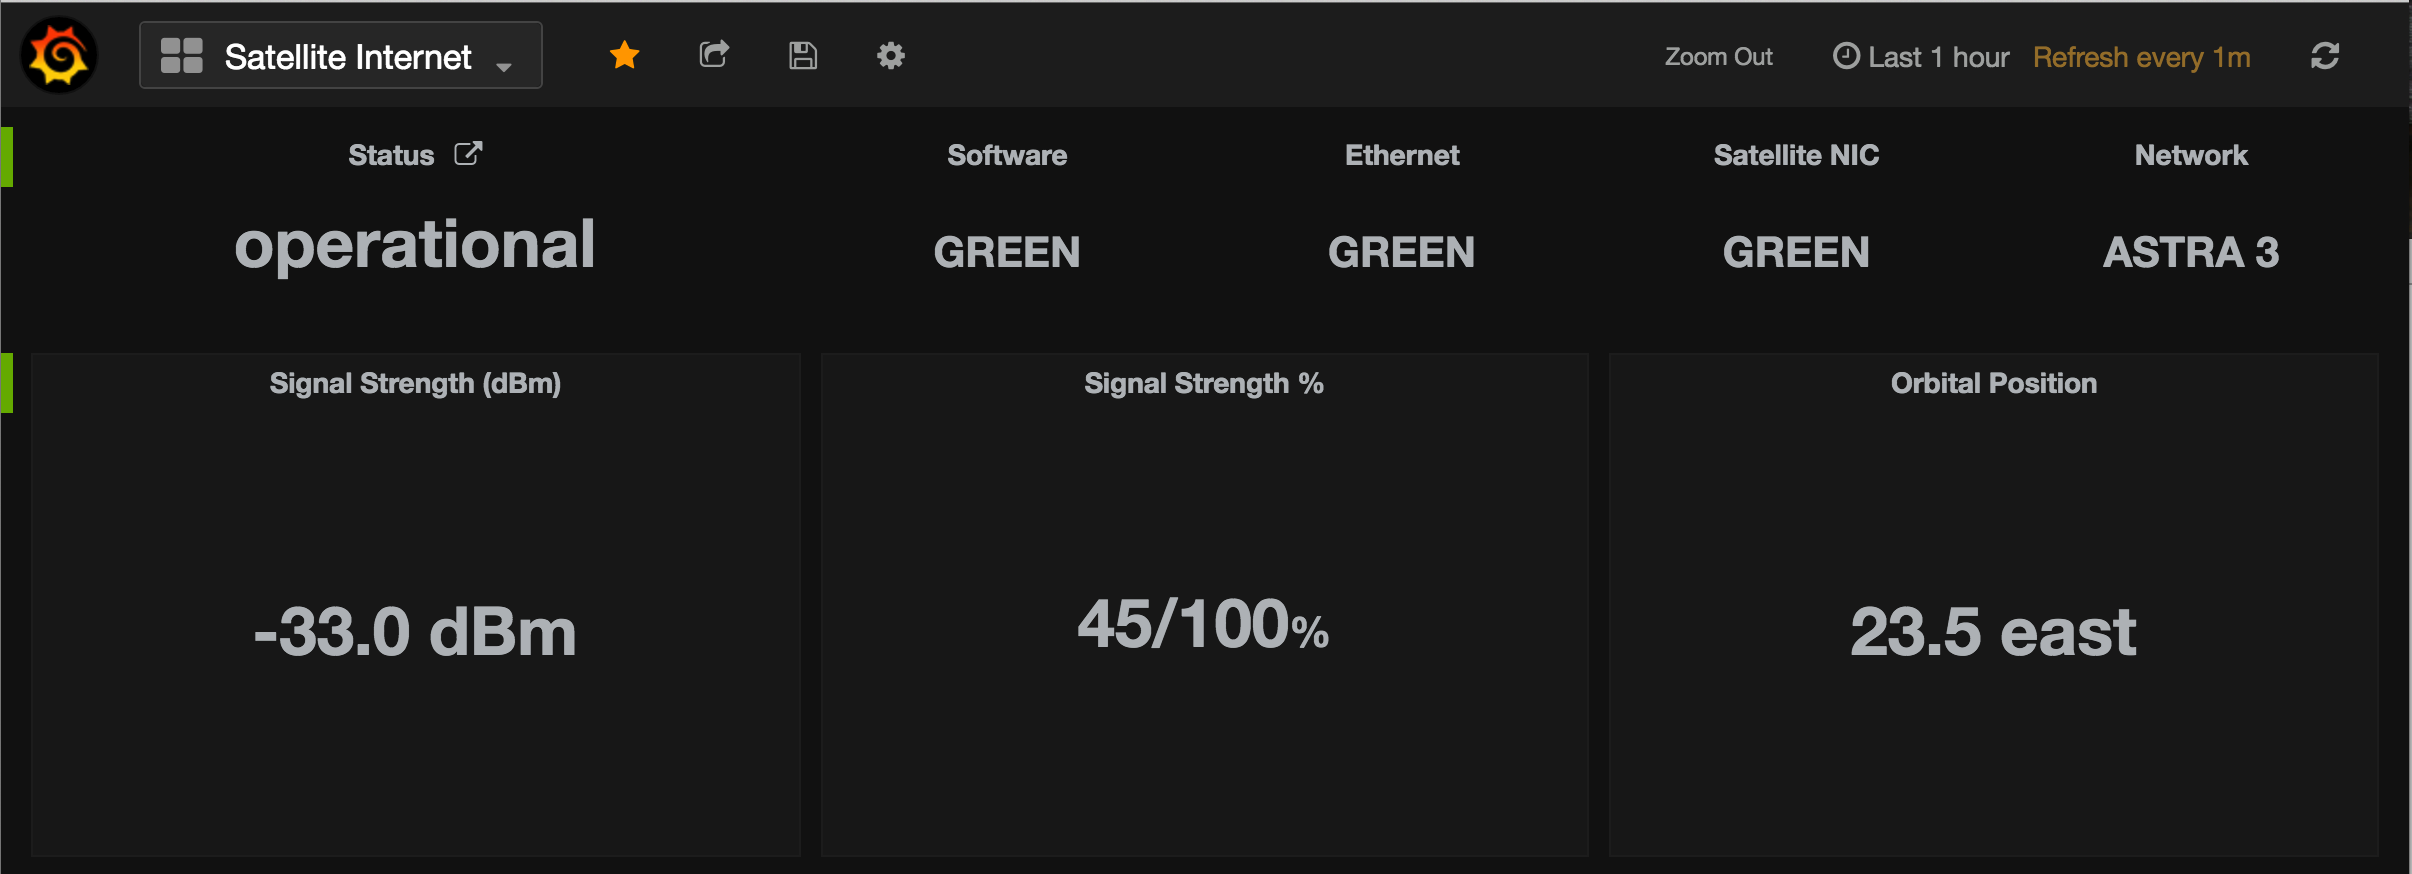
- update
hostvariable insatinternet.pyto match the Newtec S3P (NTC2252) modem ipaddr - add
satinternet.confto/etc/supervisor/conf.d/and reloadsupervisorprocess - install
nginxorCaddyserverand configure it as a reverse proxy for Newtec Sat3Play web GUI - import
satinternet.jsondashboard and modify it to suit your needs or build your own from scratch (change URLs to suit your environment)
GPS Dashboard
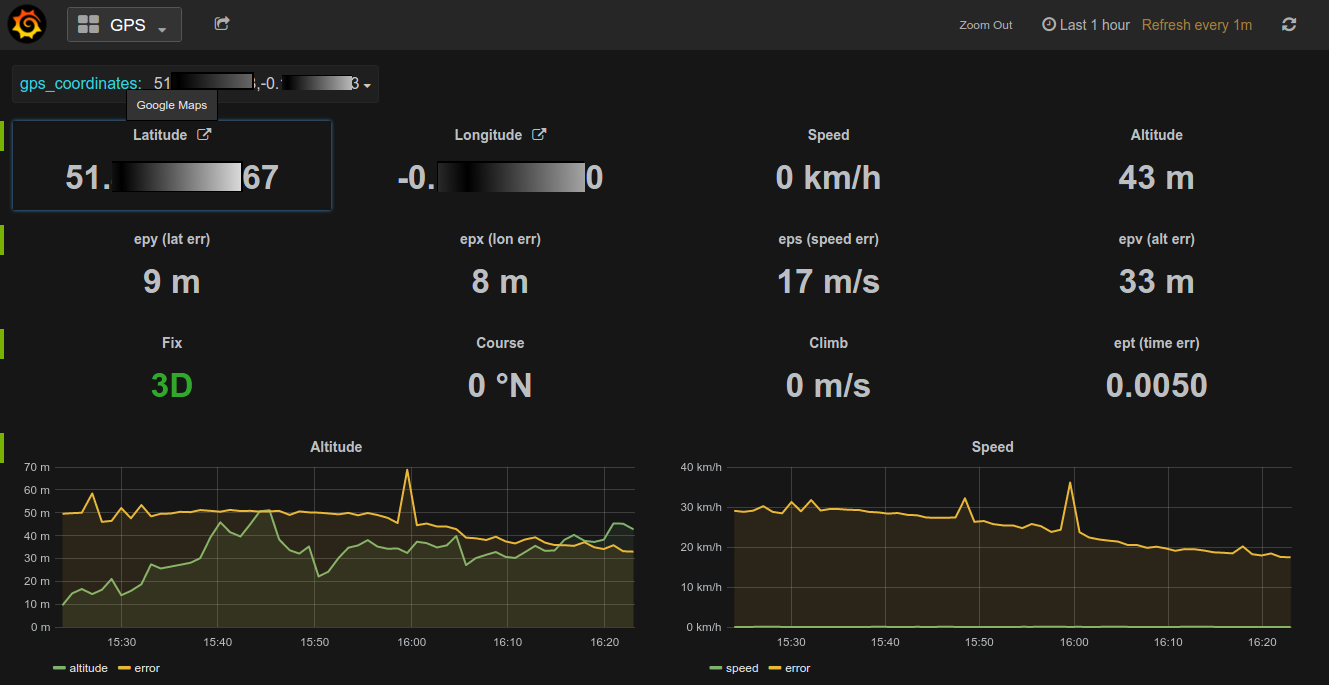
- install
gpsd(docs) using this or this guide or better still, install latest from source. - add
geo.confto/etc/supervisor/conf.d/and reloadsupervisorprocess - import
gps.jsondashboard and modify it to suit your needs or build your own from scratch
To synchronise time using GPS receiver and NTP using SHared Memory driver (type 28), read the following concise article Connecting u-blox NEO-6M GPS to Raspberry Pi. I had a lot of problems with the GPSd v3.06 in the Raspbian Wheezy repository, so I upgraded to Jessie, built GPSd v3.16 from source and installed systemd services. The /etc/default/gpsd file looks like this:
# Default settings for gpsd.
START_DAEMON="true"
GPSD_OPTIONS="-n"
DEVICES="/dev/ttyACM0"
USBAUTO="true"
GPSD_SOCKET="/var/run/gpsd.sock"
Usign type 28 (SHM), ntp.conf looks like this:
# using SHaredMemory (SHM) driver
server 127.127.28.0 minpoll 4 maxpoll 4 iburst prefer
fudge 127.127.28.0 time1 +0.080 flag1 1 refid GPSD stratum 1
I've also tried using driver type 20 for NTP, however I couldn't get NTP and GPSD to play together nicely in the mode, so I reverted to SHM. With type 20 ntp.conf looks like this:
# GPS receiver time source via /dev/gsp0, no SHaredMemory (SHM) driver
server 127.127.20.0 mode 16 minpoll 4 maxpoll 4 prefer # set /dev/gps0 9600 baud
fudge 127.127.20.0 flag1 0 # disable PPS as it isn't present with cheap USB GPS(s)
The /etc/udev/rules.d/99-gpsd.rules makes sure the device has the right permissions and the symbolic link persists on restart:
KERNEL=="ttyACM[0-9]*", GROUP="dialout", MODE="0666"
KERNEL=="ttyACM0", SYMLINK+="gps0"
To reload udev rules without rebooting, run sudo udevadm control --reload-rules.
Checking time sync. results:
# ntpq -p
     remote           refid      st t when poll reach   delay   offset  jitter
==============================================================================
*SHM(0)          .GPSD.           1 l    3   16  377    0.000   -1.577   1.830
My time seems to be off by about 80ms, which I correct with time1 +0.080 option. The resulting accuracy means the clock is off by less than +/- 10ms, which is good enough for my purposes of keeping the time roughly in sync with the world.
# ntpdate -d 0.europe.pool.ntp.org
...
delay 0.07957, dispersion 0.00102
offset -0.004779

19 May 10:23:48 ntpdate[2993]: adjust time server 85.25.197.197 offset -0.004779 sec
To set initial datetime from GSP, add the following to /etc/rc.local to run once per boot:
# set initial datetime from GPS
influx -database beastcraft \
  --format csv \
  -execute 'SELECT last("value") FROM "time";' | \
  tail -1 | awk -F',' '{print $3}' | \
  xargs date +%Y-%m-%dT%H:%M:%S.000Z -s
FortiWifi Interface Monitor
A FortiWifi firewall can be configured as a wireless bridge as follows[n1]:
config system global
    set wireless-mode client
end
A side effect of doing this, is that the resulting wifi internal interface is always up, regardless of whether or not it is connected to the upstream wireless network. This means that if a backup interface is to be used (e.g. Mobile Broadband), the wifi interface default route will never be released and the backup one will never kick in. A less elegant solution is to use FortiOS link-monitor function in conjunction with a custom script running somewhere nearby to manipulate network routes depending on interface availability.
For example, if a wifi interface is used as a primary network link and a wan2 interface is used for backup, the following link-monitor configuration is set on the device:
config system link-monitor
    edit "wan2"
        set srcintf "wan2"
        set server "8.8.8.8" "8.8.4.4"
    next
    edit "wifi"
        set srcintf "wifi"
        set server "8.8.8.8" "8.8.4.4"
    next
end
Status check is performed for running diag sys link-monitor status wifi command and inspecting the output:
Link Monitor: wifi Status: alive Create time: Fri Mar 18 14:55:41 2016
Source interface: wifi (18)
Interval: 5, Timeout 1
Fail times: 0/5
Send times: 0
  Peer: 8.8.4.4(8.8.4.4)
        Source IP(172.16.99.11)
        Route: 172.16.99.11->8.8.4.4/32, gwy(172.16.99.254)
    protocol: ping, state: alive
              Latency(recent/average): 20.55/23.82 ms Jitter: 267.41
              Recovery times(0/5)
              Continuous sending times after the first recovery time 0
              Packet sent: 172173  Packet received: 167884
  Peer: 8.8.8.8(8.8.8.8)
        Source IP(172.16.99.11)
        Route: 172.16.99.11->8.8.8.8/32, gwy(172.16.99.254)
    protocol: ping, state: alive
              Latency(recent/average): 20.41/29.20 ms Jitter: 266.55
              Recovery times(1/5)
              Continuous sending times after the first recovery time 1
              Packet sent: 172161  Packet received: 169386
To automate this, I've written a simple Python script, which can be run on a nearby Linux host, to poll the firewall every few seconds and check the interface status. Should the primary interface go down, the script modifies the default route to send traffic to the backup interface:
usage: monitor.py [-h] --host HOST [--port PORT] [--user USER] --iface IFACE
                  --backup BACKUP --gwip GWIP

FortiGate interface monitor

optional arguments:
  -h, --help       show this help message and exit
  --host HOST      FortiGate appliance hostname or IP
  --port PORT      SSH port of the FortiGate appliance
  --user USER      FortiGate admin username
  --iface IFACE    FortiGate interface to monitor (e.g. wifi)
  --backup BACKUP  FortiGate interface to fail-over to (e.g. wan2)
  --gwip GWIP      Backup interface gateway ipaddr
