ashishsingal1 / Betalyzer
Labels
Projects that are alternatives of or similar to Betalyzer
Betalyzer: A Full Stack Fintech Application
Betalyzer is a web application that I’ve cobbled together using various new, open source technologies that make building and deploying a fintech project easy but powerful.
Betalyzer calculates the betas of top stocks trading on the NASDAQ exchange. It displays these stocks and their betas in a table, with pages for each stock that contains details and charts.
However, the purpose of this app is more illustrative than functional -- it serves as a guide to those who want to quickly get started with financial technology. Also note that the data is frozen point in time when I created this (in Jan 2017).
To access Betalyzer, head over to betalyzer.co.
Table of Contents
- Functionality: Overview of the summary page and ticker page.
- Architecture: Technologies we use and our file structure.
- Data & Calculations: The code for pulling in the data and performing calculations.
- Web & Frontend: Displaying the calculations in a friendly user interface.
- REST API & Excel: Pulling data programmatically or through Excel.
- Analyzing the Results: Interpreting and drawing conclusions from our dashboard.
Functionality
Betalyzer consists of two templates --
- The summary page, which contains information about all stocks
- A ticker page, which contains information about a specific ticker
Summary Page
This is the main landing page when a user visits the app. It includes the header, some charts on the overall market, and a table showing all the tickers.
Header
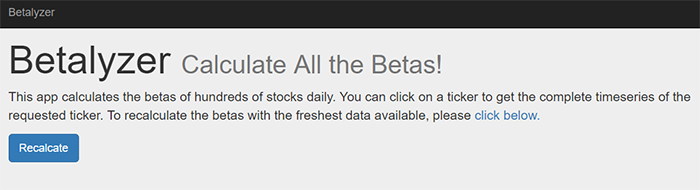
After our header and short intro, the Recalculation button allows us to refresh and recalculate the data.
Charts
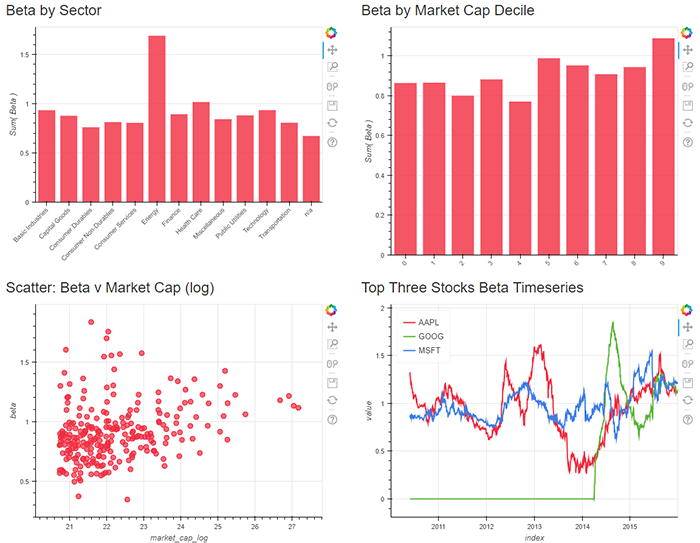
The charts show various views on beta and the market, including:
- Beta by Sector: Bar chart of the average beta by industry sector.
- Beta by Market Cap Decile: Bar chart of the average beta by market cap decile.
- Scatter: Beta v Market Cap: A scatter plot of the top 100 stocks by beta and the log of market cap.
- Top Three Stocks Beta Timeseries: Plots historical beta for the top three stocks by market cap.
All Tickers
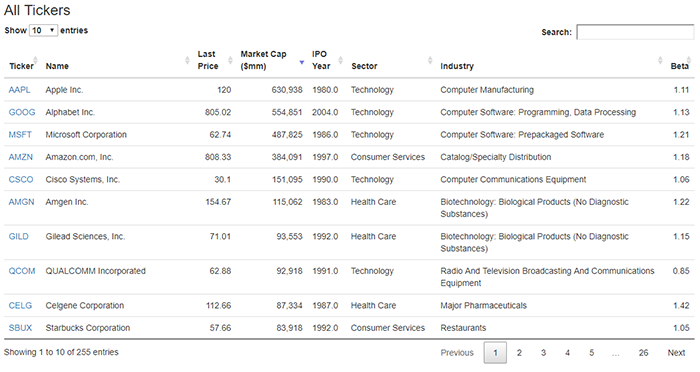
The ticker table displays the list of all tickers in the database as well as key metrics and information for each company.
Ticker Page
The ticker page, for example for AAPL, shows information related to a particular company.
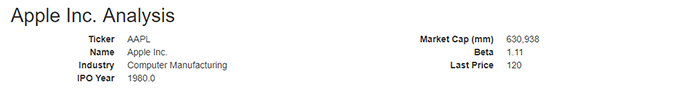
This reference data is the same as what is displayed on the All Tickers table above.
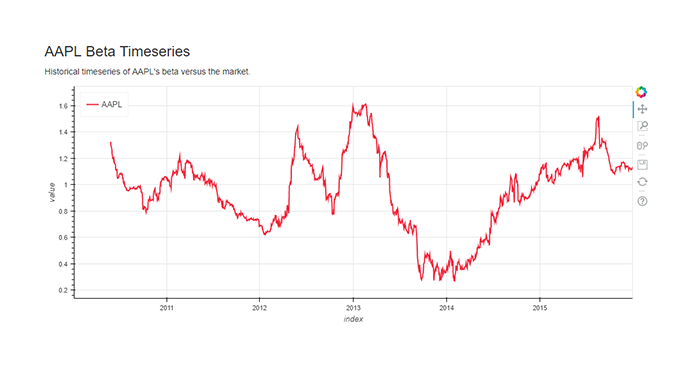
Three charts follow ..
- Beta Timeseries: A historical timeseries of the ticker's beta versus the market.
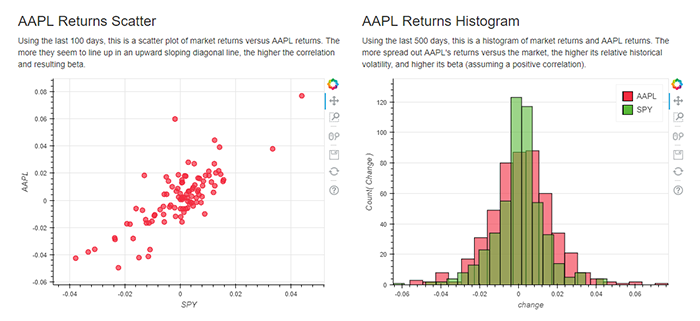
- Returns Scatter: Using the last 100 days, this is a scatter plot of market returns versus the ticker's returns.
- Returns Histogram: Using the last 500 days, this is a histogram of market returns and ticker's returns.
Architecture
Technologies
Betalyzer makes use of many technologies, tools and services, primarily from the scientific Python libraries, but also others for specific purposes, such as data ingestion and web front end. Here's a brief overview of some of the key components --
- Anaconda: A scientific Python distribution that comes with many packages required here. Used for installing Python and related packages all at once.
- pandas (Python): Powerful data analysis package modeled after R. Used for data manipulation and calculations.
- Bokeh (Python): Relatively new charting package that plays well with the rest of our stack while displaying results in JS. Used for charting on the front end.
- Flask (Python): Lightweight Python web framework that lets us get up and running quickly.
- Jupyter Notebook: A great research environment used for scripting and visualization. Used for prototyping code as well as experimenting with different calculation methods.
- Quandl: A repository for financial data with an easy to use API. Used as a data source.
- Bootstrap: A front end CSS package with easy to use components.
- Datatables: A very cool JS component that makes displaying tabular data on the web a breeze.
- Github: A Git repository with many open sourced projects.
- PyCharm: A fantastic Python IDE. Used during development.
Note that we don’t actually use a database in the whole project. Instead, we use pandas DataFrames stored as pickles. However, Postgres or even SQLite would suffice as a data store if some scalability is needed.
Workflow
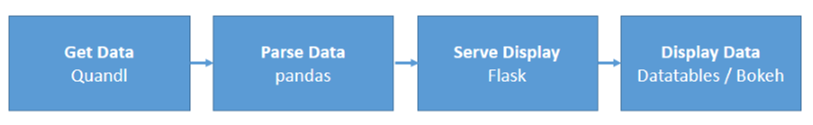
- Get Data: We grab data from a couple sources, including prices from Quandl and reference data from NASDAQ.
- Parse Data: We parse the data, doing a bit of cleaning and then doing the calculations, primarily using pandas.
- Serve Display: We use Flask to serve the correct HTML, CSS and Javascript to the user.
- Display Data: Finally, we display the data using front end libraries like Bokeh, Bootstrap and Datatables.
File Structure
- /app.py: The Flask application.
- /betalyzer.py: The back end code for data and calculations.
-
/templates/: Contains the HTML for the view layer.
- index.html: Empty parent HTML template.
- main.html: Main landing HTML.
- ticker.html: Single ticker HTML.
-
/data/: Contains the pickled DataFrames that store the relevant data.
- df_betas.pkl: Timeseries of the betas for each ticker across history.
- df_changes.pkl: Timeseries of the price changes in percentage for each ticker across history.
- df_tickers.pkl: Reference data for the tickers, including company name, sector, etc.
-
/nb/: Contains the Jupyter Notebooks that are helpful for reference.
- beta-calc-optimizations.ipynb: Details about performant beta calculations using several methodologies.
- betalyzer.ipynb: Details about the project including answers to several common questions.
Data & Calculations
Pulling Data
The first order of business is getting the data that we need. At the end of this process, we want to have two DataFrames -- one with the reference data from Nasdaq and one with price changes computed from Quandl data. The steps and code are below:
- recalculate: First, the recalculate function is called, which takes care of both pulling the data and doing the calculations.
- read_nasdaq: We grab the data from the Nasdaq website, where the endpoint is stored in nasdaq_url. We rename the columns, and filter the tickers to include only stocks that IPOed before 2010 (so we have enough history) and with a market cap above $1bn.
- read_market: This separately gets the index fund that we use (SPY), which is sourced from a different dataset than single stock tickers because of certain data issues.
- Choosing tickers: We choose which tickers we want to keep using our settings found at the top of the file.
-
build_quandl: This is the meat of the code that injests price history. A
tryblock wraps the ping to pull data, in case the data does not exist. We keep theAdj. Closecolumn and calculate thepct_changeusing a convenient built inpandasfunction. - Data cleaning: We do a bit of data cleaning -- using our reference ticker, we generate a daily schedule. We also handle missing values as specified in our settings.
We now have a cleaned pandas DataFrame that we can use to do the beta calculations.
Beta Calculations
The code for the beta calculations is simple --
In build_betas, we use pandas' rolling functionality to calculate covariances and variances, and the div function to complete the calculation.
For a detailed look into calculation optimization, take a look at the beta-calc-optimizations notebook. This notebook explores three approaches (a) numpy (cov), (b) numpy (least squares) and (c) pandas rolling. The pandas function is much more highly optimized and runs all calculations in under 6 seconds, versus hours using methods (a) or (b).
Finalizing Output
After the betas are calculated, we do a few final steps --
- Build tickers: We build a tickers DataFrame with current information, including the latest beta calculated, and only select the tickers and columns that we need to display.
- Transformations: We do a couple of transformations on market cap data for both viewability as well as charting.
- Pickles: Finally, we save down the pickles to the file system so that they can be persisted.
Web & Front End
We now have built both the data layer as well as the calculation / quantitative layer, so we can focus on building the user interface.
Flask App Routes
We use Flask, a lightweight Python web framework, to serve the app. A couple of lines at the end of the file runs the app on the in built Flask web server. Should we need scale, we'd probably integrate a server like nginx.
We have three routes total -- two that correspond to the web front end, and a final one for the API.
- main: This route converts df_tickers to a dictionary as well as draws the main page charts.
- ticker: This route gathers the relevant dictionary for the single ticker and draws the ticker's charts.
- api: The code for this is discussed in the REST API section.
Templates
We have three templates -- one master template and two child templates that correspond to our two pages:
- index.html: This contains the empty HTML template, including style sheets, Javascript includes, HTML menus, etc.
- main.html: This contains the main page charts as well as the data table.
- ticker.html: This contains ticker details and charts.
Front End Components
- Bootstrap: Bootstrap is included in index.html and elements are used throughout that file and the other two templates.
- Datatables.net: Included in the main page to display all tickers.
- Charting with Bokeh: Included both the main page and the ticker page to display our charts.
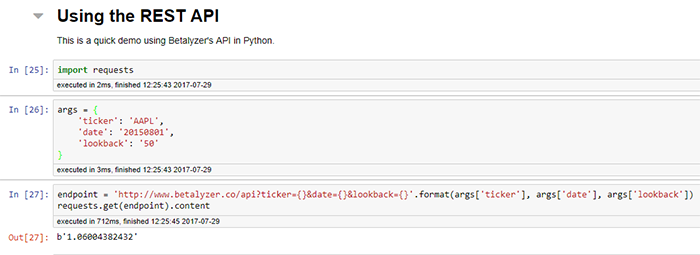
REST API & Excel
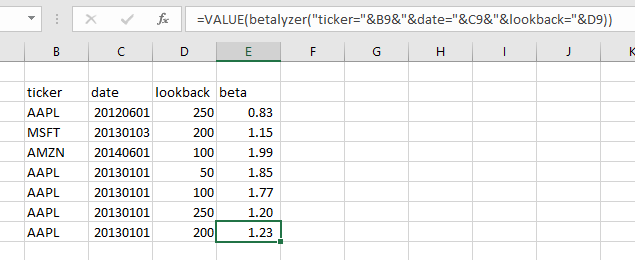
We make a REST API available for users that need to get the data programmatically. The code defines a Flask route and takes in the URL parameters of ticker, date and lookback. All are required.
We can take a look at how using this API may look in this Jupyter Notebook.
We can also check out the fully functional Excel Add In and the accompanying VBA code.
Analyzing the Results
Now that we have a fully functional app, let's dig into how to analyze the results and how we may use this.
Beta
First, let's do a quick background on what beta is and how it may be used in the investment context. Beta is a concept within the Capital Asset Pricing Model (CAPM) and represents the movement of a stock related to the market move. An interpretation of beta is for every 1% move of the index (in our case, SPY), we expect our stock to move by its beta.
Therefore, higher betas mean a stock is more sensitive to the market, while lower betas mean it is less sensitive.
The formula for calculating beta is the covariance of the market (rb) and the stock (ra) divided by the market variance:

This breaks down into the correlation of the stock and the market multiplied by the relative standard deviations.

Since the market standard deviation is the same for all stocks, there are two main factors that impact the beta of an individual stock:
- Correlation: Correlation measures what amount of a stock's movement can be explained by the market index. The maximum value it can have is 1 -- if a stock's entire movement is explained by the index.
- Volatility: This measures the magnititude of the daily historical movement of a stock, whether or not this is related to the market or independent factors.
The higher the correlation and the higher the volatility, the higher the beta for a stock.
Market Overview
The charts on the front page give us some insights into the characteristics of the beta distribution.
- Beta by Sector: The energy sector has, at this point in time, the largest beta of any sector. Between volatility and correlation, it is likely that this sector is experiencing higher volatility (versus higher market correlation) related to raw commodity price swings during this period.
- Beta by Market Cap: Beta seems to be higher for larger stocks than smaller stocks. This could be due to indexing and a higher correlation to the market than smaller stocks -- as it is likely that smaller stocks are more volatile than larger ones.
That's All!
If you've got any comments or suggestions, drop me a message on LinkedIn or feel free to submit pull requests or issues on this Github repo.