boba-visualizer
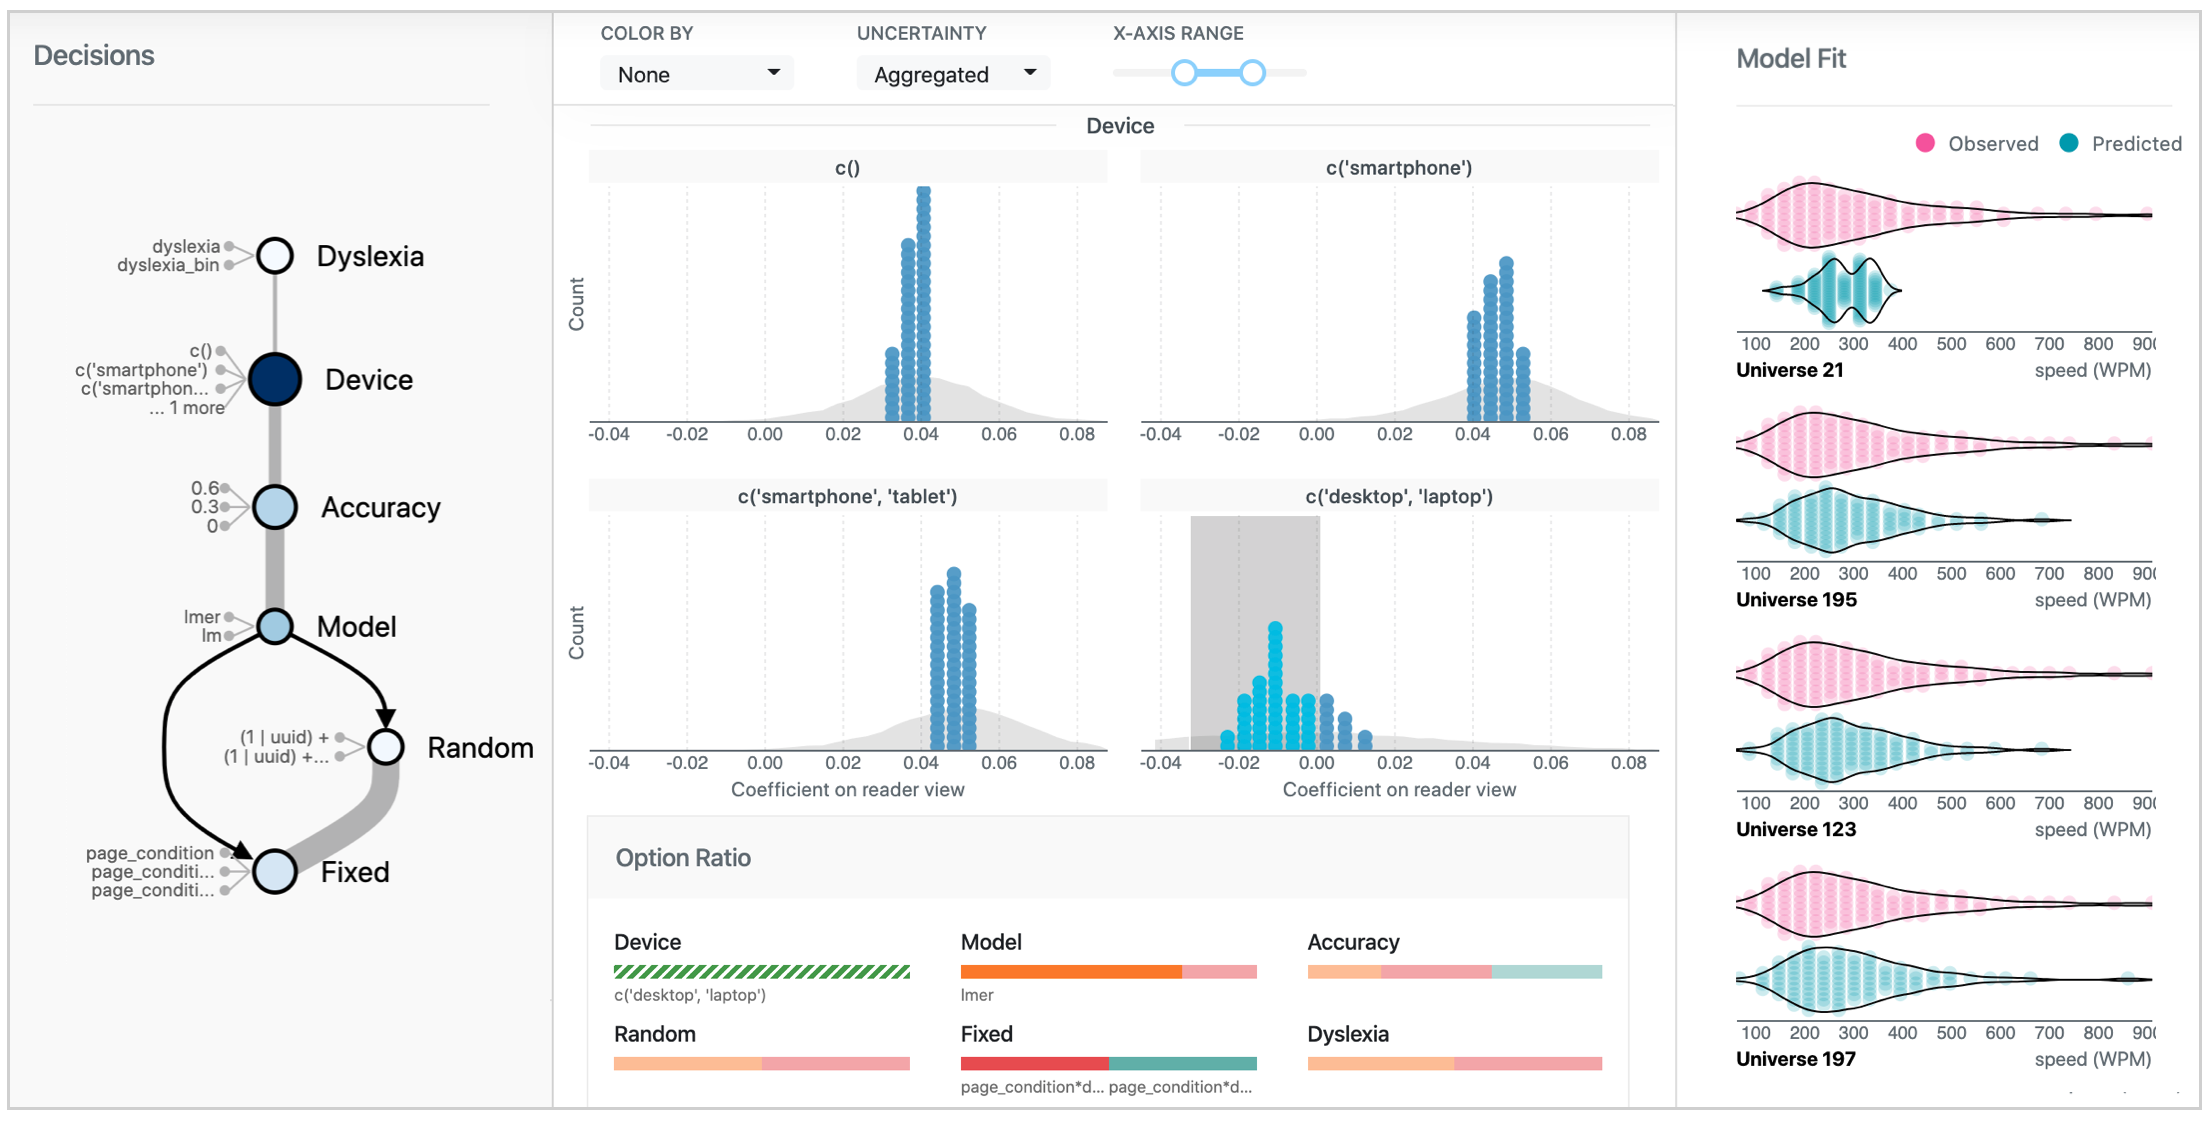
The Boba Visualizer is a visual analysis interface for exploring multiverse outcomes. It helps users explore how analytic decisions impact statistical estimates, inferential uncertainty, and model fit. Watch the visualizer in action in this video.
Installation
You might download and install the latest version of this software from the Python package index (PyPI):
pip install --upgrade boba-visualizer
Usage
To start the visualizer, use the following command:
boba-server -i /path/to/file
You will need to supply your own file path, which contains your multiverse outcomes and accompanying meta data. Learn more about the appropriate file format here. This repository also include an example folder with the outcomes from the mortgage multiverse. You could explore the example by cloning this repo and:
boba-server -i ./example/mortgage
After running the above command in your console, open your browser and navigate to http://127.0.0.1:8080/ to start the user interface.
You might also use a configuration file to control various aspects of the visualizer, and use CLI options to change the behavior of the server.