btcdmon
####A drop-in monitoring solution for your partial view of the Bitcoin P2P network!
##What is this?
btcdmon is a drop-in, dockerzied monitoring/metric-collection solution for individual nodes within the Bitcoin distributed system. With this system, you'll be able to closely monitor the health, status, and behavioral patterns of your btcd node(s) and subsequently the Bitcoin network as a whole.
btcdmon only supports btcd: an alternative full node bitcoin implementation written in Go written, and maintained by conformal. If you're looking for a similar system, but for a Bitcoin Core node instead, then you should check out statoshi. Although, btcdmon differs from statoshi in many ways.
There are three primary components of the btcdmon system:
- A modified btcd node, maintained by myself for exporting all those juicy metrics. The fork adds an additional pure-go dependancy for exporting metrics over UDP to our backend for storage. The metrics exported are those which I found interesting at the time, and can easily be expanded to your tastes by forking by fork.
- Influxdb, a pure-go an open-source distributed time series database. InfluxDB serves as our backend, housing our stored metrics, responding to SQL-like queries over our time series data, and providing a client interface for exporting metrics via UDP from our btcd node. InfluxDB is horizonatally scalable; capable of dynamically expanding by clustering several nodes together providing automatic sharding and replication. InfluxDB uses the raft consensus algorithm for well, obtaining and maintaining consensus between nodes within the cluster. InfluxDB also provides several options for storage backends including: LevelDB, RocksDB, LMDB, HyperlevelDB. Currently the default configuration of
btcdmonconsists of only a singular node and uses LevelDB as a storage backend. These parameters may easily be changed. - And last but not least, our frontend! What good is all that beautiful data if we can't visualize, tinker, and poke it from all angles?
btcdmonuses Grafana for its primary dashboard to display all its collected metrics. Grafana is highly configurable and creates some truly beautiful graphs. Grafana is served by an nginx instance. InfluxDB also provides a native admin dashboard which is also served by nginx.
##Why would I want to use this?
SSHing into your box and refreshing your node's logs or poking it with getinfo commands is rather, uh boring! And also, because data. Monitoring can provide crucial insights to the health large-scale distributed systems. Without monitoring systems like btcdmon, the only view into the health of Bitcoin nodes and the network as a whole are fragmented logs. Logs can be invaluable for debugging scenarios but are rather opaque and don't provide a clear view of what's going on under the hood. By exporting and graphing interesting metrics, one can get a real-time transparent view of the behavior of your Bitcoin node(s) and the network. It's also pretty cool to see your node carry out intergral network services in real-time. Such as serving blocks to a fresh syncing node, validating new blocks, and slinging out merkle blocks to SPV nodes.
##How do I install this?
- Installation instructions assume you already have
dockerinstalled. If this is not the case, then check out the official installation docs so you can getdockerup and running on your machine.
- First up, our modified btcd node. You can find the repository here under the branch
btcdmon(if it isn't stil the default branch).- Grab the repo
$ git clone https://github.com/Roasbeef/btcd$ cd btcd
- Next up, installing the node. You can either install the node as a docker application (via the provided dockerfile or directly unto the host system.
- Docker:
$ docker build --rm -t="give_it_a_name" . - Raw installation:
$ go build- Notice we don't simply
go get ...to install the node. This is becausego getdefaults to grabbing the master branch, whereas we are interested in a certain branch.
- Notice we don't simply
- Docker:
- Once installed you'll need to add some additional parameters to the
btcd.conffile in order to get your node up and running:btcdmonuser, btcdmonhost, and btcdmonpass.btcdmonuserandbtcdmonpassare the credentials we need to access the InfluxDB api to export our metrics, you'll choose them shortly below.btcdmonhostis the hostname or IP of the machine you'd like to run the backend on.
- Grab the repo
- Second, you'll need to fill in some configuration parameters for InfluxDB. Within the
influxdb/folder edit theDockerfile, and change theINFLUXDB_ROOT_PASSWORDandINFLUXDB_DEFAULT_DB_PASSWORDenvironment variables. The user name isbtcdby default and our time-series databse is namedbtcdmon. - Next, we'll build our frontend and backend. This is made ridiculously easy via
docker.- These commands should be run from the top-level of this repo.
- Build the backend:
$ docker build -t="btcdmon-influxdb" influxb
- Build the frontend:
$ docker build -t="btcdmon-nginx" nginx-grafana
##How do I run this? Running, linking, and managing the system is simple due its dockerization.
- First, we'll get the backend up and running:
$docker run -d --name influxdb -v /home/influxdb/data:/data -p 4444:4444/udp btcdmon-influxdb- If it doesn't start up intially, there might be something wrong with your configuration. You can start up the container in interactive mode by passing
-i -tfor arguments instead of-dto aide with debugging.
- Next, lets fire up our frontend:
$ docker run -d --name nginx -p 80:80 -p 443 --link influxdb:influxdb btcdmon-nginx- With the
--linkflag and arguments docker handles some network configuration magically for us, so the nginx container knows where to reach the influxdb container at.
- Finally, you'll need to start up your btcdmon btcd node:
- If you did a direct installation on another machine,
$ ./btcdwill do. - If you installed the btcd fork inside a container then this command should do the trick (handling some port mapping along the way):
$ docker run -p 8333:8333 -d -v /root/.btcd/:/root/.btcd/ -v /root/.btcctl/:/root/.btcctl/ --name btcd roasbeef/btcd --externalip <your_external_ip_address>
- If you did a direct installation on another machine,
Once NGINX turns up, you'll be able to access the main Grafana dashboard by pointing your browser to your frontend/backend box.
InfluxDB ships with a admin interface that's defaultly configured to be available at the sub-domain admin.*. You'll need to set up your DNS records accordingly or change the nginx.conf to proxy from /admin or something like that, if you'd prefer a different access point. The admin interface allows one to manage add/drop time series, create precomputed continous queries, and as a play ground to examine the data.
##Querying
InfluxDB provides a rather cool SQL-like language for querying stored time-series data. Data is grouped into individual time-series(s), you can think if these like SQL tables. These tables are schemaless allowing you to drop/add columns at will without any overhead.
btcdmon exports the following time-series by default:
bandwidth- Columns:
bytes_sent,bytes_recv
- Columns:
blocks- Columns:
size,num_tx,best_height
- Columns:
mempool- Columns:
num_tx,num_orphans,size,double_spend,tx_rate_limit
- Columns:
msg_recv- Columns: All possible incoming P2P messages.
msg_sent- Columns: All possible outgoing P2P messages.
peers- Columns:
total_connected,outbound,version,user_agent,num_addrs,spv,inbound,fullnode
- Columns:
processed_blocks- Columns:
height,process_time,status,size,num_tx,sha,is_orphan
- Columns:
tx- Columns:
version_num,tx_size,num_inputs,num_outputs
- Columns:
tx_fees- Columns:
tx_fee,tx_size,fee_ratio,min_fee
- Columns:
tx_inputs- Columns:
sig_script_len,is_standard,non_standard_reason
- Columns:
tx_outputs- Columns:
num_pubkeys,num_keys,script_type,size,value,is_standard,is_dust
- Columns:
The SQL-like query language allows you to create rather expressive queries over the stored time-series data. Here are some example queries:
- Information about all non P2KH tx outputs in the last hour:
SELECT * FROM tx_outputs WHERE time > now() - 1h and script_type <> 'pubkeyhash'
- A histogram Incoming/Outgoing connections grouped by user agent
SELECT HISTOGRAM(user_agent) FROM peers WHERE time > now() - 1d group by user_agent- (Typically dominated by those pesky Bitcoin seeders/trackers)
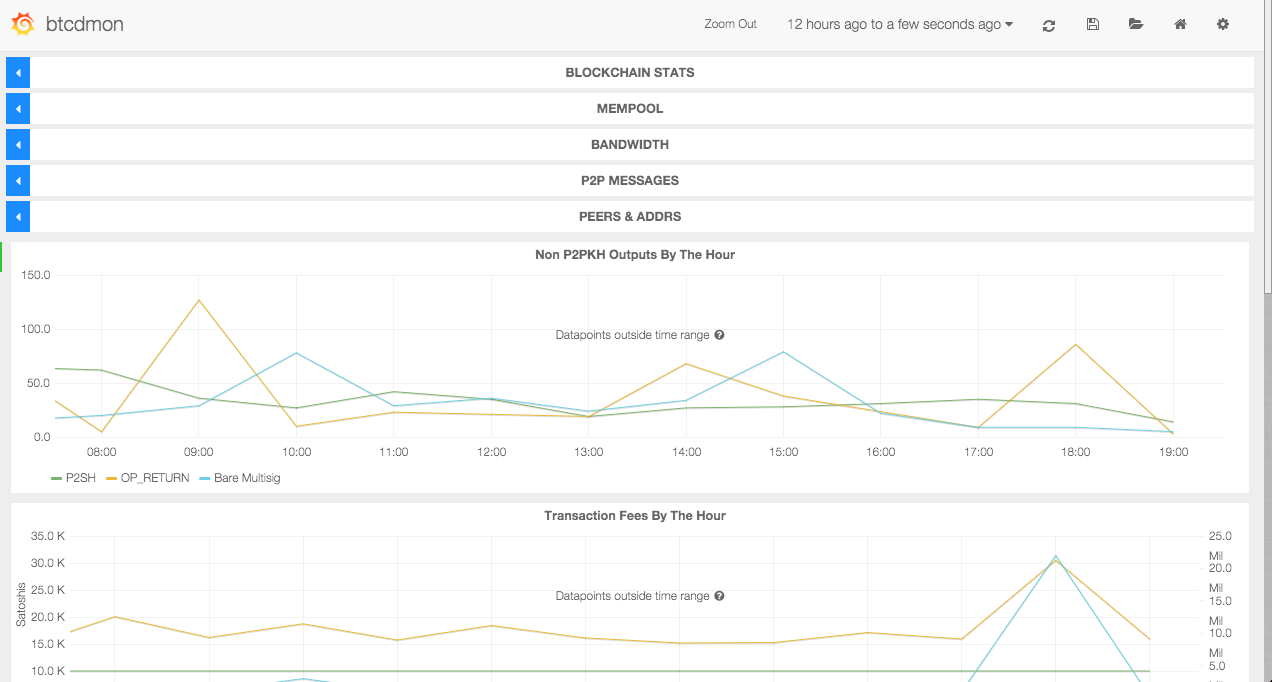
##Screenshots
####The main dashboard:

####The admin interface:
##Bootstrapped Dashboard
It can take some time to learn how to use the Grafana interface, InfluxDB queries etc. So I've exported the configuration of the dashboard i'm currently running into a JSON format, to get you up and running with a fully functional dashboard. You can find the file in this repository under the name: btcdmon-default-dashboard.json. To import the seralized JSON dashboard, navigate to your dashboard and locate the folder icon in the top left. Click that, and locate the import button next, uploading the file, and finally saving the dashboard config to InfluxDB.
##Future work
Something, something, alerts, precomputed queries, TCP listeners for exporting metrics to central server monitoring a fleet of nodes.