grafana / Clock Panel
Programming Languages
Clock Panel Plugin for Grafana


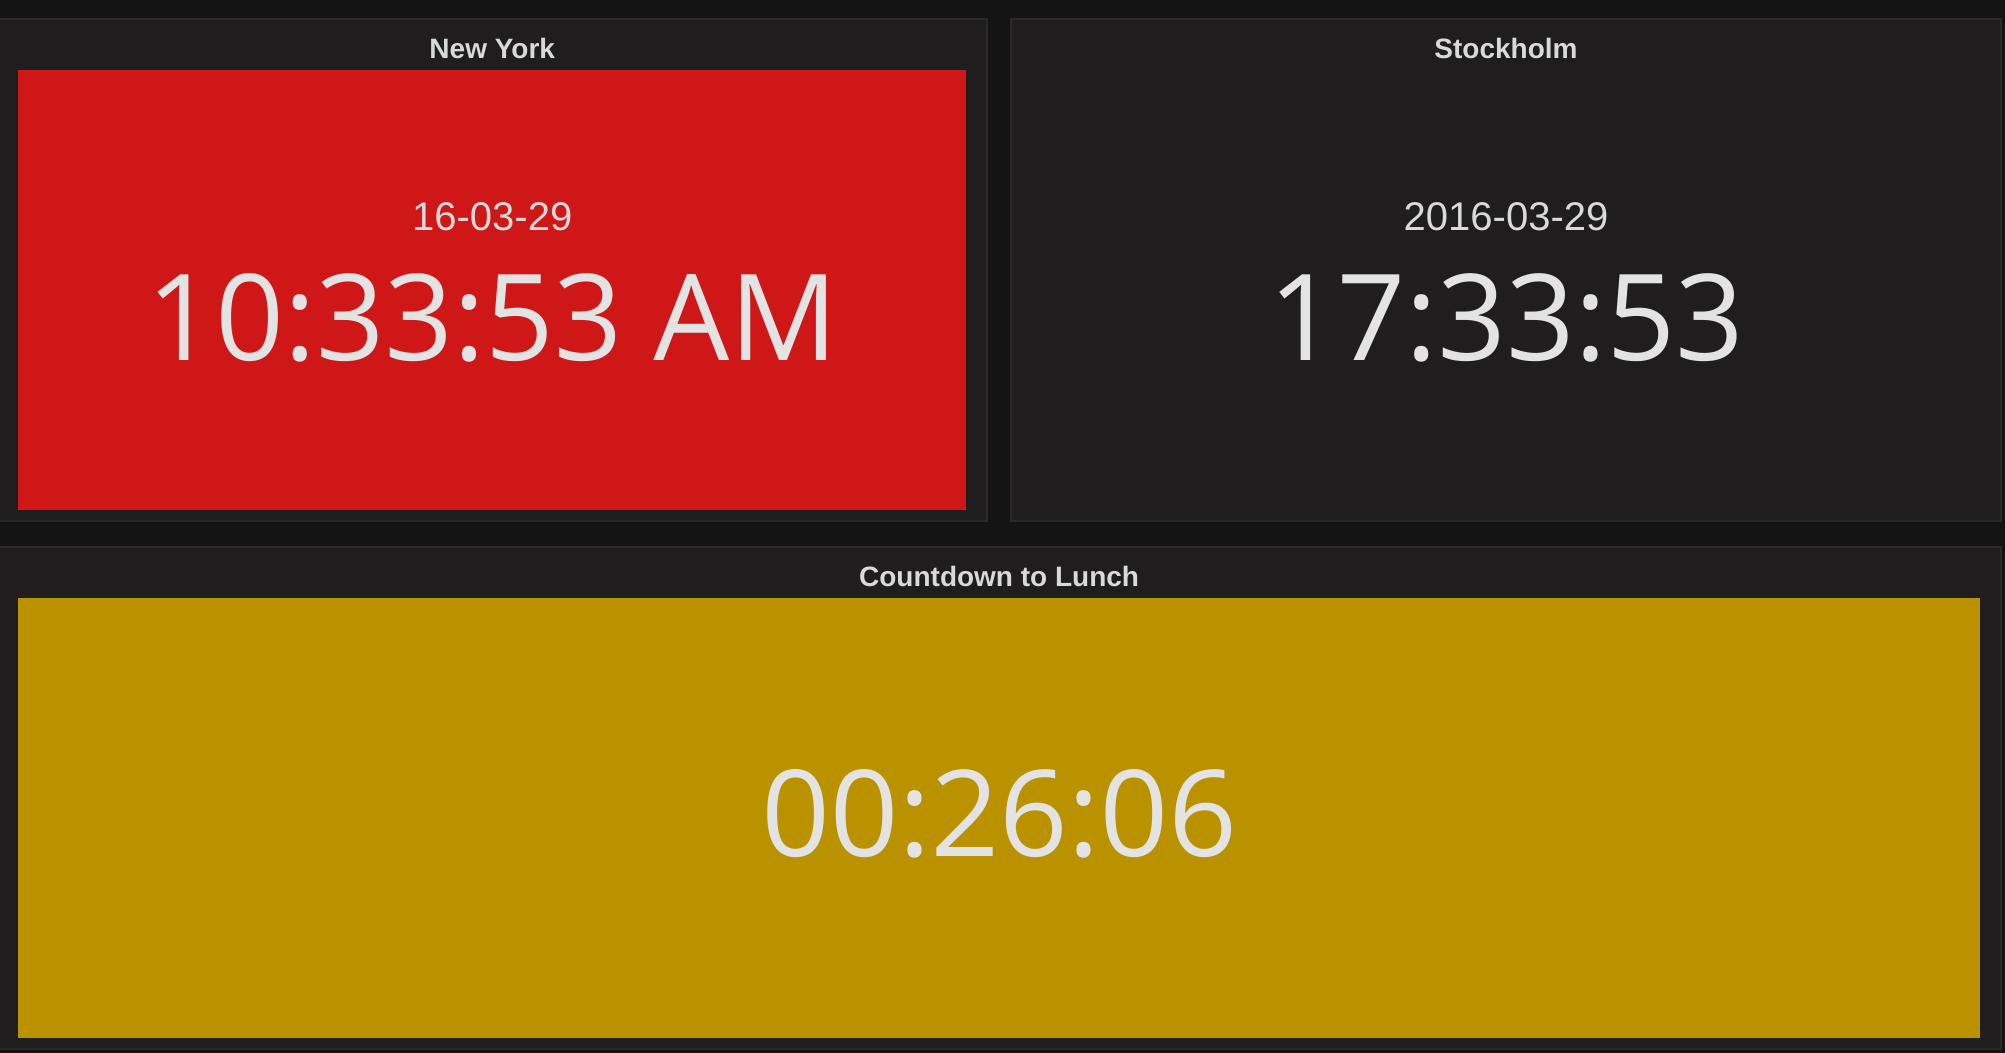
The Clock Panel can show the current time or a countdown and updates every second.
Show the time in another office or show a countdown to an important event.
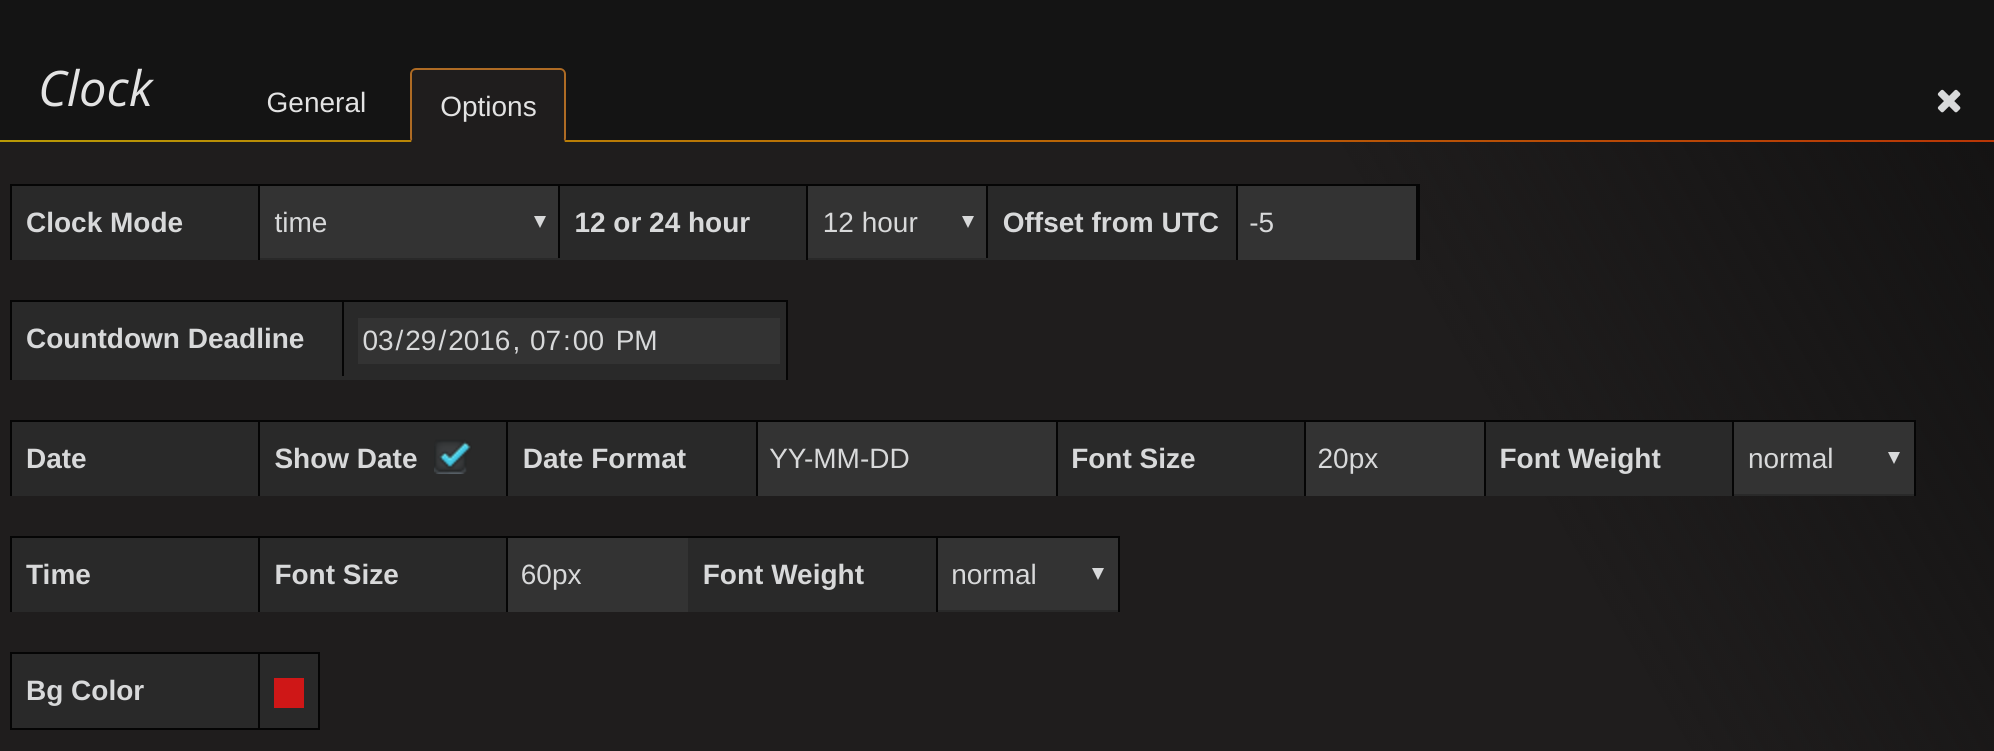
Plugin options
Options
-
Mode:
Default is time. If countdown is chosen then set the Countdown Deadline to start the countdown.
-
12 or 24 hour:
Show time in the 12/24 hour format.
-
Timezone:
This timezones are supplied by the moment timezone library. Timezone can be set or left to default. Default is moment's guess (whatever that is on your computer). Timezone is also used to calculate countdown deadline in countdown mode.
-
Locale:
Locales for date-formatting are supplied by the moment library. The locale can be set or left to default. Default is moment's guess.
-
Countdown Deadline:
Used in conjunction with the mode being set to countdown. Choose a date and time to count down to.
-
Countdown End Text:
The text to show when the countdown ends. E.g. LIFTOFF
-
Date/Time formatting options:
The font size, weight and date/time formatting can be customized here. If the seconds ticking annoys you then change the time format to HH:mm for the 24 hour clock or h:mm A for the 12 hour clock, or see the full list of formatting options.
-
Bg Color:
Choose a background color for the clock with the color picker.
Refresh
-
Sync:
The clock is paused and only updated when the dashboard refreshes - the clock will show the timestamp for the last refresh.
Screenshots
Development
Using Docker:
- Clone the repository and
cdto it - make sure you have yarn installed
- install project dependencies:
yarn install --pure-lockfile - Start the "watch" task:
yarn watch - Run a local Grafana instance with the development version of the plugin:
docker run -p 3000:3000 -d --name grafana-plugin-dev --volume $(pwd)/dist:/var/lib/grafana/plugins/clock-panel grafana/grafana - Check the logs to see that Grafana has started up:
docker logs -f grafana-plugin-dev - Open Grafana at http://localhost:3000/
- Log in with username "admin" and password "admin"
- Create new dashboard and add the plugin
To build a production build with minification: yarn build