Clustergrammer2 Notebooks
This repository contains several example Jupyter notebooks using the interactive heatmap Clustergrammer2. These notebooks demonstrate how Clustergrammer2 can be used explore datasets of increasing size and complexity. Click the MyBinder badge above to launch Jupyter Lab, where you can easily upload your own dataset to explore on the cloud.

Above is a GIF of notebook 2.0 Cancer Cell Line Encyclopedia Bulk Gene Expression exploring the Cancer Cell Line Encyclopedia gene expression data (data obtained from the Broad-Institute).
Additional examples can be found in Clustergrammer's Case Studies and Tutorials documentation:
1.0 Running Clustergrammer2
![]()
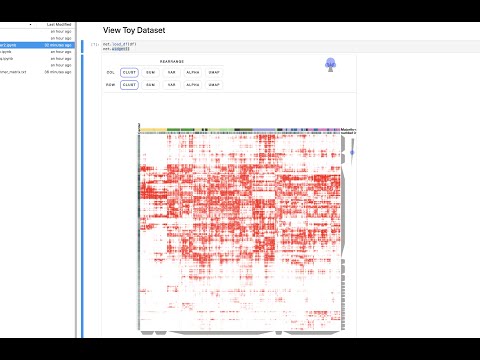
This notebook shows how Clustergrammer2 can be used to load a small dataset and visualize a large random DataFrame. By running the notebook on MyBinder using Jupyter Lab it can also be used to visualize a user uploaded dataset. Please see the video tutorial above for more information.
2.0 Cancer Cell Line Encyclopedia Bulk Gene Expression
![]()

This notebook visualizes the Cancer cell line Encyclopedia gene expression data (data obtained from the Broad-Institute). The CCLE project measured genetic data from over 1000 cancer cell lines. Please see the video tutorial above for more information.
3.0 scRNA-seqs 2,700 PBMC
![]()
Single cell RNA-seq (scRNA-seq) is a powerful method to interrogate gene expression across thousands of single cells. This method produces thousands of measurements (single cells) across thousands of dimensions (genes). This notebook uses Clustergrammer2 to interactively explore an example dataset measuring the gene expression of 2,700 PBMCs obtained from 10X Genomics. Bulk gene expression signatures of cell types from CIBERSORT were used to obtain a tentative cell type for each cell. Please see the video tutorial above for more information.
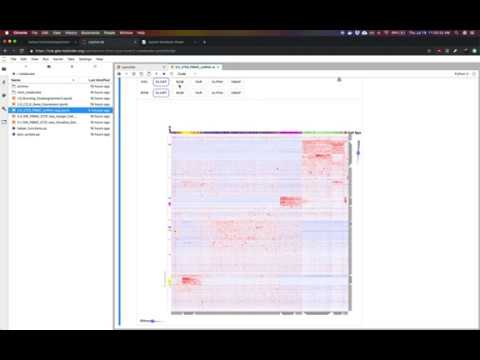
4.1 CITE-seq 10K PBMC
![]()

CITE-seq (a.k.a feature barcoding from 10X genomics) is a new method that enabels researchers to simultaneously measure gene expression and protein levels in single cells. This notebook uses Clustergrammer2 to interactively explore an example dataset measuring the gene expression and surface marker proteins of 7,800 PBMCs obtained from 10X Genomics. Cell type was assigned based on unbiased hierarchical clustering of cells in surface marker space (ADTs) and transferred to cells in gene expression space. Please see the video tutorial above for more information.
5.2 Mouse Organogenesis Cell Atlas 2 Million Cells
![]()

Cao, J and Spielmann, M et al profiled gene expression from ~2 million mouse cells (~1.3 million non-doublets) between 9.5 and 13.5 days of gestation. They identified 38 major cell types and measured ~25,000 genes. We generated a downsampled view of this data representing the ~1.3 million single cells (~excluding 600K suspected doublets) in the dataset by averaging expression for each cell type in each embryo, resulting in ~2,000 cell-type and embryo representative clusters. We use Clustergrammer2 to explore this dataset in notebook 5.2. We demonstrate how Clustergrammer2 can be used to find genes associated with cell type clusters as well as identify genes that are differentially regulated across developmental stage.
6.0 CODEX Mouse Spleen Dashboard

Goltsev et al used a highly multiplexed cytometric approach called CODEX to measure ~30 surface markers in spatially resolved single cells from mouse spleens. We utilized Clustergrammer2 to hierarchically cluster ~5,000 sinlge cells (from a subset of a segmented spleen image). We also used the Jupyter Widget bqplot to visualize single cell location data using voronoi plots. We then built a dashboard using the library voila, which converts Jupyter notebooks to dashboards/web-apps, and linked our heatmap to the spatial map. This allows to interact with the Clustergrammer2 heatmap and highlight cells in the spatially resolved map. These kind of linked views are crucial for exploration of spatially resolved high-dimensional single cell data. Finally, we are running this dashboard using MyBinder. This example dashboard is being run from the repo: https://github.com/ismms-himc/codex_dashboard.
Contact
For issues and concerns please use the issue tracker or gitter discussion room.