CosmiQ / Cometts
Labels
Projects that are alternatives of or similar to Cometts
Comet Time Series (CometTS) Visualizer
Base Functionality
Comet Time Series (CometTS) is an open source tool coded in python including jupyter notebooks and command line utility that enables users to visualize or extract relevant statistics from almost any format time series of overhead imagery within a specific region of interest (ROI). To use CometTS, you must define your ROI, provide a CSV file documenting how your imagery is organized, and then run one of the CometTS analysis tools. This usually takes the following steps
- Outline and download your ROI with a service like geojson.io
- Organize your imagery and document it with the CometTS.CSV_It tool
- Analyze your data using:
-
CometTS for trend analysis (optionally, mask unwanted clouds and other features with
--maskitoption) - or CometTS.ARIMA for averaging and anomaly detection
-
CometTS for trend analysis (optionally, mask unwanted clouds and other features with
- Plot the results using the plotting notebook
A full walkthrough of this functionality with example data is included in two notebooks: CSV_Creator and CometTS_Visualizer
File Formats:
Installation
Python 2.7 or 3.6 are the base requirements plus several packages. CometTS can be installed in multiple ways including conda, pip, docker, and cloning this repository.
Clone it
We recommend cloning to add all sample data and easier access to the jupyter notebooks that leverage our plotting functions.
git clone https://github.com/CosmiQ/CometTS.git
If you would like the full functionality of a python package we have several options.
pip
pip install CometTS
pip installs may fail on macs with python3 as GDAL is finicky. Use some of the alternative approaches below.
Docker
docker pull jss5102/cometts
docker run -it -v /nfs:/nfs --name cometts jss5102/cometts /bin/bash
Conda
Create a conda environment!
git clone https://github.com/CosmiQ/CometTS.git
cd CometTS
conda env create -f environment.yml
source activate CometTS
pip install CometTS
Dependencies
All dependencies can be found in the docker file Dockerfile or environment.yml or requirements.txt.
Examples
Agadez, Niger
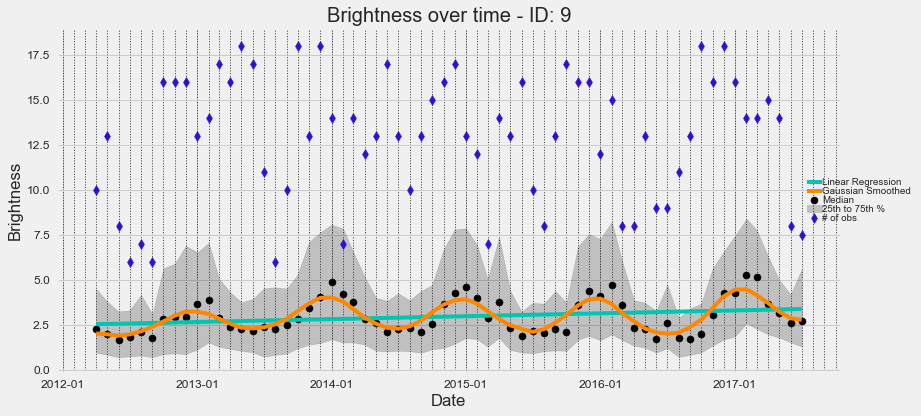 Seasonal variation in brightness that likely indicates seasonal migrations and population fluctuations in central Niger, Africa.
Suruc Refugee Camp, Turkey
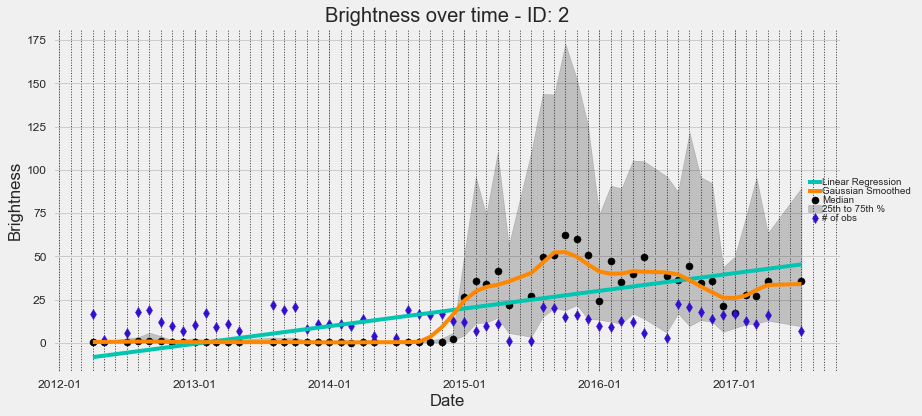 Increase in brightness coinciding with the establishment of a refugee camp in southern Turkey, north of Syria.
Allepo, Syria
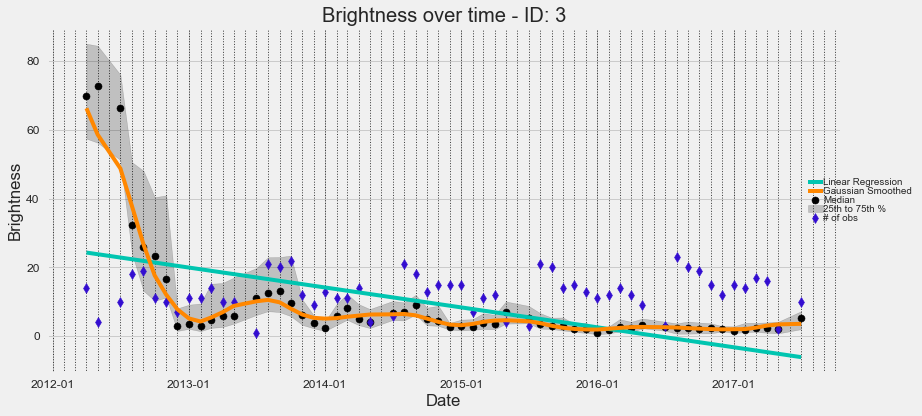 Brightness declines (i.e., putative population decline) as a result of Syrian Civil War and military actions in Aleppo.
NDVI Visualization north of Houston, Texas
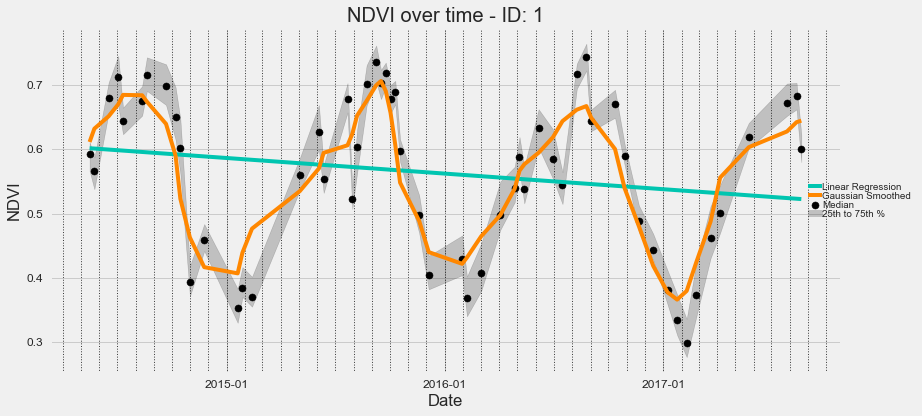 A visualization of the Normalized Difference Vegetation Index (NDVI) in a field north of Houston using a time-series of Landsat imagery.
Landsat Multispectral Visualization
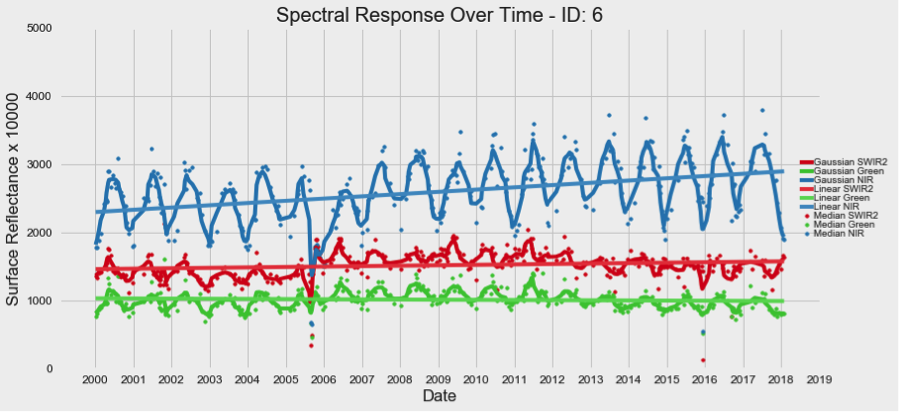 A visualization of three Landsat bands in New Orleans, Louisiana. Note the effects of Katrina in 2005.
Contribute or debug?
Interested in proposing a change, fixing a bug, or asking for help? Check out the contributions guidance.
License
See LICENSE.

