rstudio / Concept Maps
Labels
Concept Maps
Mental models used in introductory data science lessons.
All material made available under the Creative Commons - Attribution license.
-
Concept Maps
- dplyr
- select
- filter
- mutate
- group_by and summarize
- data types
- pivoting
- separate - extract - unite
- factors
- R Markdown
- regular expressions
- pipe operator
- clustering
- data syndication
- Make
- functions
- program configuration
- column names
- learnr tutorial
- column-wise operations
- across
- Boolean
- values and variables
- neural networks
- Under Development
- Inspirations
- Contributing
Concept Maps
dplyr
Monica Alonso, Greg Wilson
select
Monica Alonso, Greg Wilson
filter
Monica Alonso, Greg Wilson
mutate
Monica Alonso, Greg Wilson
group_by and summarize
Monica Alonso, Greg Wilson
data types
Meghan Sposato, Brendan Cullen, Monica Alonso
pivoting
Florian Schmoll, Monica Alonso
separate - extract - unite
Monica Alonso, Greg Wilson
factors
Ildiko Czeller, Graham Parsons, Monica Alonso
R Markdown
Gabriela Sandoval, Florencia D'Andrea, Yanina Bellini Saibene, Monica Alonso
regular expressions
Monica Alonso, Greg Wilson
pipe operator
Jeroen Janssens, Monica Alonso
clustering
data syndication
Make
functions
program configuration
column names
Emily Riederer (originally in this blog post)
learnr tutorial
column-wise operations
across
Boolean
values and variables
neural networks
Under Development
visualization
This one is still unsatisfactory: please contact us with suggestions or submit a pull request to this repository.
Monica Alonso, Greg Wilson
join
This one is still unsatisfactory: please contact us with suggestions or submit a pull request to this repository.
Garrick Aden-Buie, Greg Wilson
Inspirations
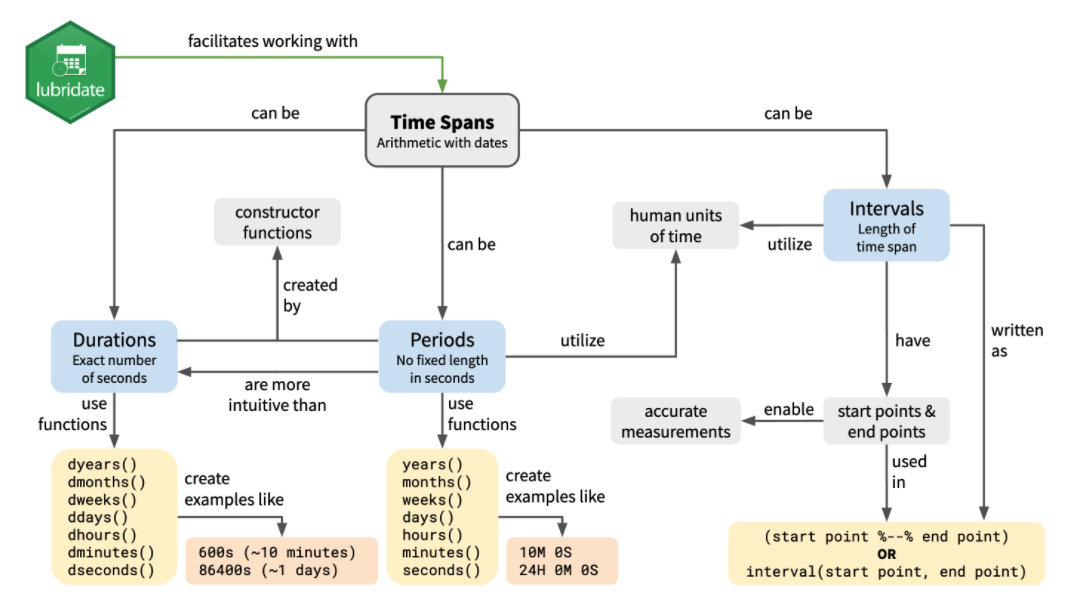
Dates and Times
Silvia Canelón
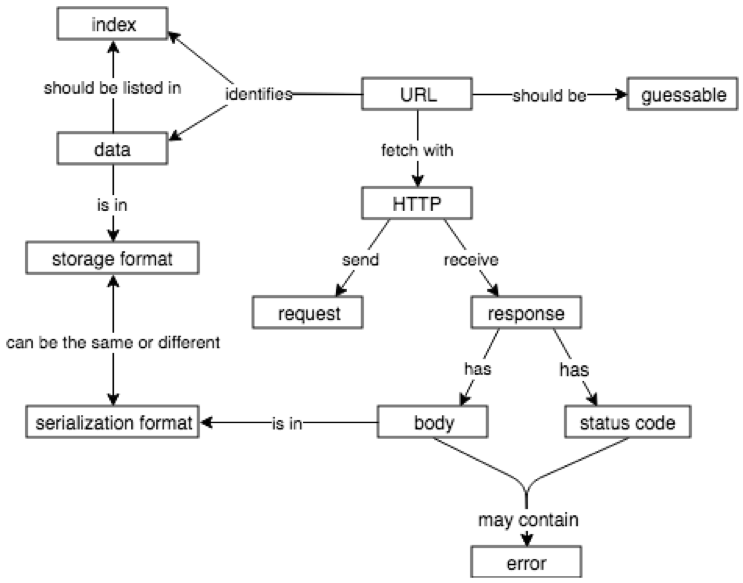
HTTP
Greg Wilson
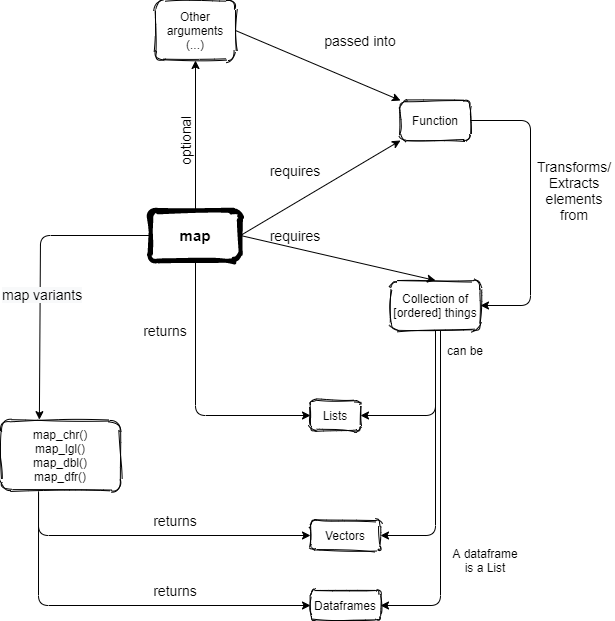
Map
Lefkios Paikousis
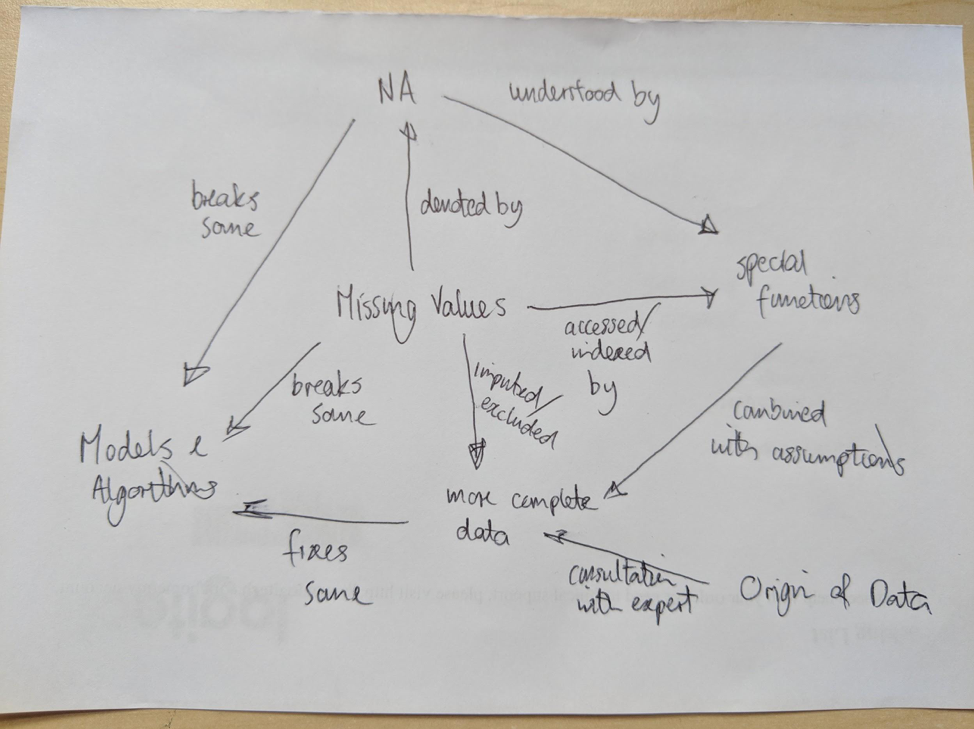
Missing Values
Roman Popat
Neural Networks
Omayma Said
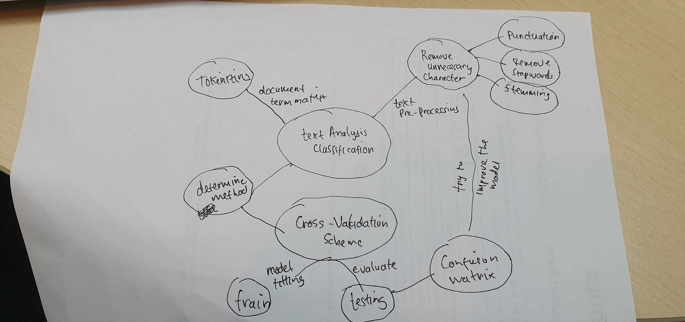
Text Analysis
Ahmad Husain Abdullah
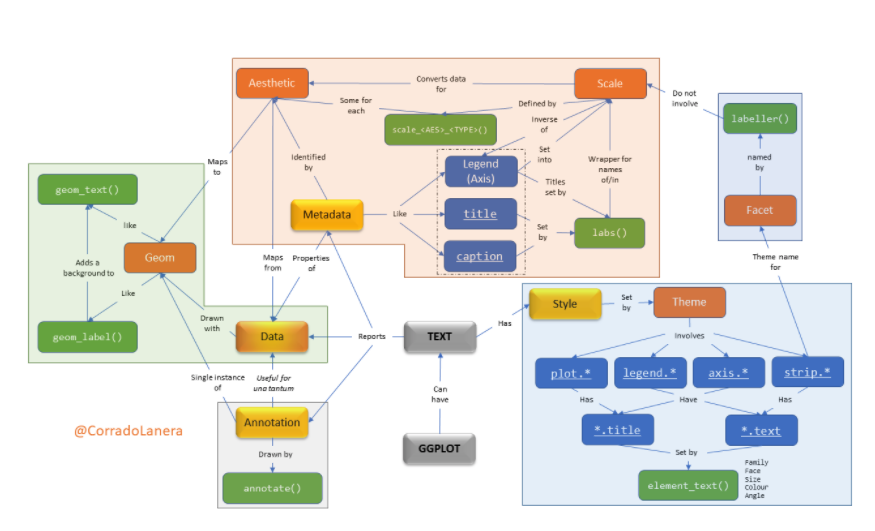
Visualization
Corrado Lanera
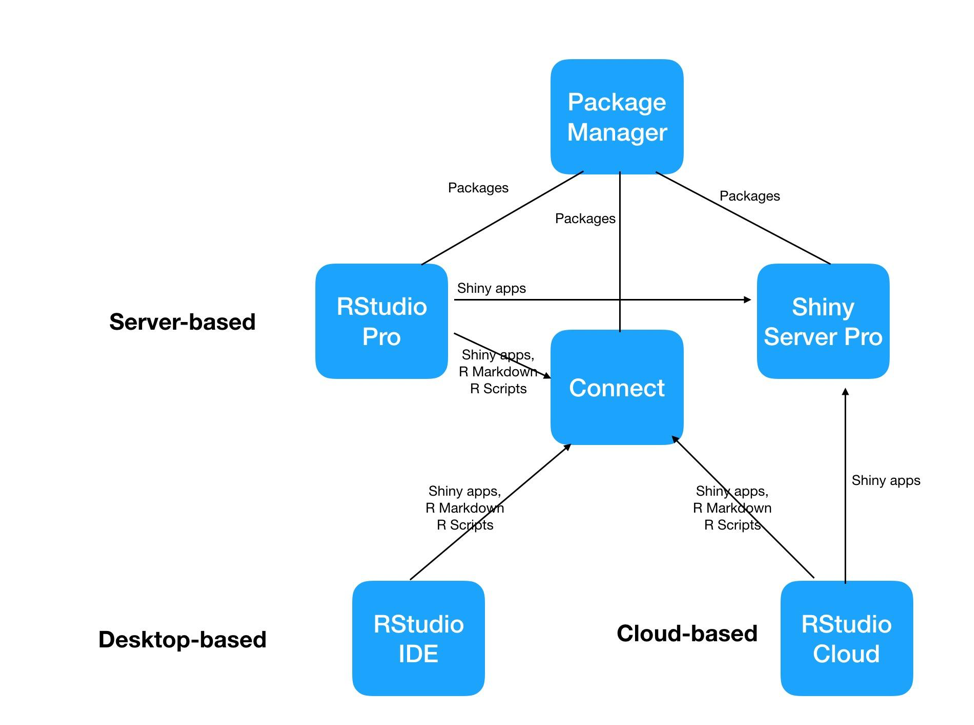
RStudio Products
Carl Howe
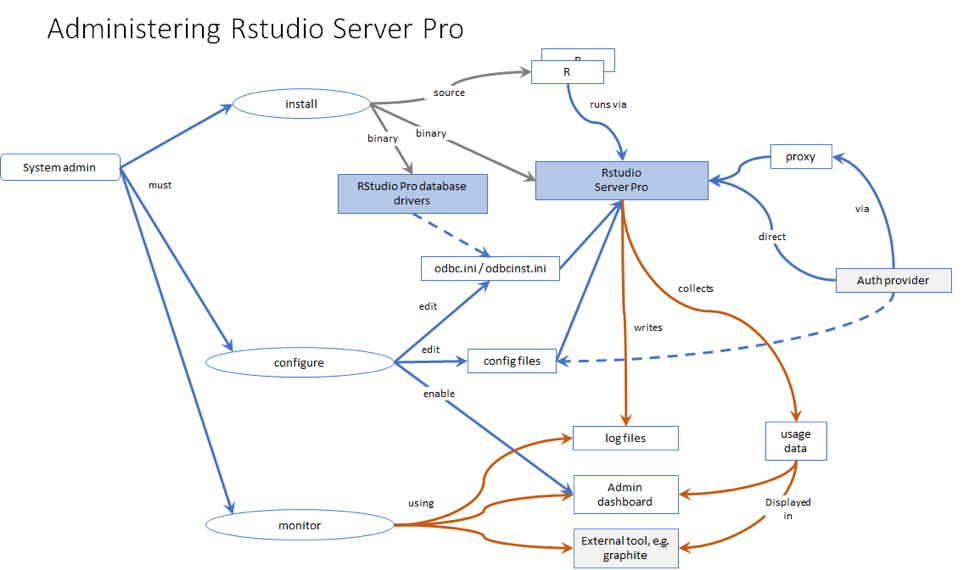
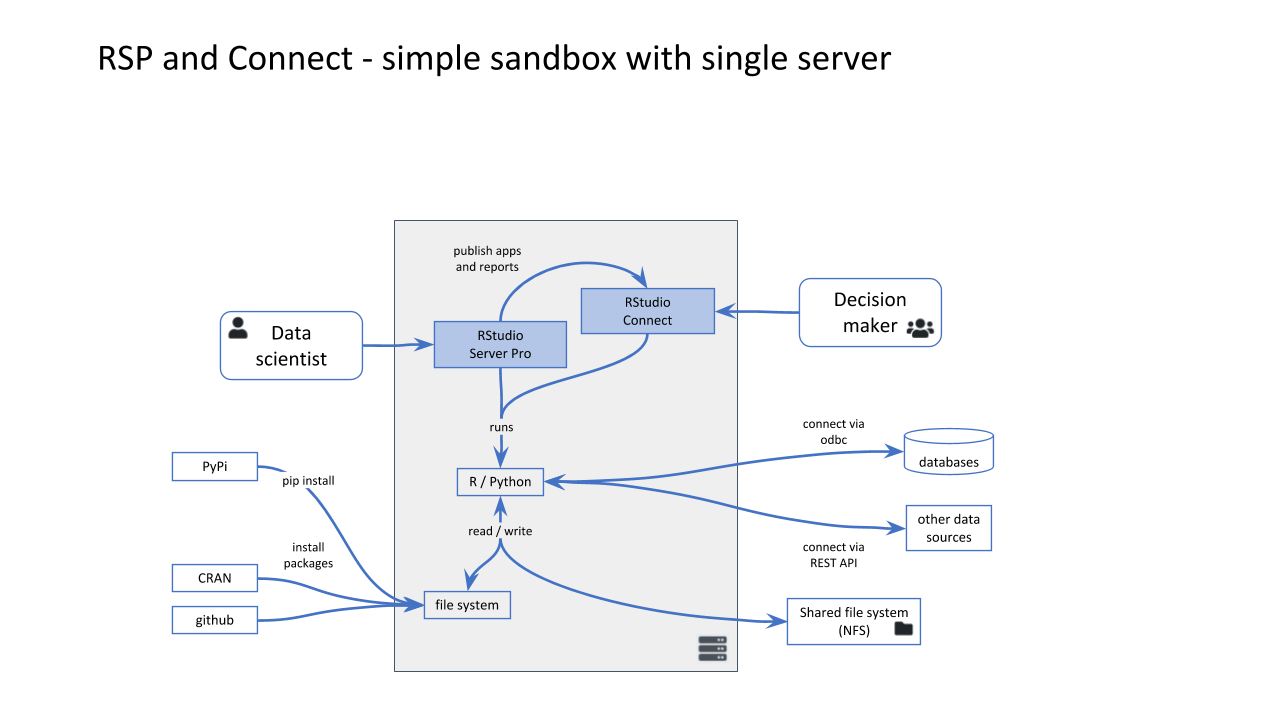
Administering RStudio Server Pro
Andrie de Vries
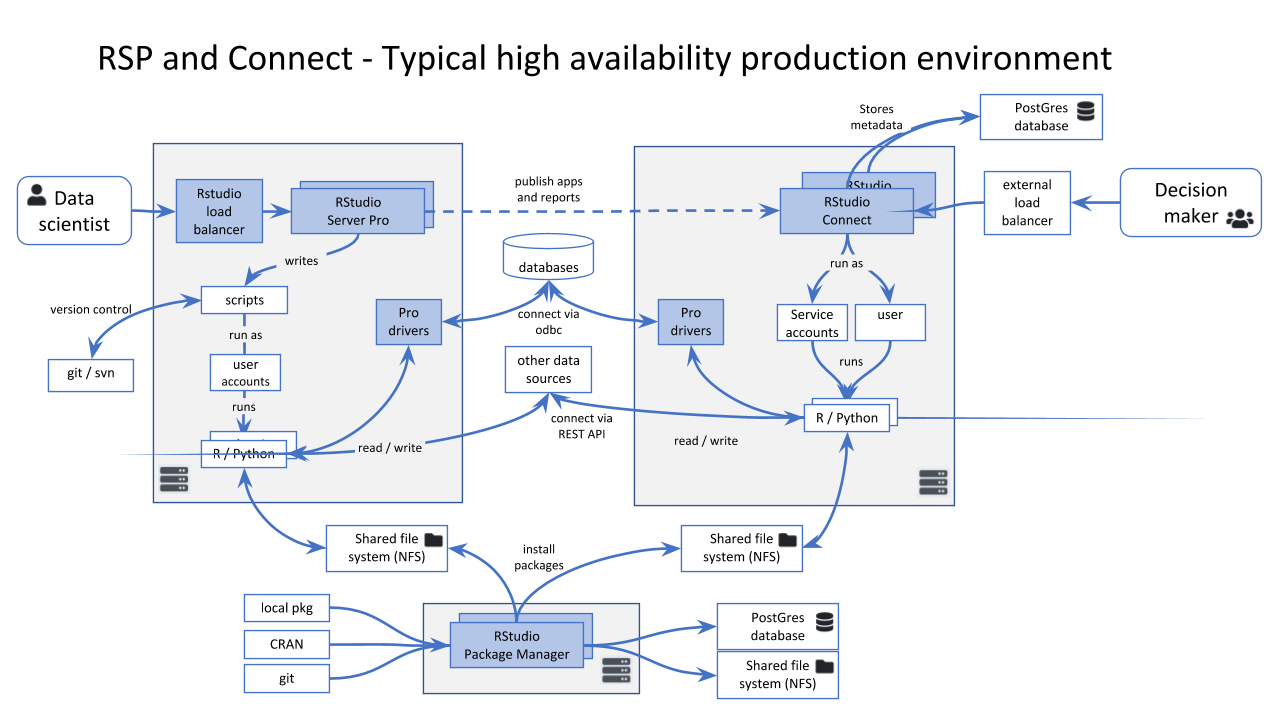
RStudio Server Pro Configurations (simple and complex)
Andrie de Vries
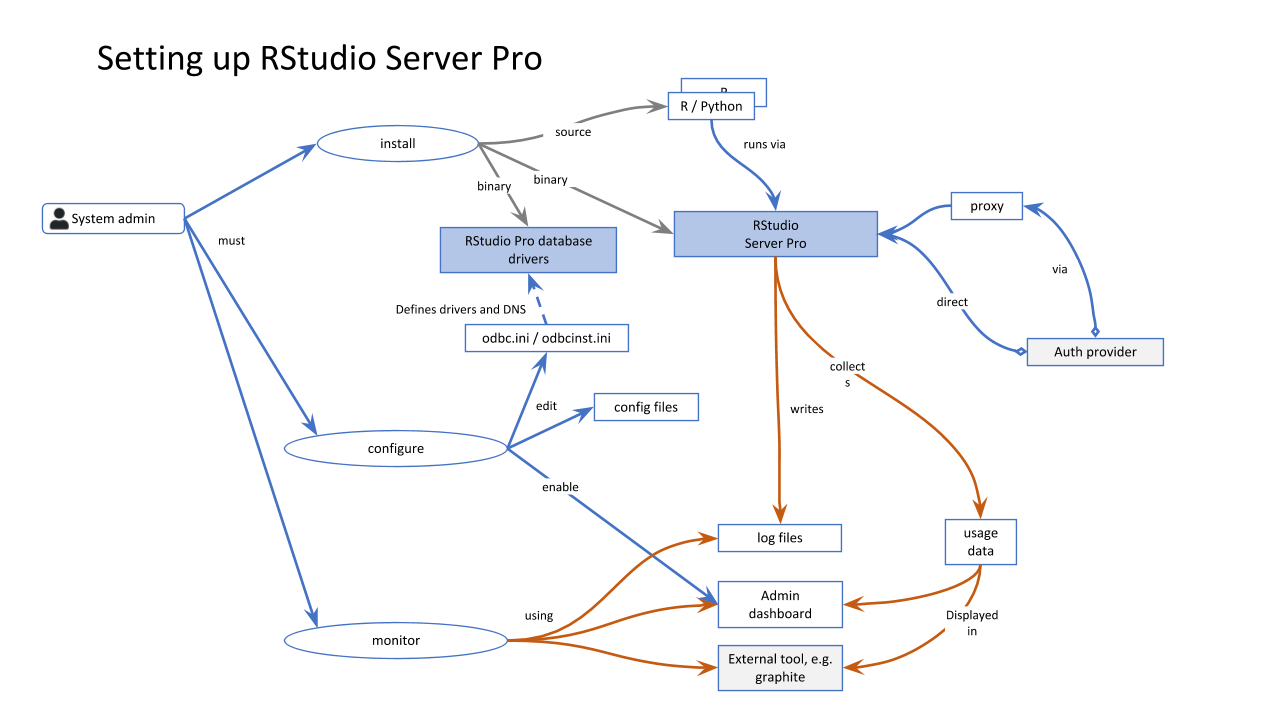
Setting Up RStudio Server Pro
Andrie de Vries
programs
Greg Wilson
variables and values
Greg Wilson
Contributing
Formatting
-
All diagrams are created with diagrams.net, which can be used online or downloaded from the project's GitHub repository (approximately 100MB).
-
Save all diagrams as "Editable SVG" (a superset of the SVG standard that includes information about anchor points and connections).
-
Use the "Sketch" style, which can be chosen from the "Style" menu when no elements are selected. (See this blog post for details.)
-
Use #FEFEFF (very pale blue) as a background color and #000080 (very dark blue) for lines and text. Use 1pt lines, no fill, and 12pt Helvetica. If there is a central concept, give it a 3pt outline and make the text bold and italic
-
Connect both ends of lines to anchor points on concepts and move text as needed so that it does not lie on the line.
-
When mentioning specific functions, do not put
()after the function's name (as this makes it impossible to distinguish between a mention of the function and a call to the function with zero arguments).
Exporting
-
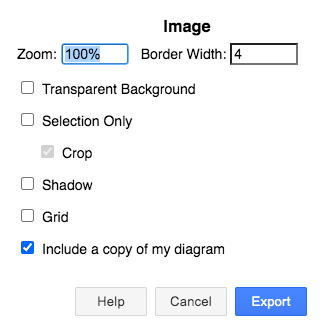
Export PNG by selecting everything and then using these settings:
- Zoom: 100%
- Border Width: 4 pixels
- Selection Only
- Crop
-
Do not select "Transparent Background", "Shadow", "Embed Images", or "Include a copy of my diagram".
Discussion
-
Why concept maps? They help authors figure out what they want to teach, give other instructors a quick overview of a lesson, and allow learners to check that they have constructed the right mental model.
-
What about translations? We hope eventually to be able to store translated text in the
.drawiofiles. For now, please copy an existing diagram and save it in the appropriate language directory (e.g.,af/topic.svgfor concept maps in Afar). -
Why SVG? Because vector diagrams rescale much more smoothly than raster images.
-
Why not use color? Or more shapes? Or...? The simpler these diagrams are, the easier they will be to maintain. Simple diagrams also display better on smaller or older devices.
-
Why not use Graphviz, DiagrammeR, or some other tool that compiles text into diagrams?
- As these graphviz-generated files show, it's hard to get their automatic layout algorithms to do as good a job as a person can do.
- They have a much steeper learning curve, which means fewer people will be able to contribute.
- They don't actually make version control easier (reading and understanding the textual description of a diagram is as hard as viewing two diagrams side by side).

