J535D165 / Coronawatchnl
Projects that are alternatives of or similar to Coronawatchnl

Dataset: COVID-19 case counts in The Netherlands
CoronaWatchNL collects numbers on COVID-19 disease count cases in The Netherlands. The numbers are collected from various sources on a daily basis, like RIVM (National Institute for Public Health and the Environment), LCPS (Landelijk Coördinatiecentrum Patiënten Spreiding), NICE (Nationale Intesive Care Evaluatie), and the National Corona Dashboard. This project standardizes, and publishes data and makes it Findable, Accessible, Interoperable, and Reusable (FAIR). We aim to collect a complete time series and prepare a dataset for reproducible analysis and academic use.
Dutch:
CoronalWatchNL verzamelt ziektecijfers over COVID-19 in Nederland. Dagelijks worden de cijfers verzameld van het RIVM (Rijksinstituut voor de Volksgezondheid en Milieu), LCPS (Landelijk Coördinatiecentrum Patiënten Spreiding), NICE (Nationale Intesive Care Evaluatie) en Nationale Corona Dashboard. Dit project standaardiseert en publiceert de gegevens en maakt ze vindbaar, toegankelijk, interoperabel en herbruikbaar (FAIR). We streven ernaar om een dataset beschikbaar te stellen voor reproduceerbare analyses en wetenschappelijk gebruik.
Datasets
The datasets available on CoronaWatchNL are updated on a daily basis. Availability depends on the publication by the respective sources (N.B. since July 1st, the epidemiological reports published by RIVM will be released on a weekly instead of a daily basis). The CoronaWatchNL project divides the datasets into four main categories:
For (interactive) applications based on these datasets, have a look at the applications folder. For predictive models based on these datasets, check out the parallel repository CoronaWatchNL Extended. Please note that the intention of these (too) simplistic models - made by CoronaWatchNL volunteers - is to show how the data can be used for modelling, not to answer specific hypotheses or follow scientific protocol.
Please see the Remarks document for notes about the datasets. Do you have remarks? Please let us know.
Geographical datasets
Reference time: 10:00 AM
These datasets describe the new and cumulative number of confirmed, hospitalized, and deceased COVID-19 cases. Every day, RIVM retrieves the data from the central database OSIRIS at 10:00 AM. Here, the datasets are categorized by their geographical level (i.e., national, provincial, municipal).
For more detail about the specific structure of these geographical datasets, have a look at the data-geocodebook.
| Dataset | Source | Variables |
|---|---|---|
| Reported case counts by date in NL | RIVM | Date, Type (Total, hopitalized and deceased COVID-19 cases), (Cumulative) Count |
| Reported case counts by date in NL per province | RIVM | Date, Province, Type (Total, hopitalized and deceased COVID-19 cases), (Cumulative) Count |
| Reported case counts by date in NL per municipality | RIVM | Date, Municipality, Province, Type (Total, hopitalized and deceased COVID-19 cases), (Cumulative) Count |
Reference time: by day (0:00 AM)
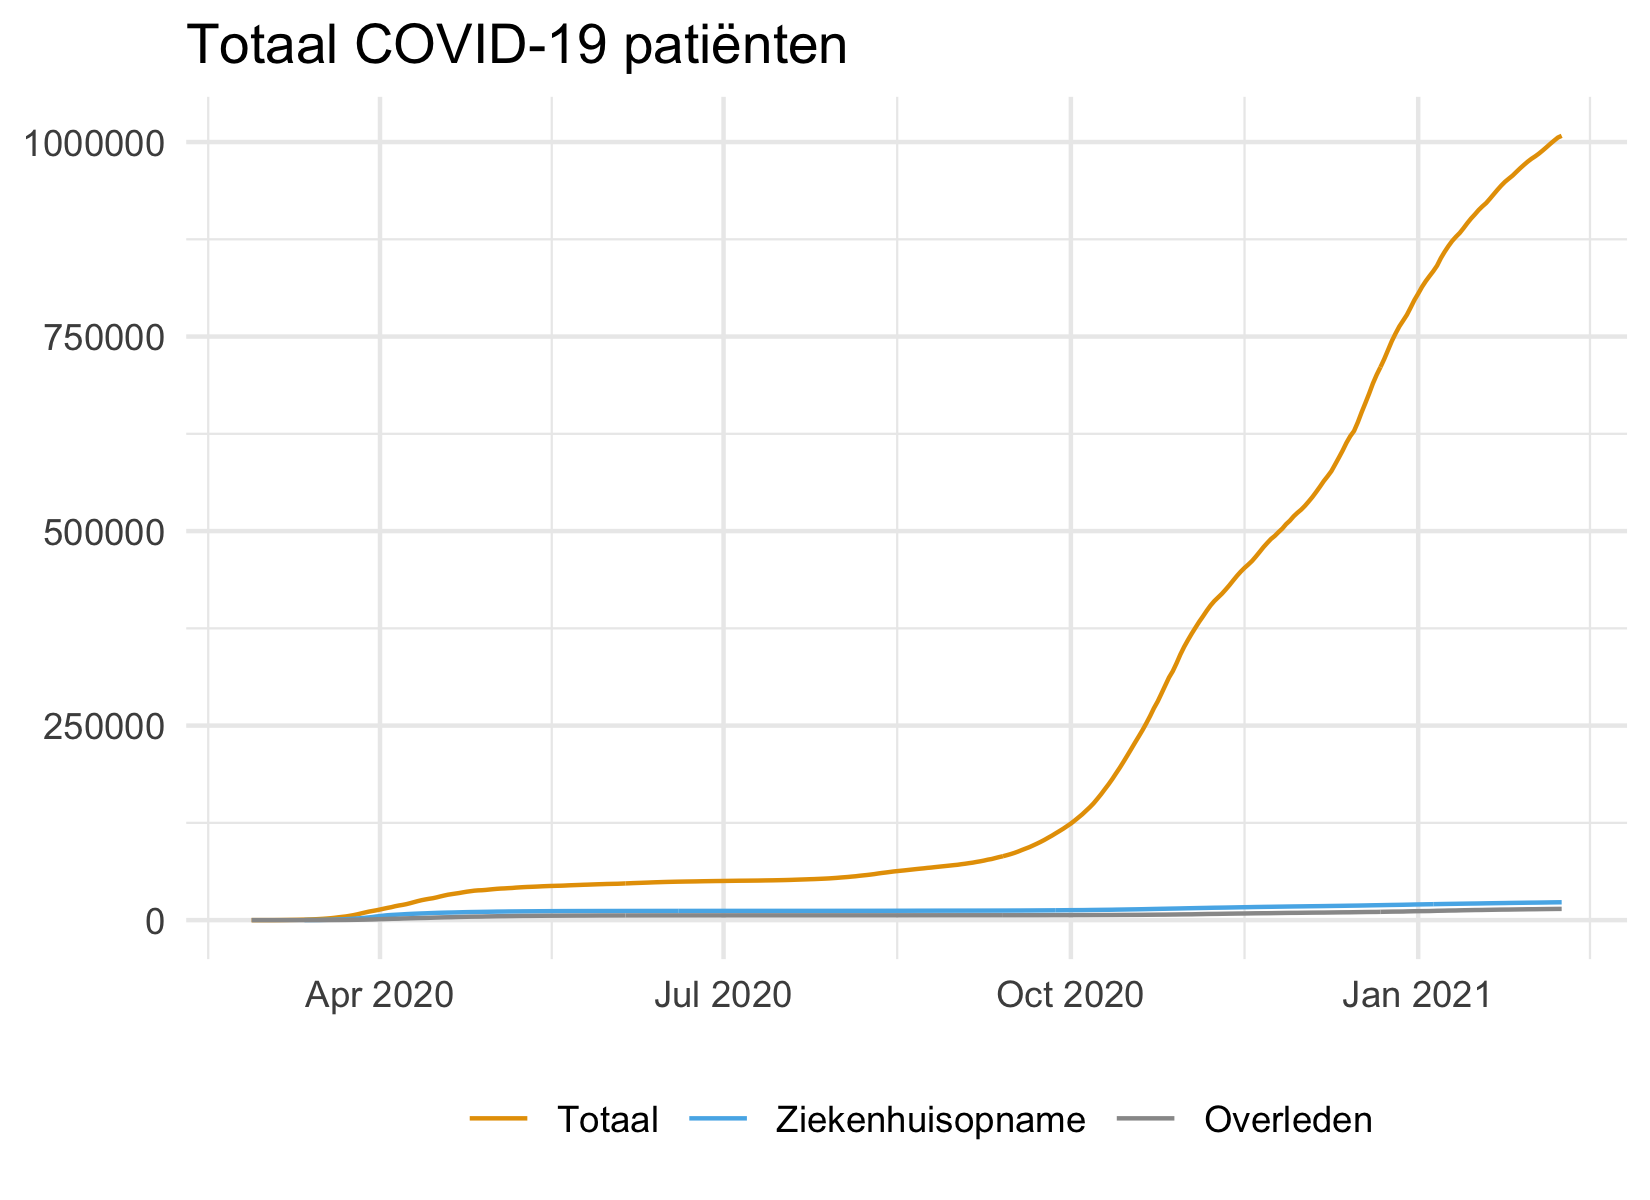
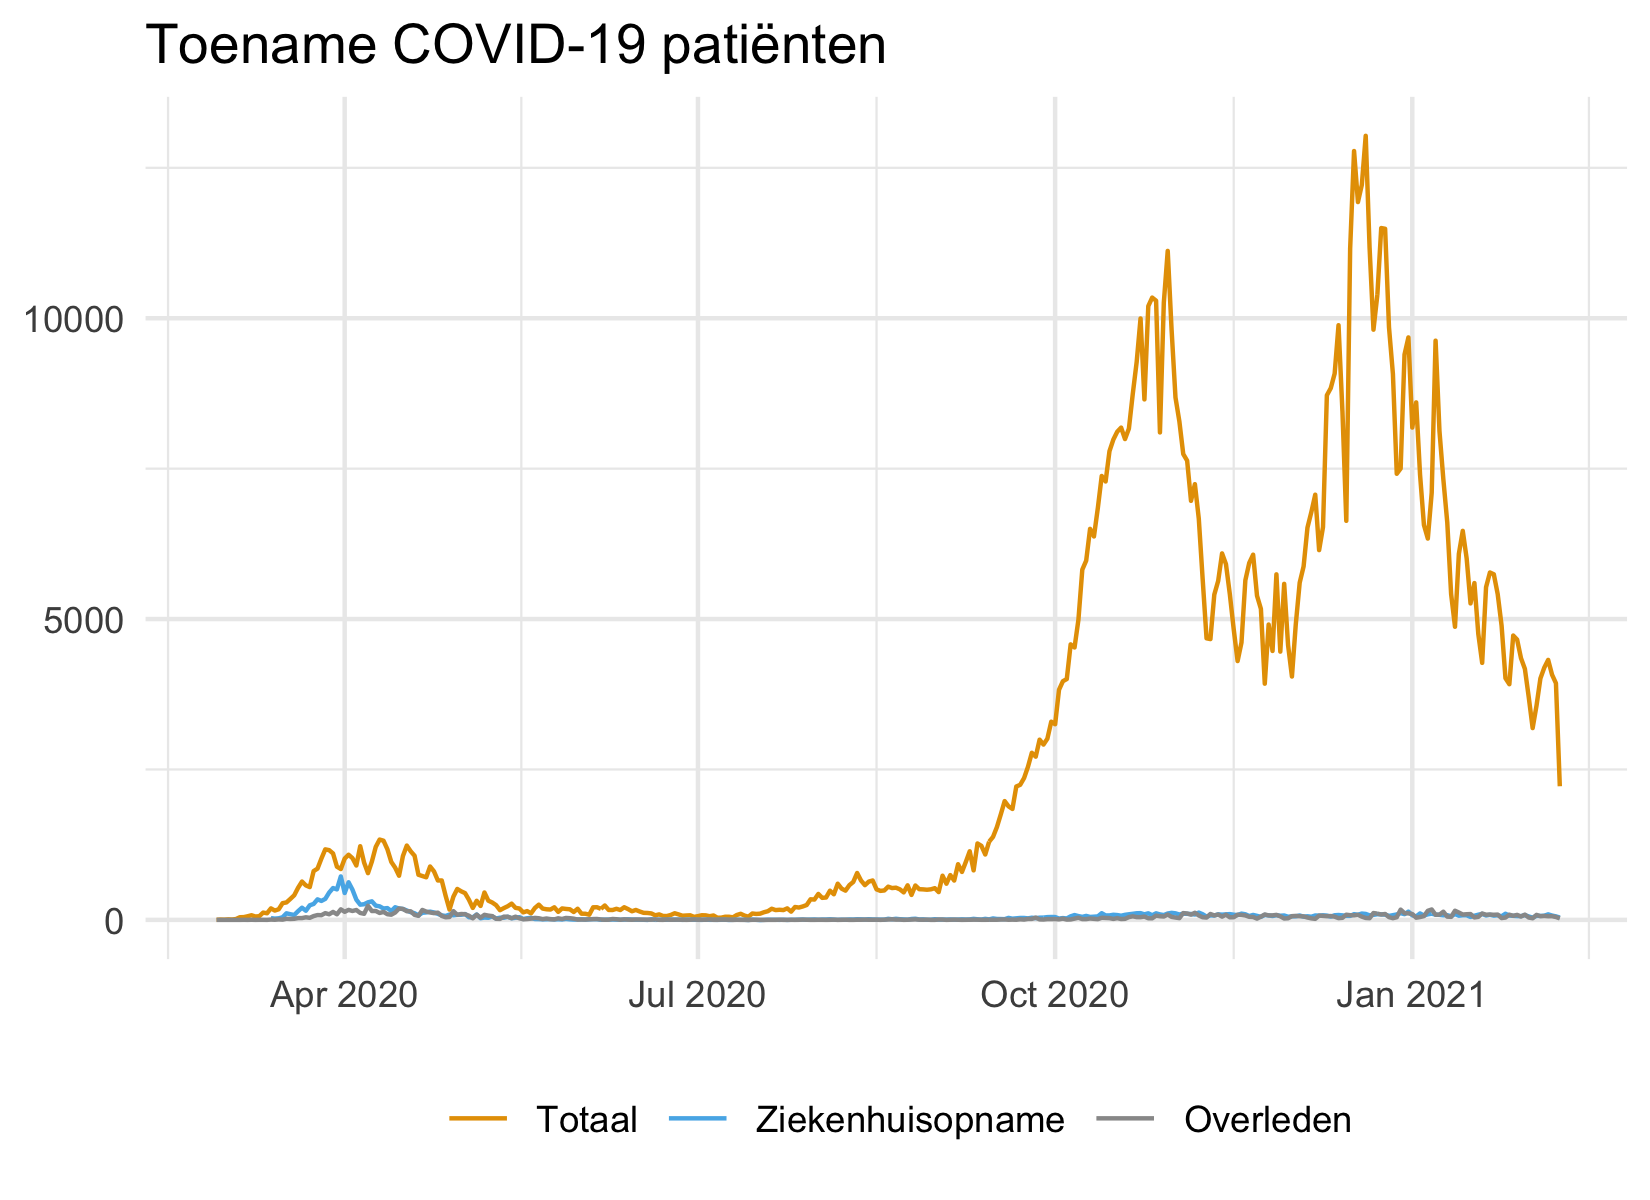
These datasets describe the new and cumulative number of confirmed, hospitalized, and deceased COVID-19 cases per day. The data is retrieved from the central database OSIRIS and counts the number of cases per day (0:00 AM) by RIVM. The dataset concerns numbers on a national level.
For more detail about the specific structure of this geographical dataset, have a look at the data-geocodebook.
| Dataset | Source | Variables |
|---|---|---|
| Case counts by date in NL | RIVM | Date, Type (Total, hopitalized and deceased patients), (Cumulative) Count |
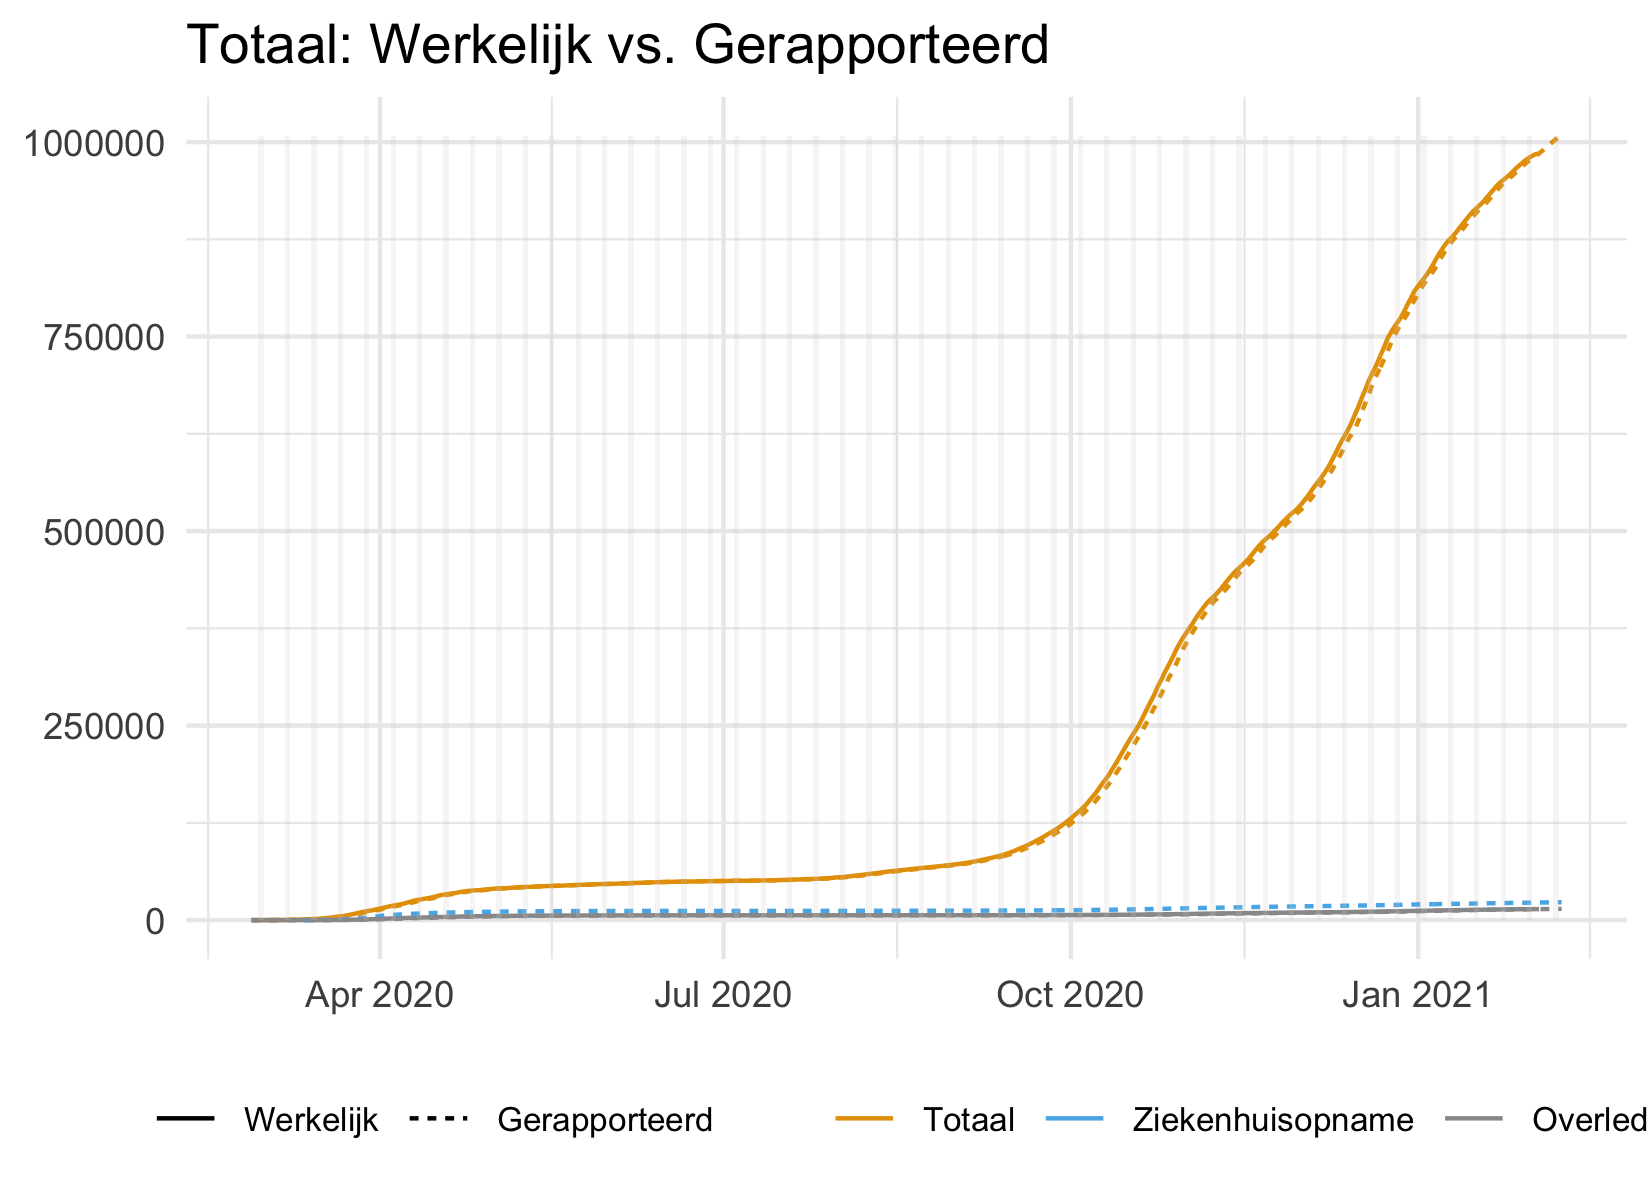
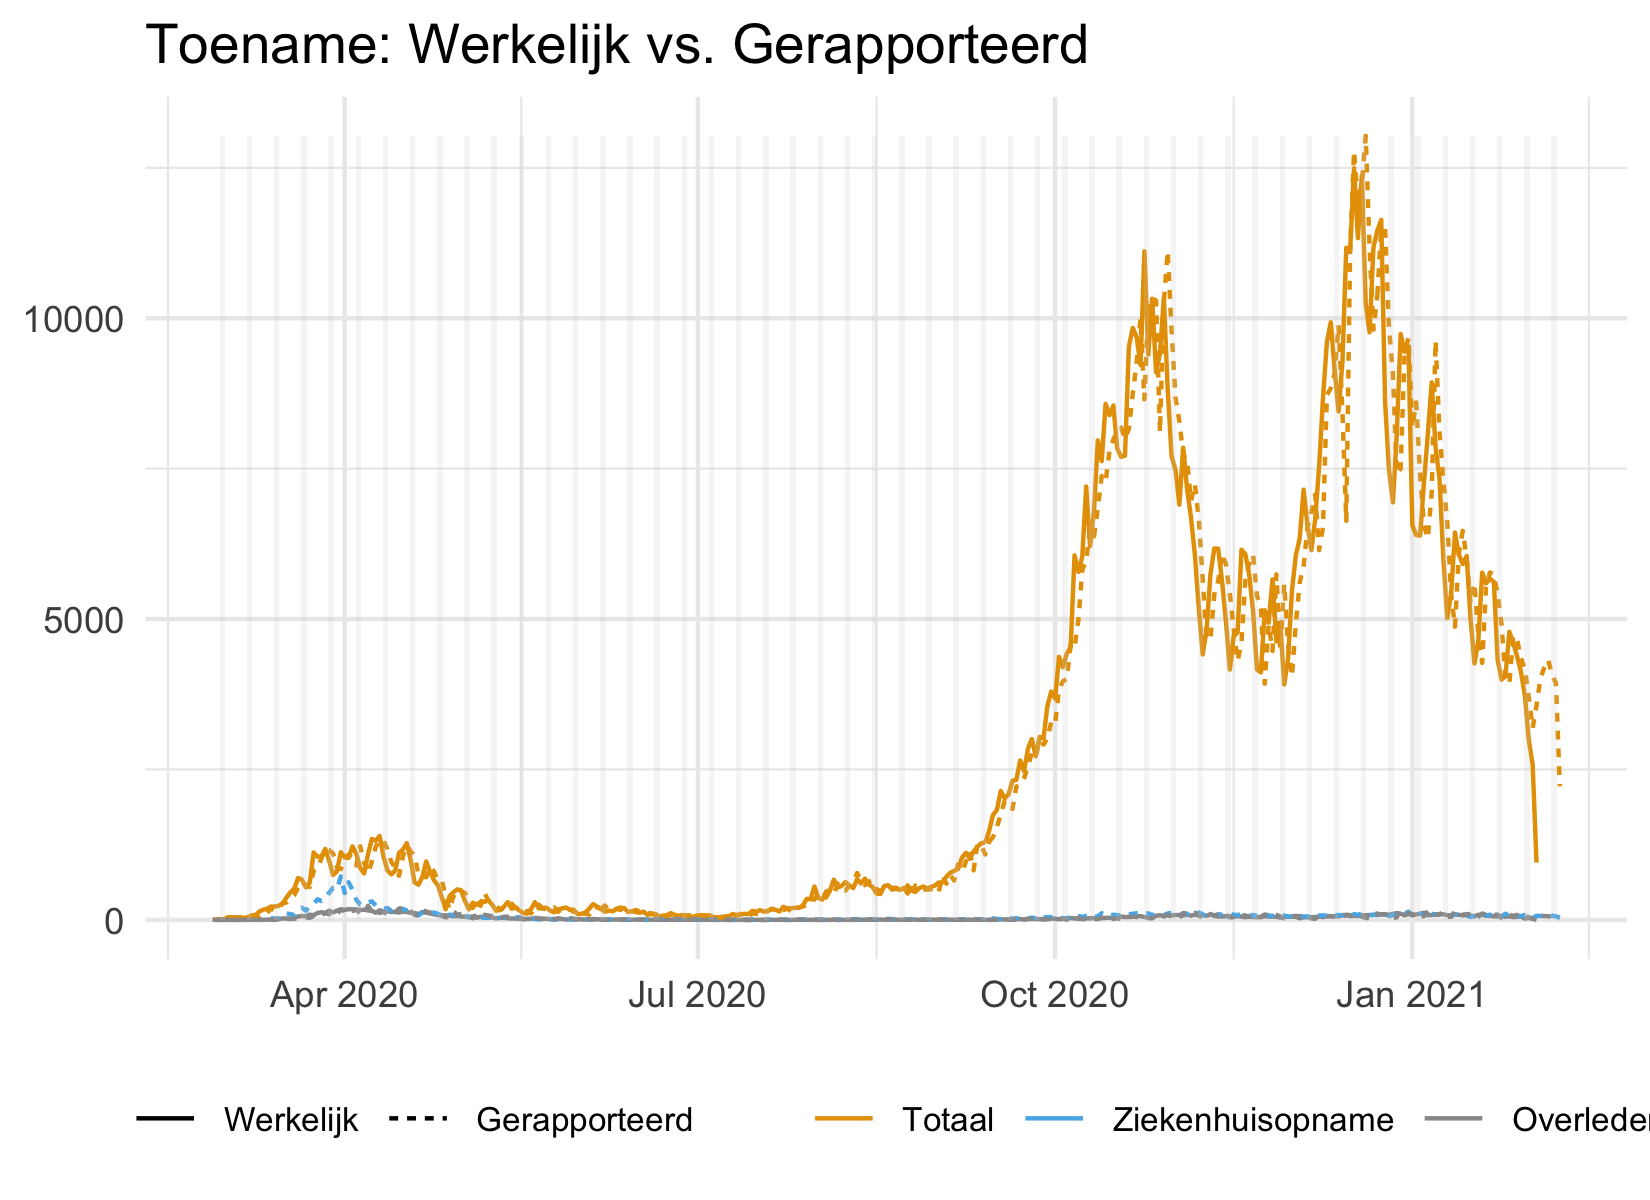
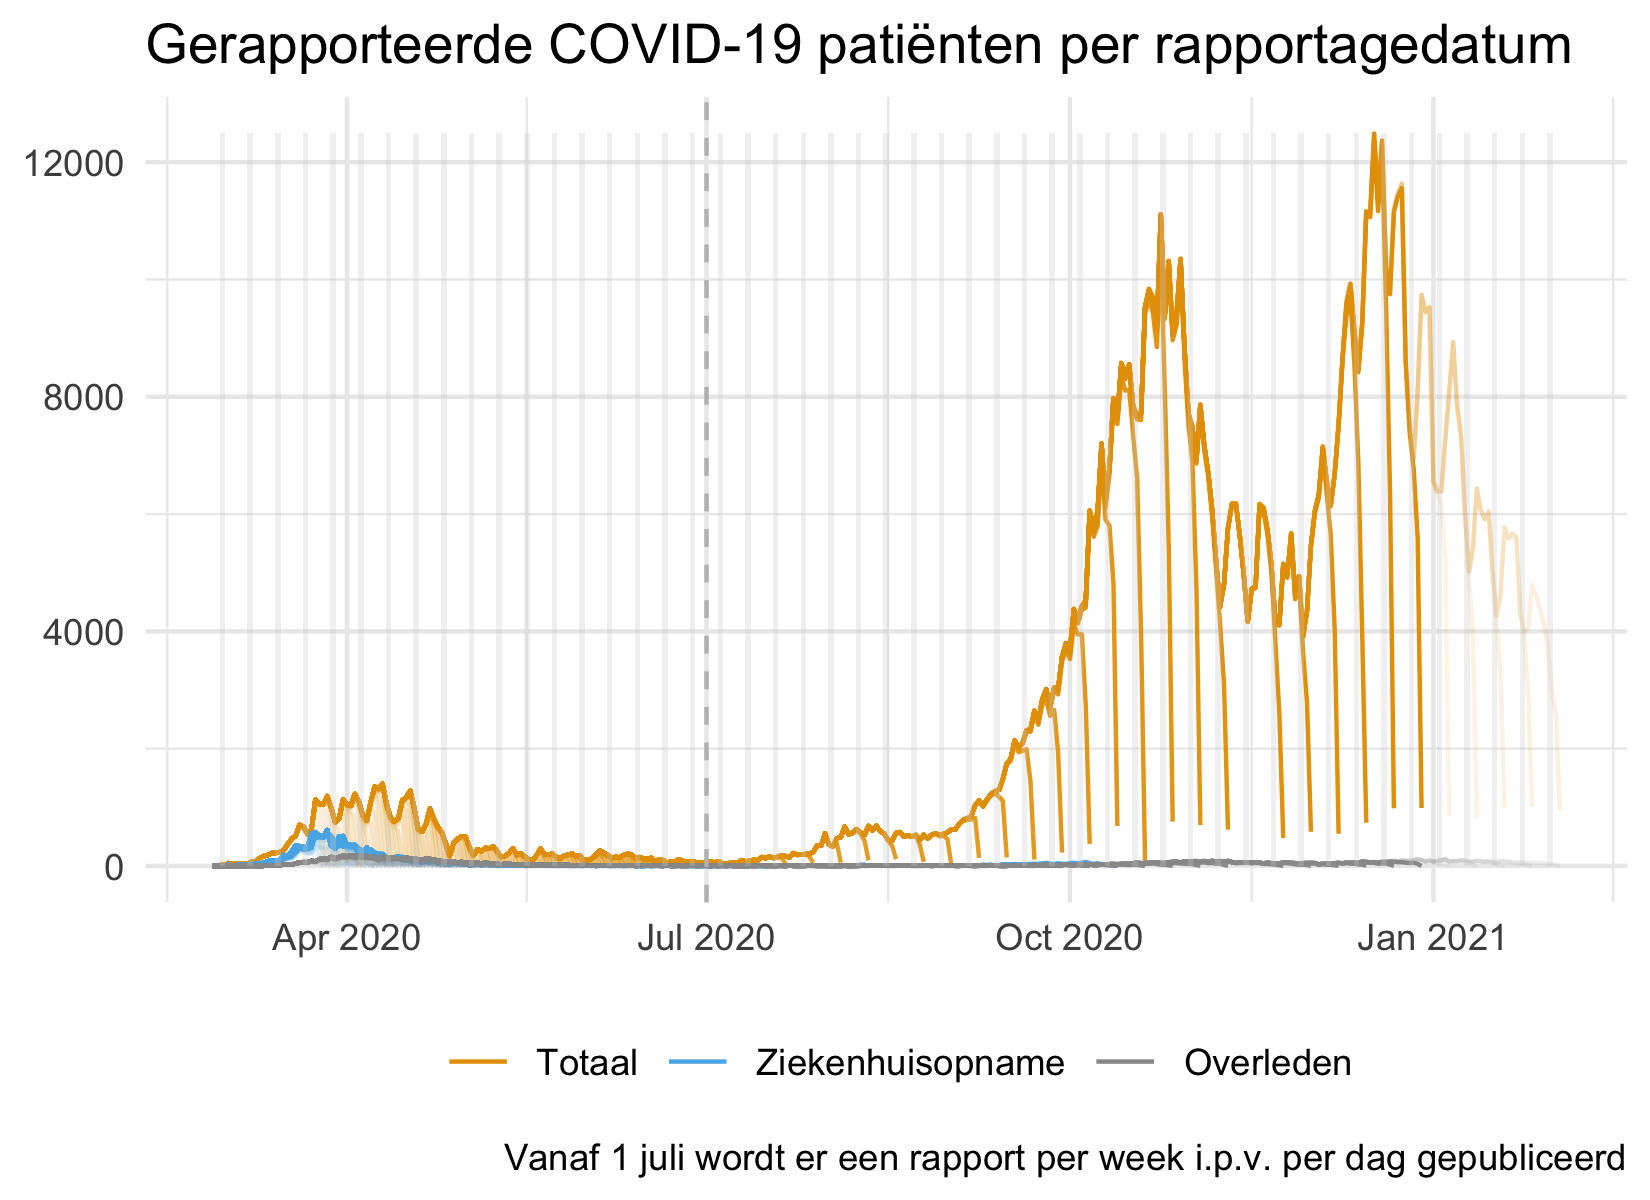
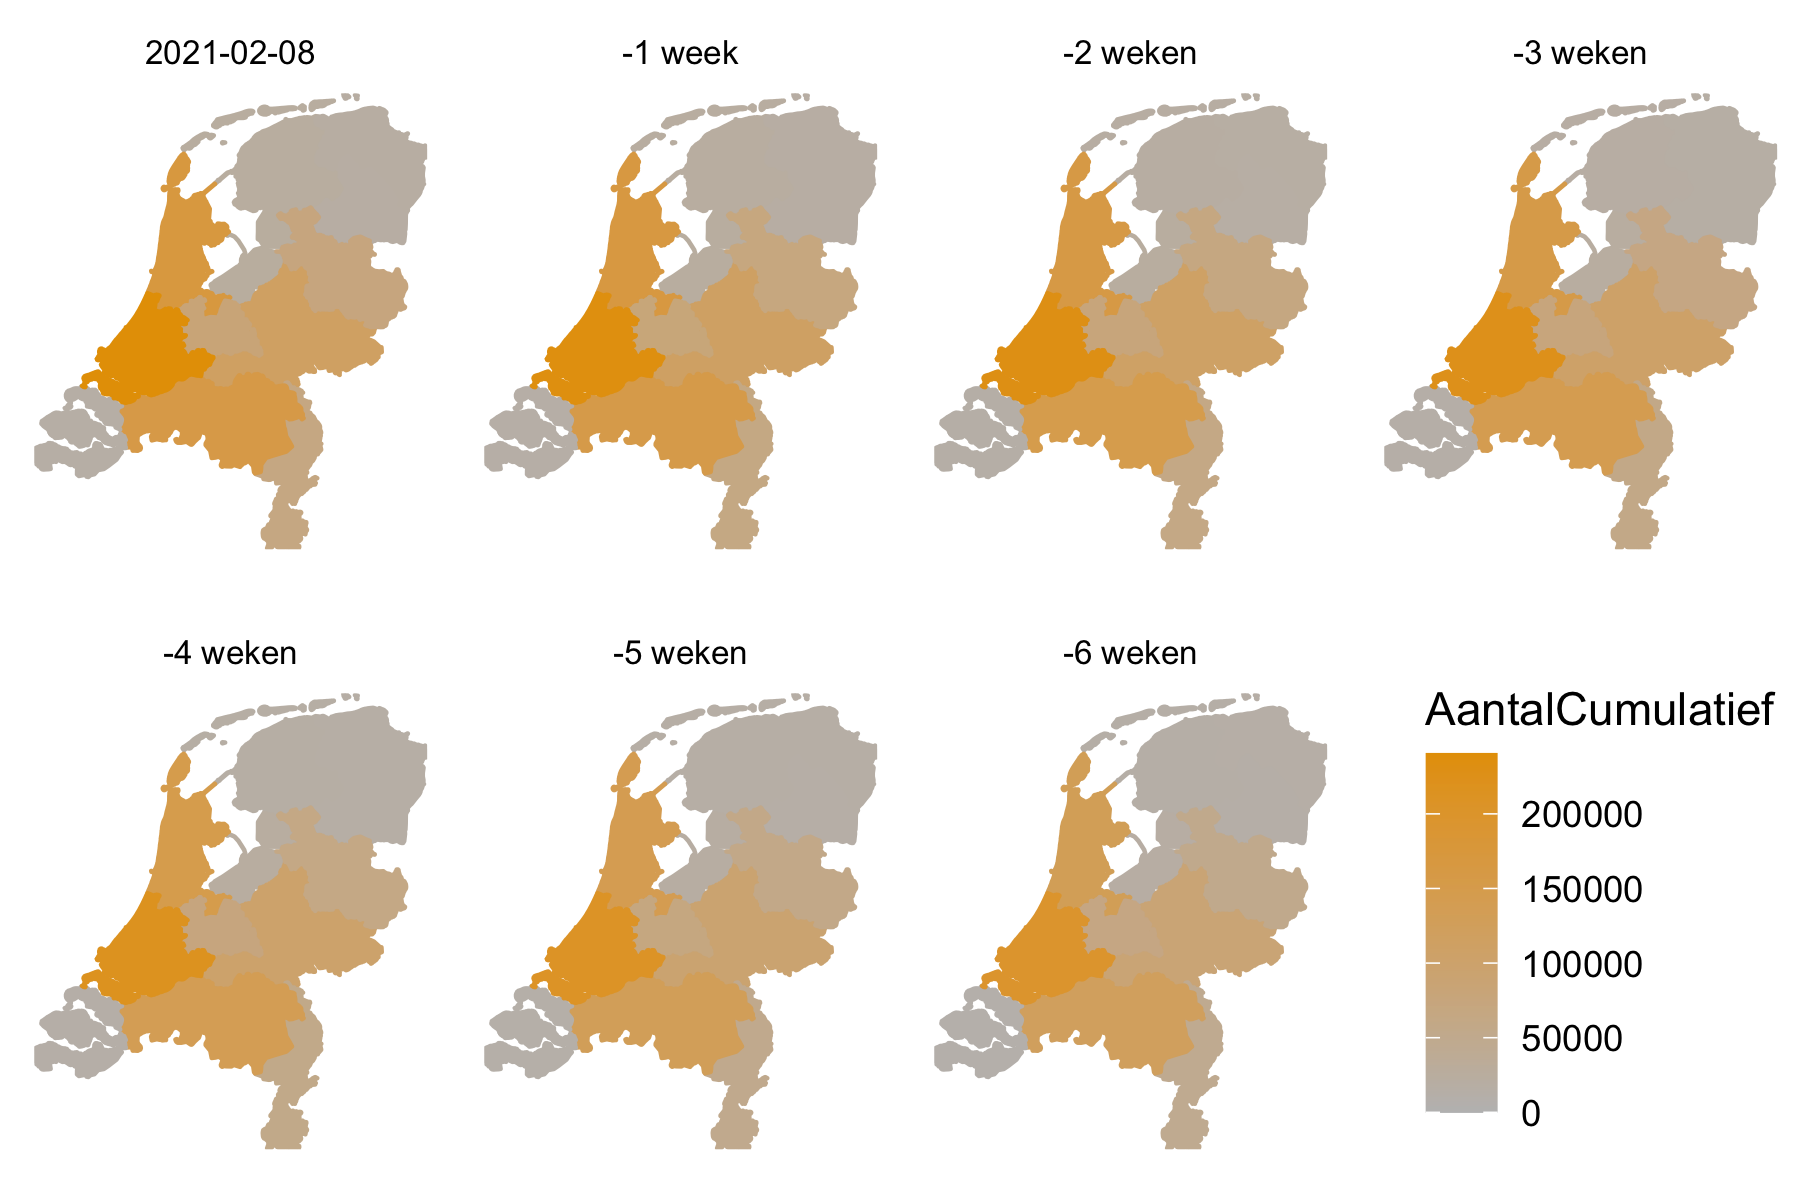
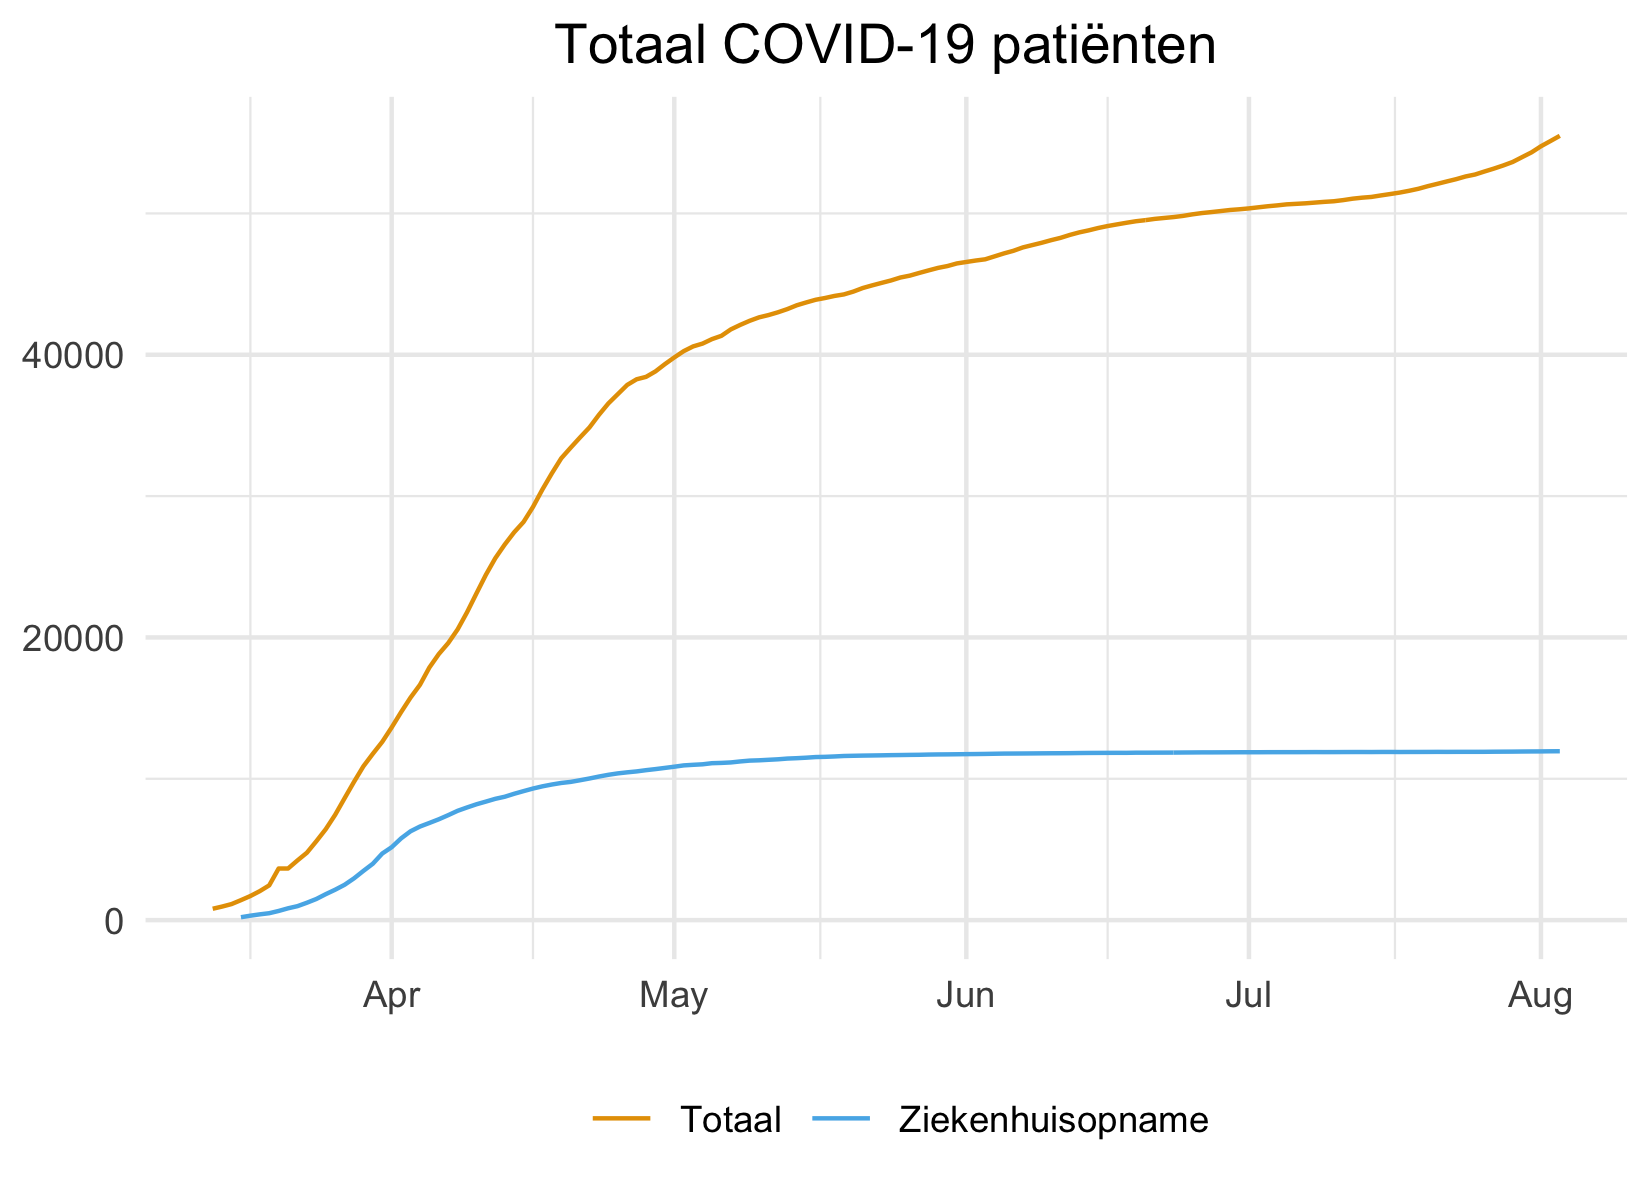
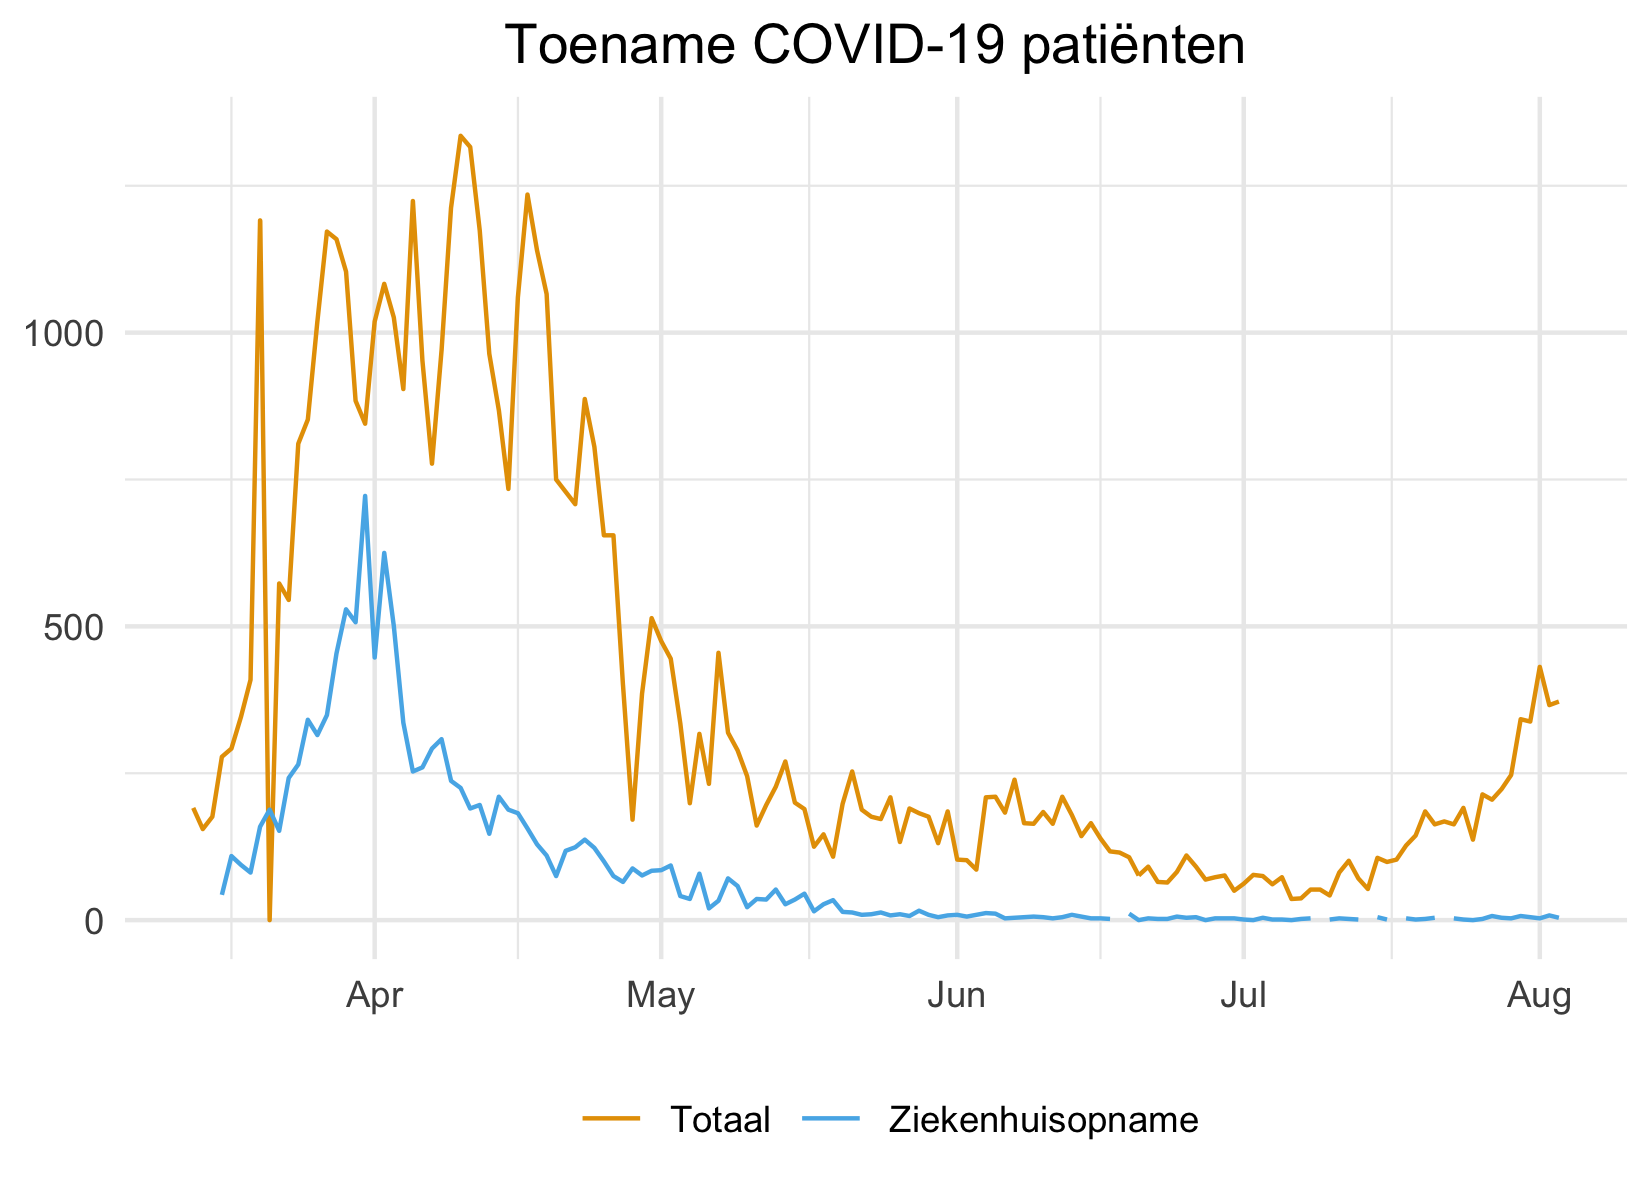
Visualizations geographical data
To get a better picture of the content of the geographical datasets, have a look at the following visuals. These visuals show the development of the COVID-19 disease outbreak on a national level.
Descriptive datasets
The datasets in this section describe the new and cumulative number of confirmed, hospitalized, and deceased COVID-19 cases per day and contain variables like age and sex.
For more detail about the specific structure of these descriptive datasets, have a look at the data-desccodebook.
| Dataset | Source | Variables |
|---|---|---|
| Case counts in NL per age | RIVM | Date, Age group, Type (Total, hopitalized and deceased COVID-19 cases), (Cumulative) Count |
| Case counts in NL per sex | RIVM | Date, Sex, Type (Total, hopitalized and deceased COVID-19 cases), (Cumulative) Count |
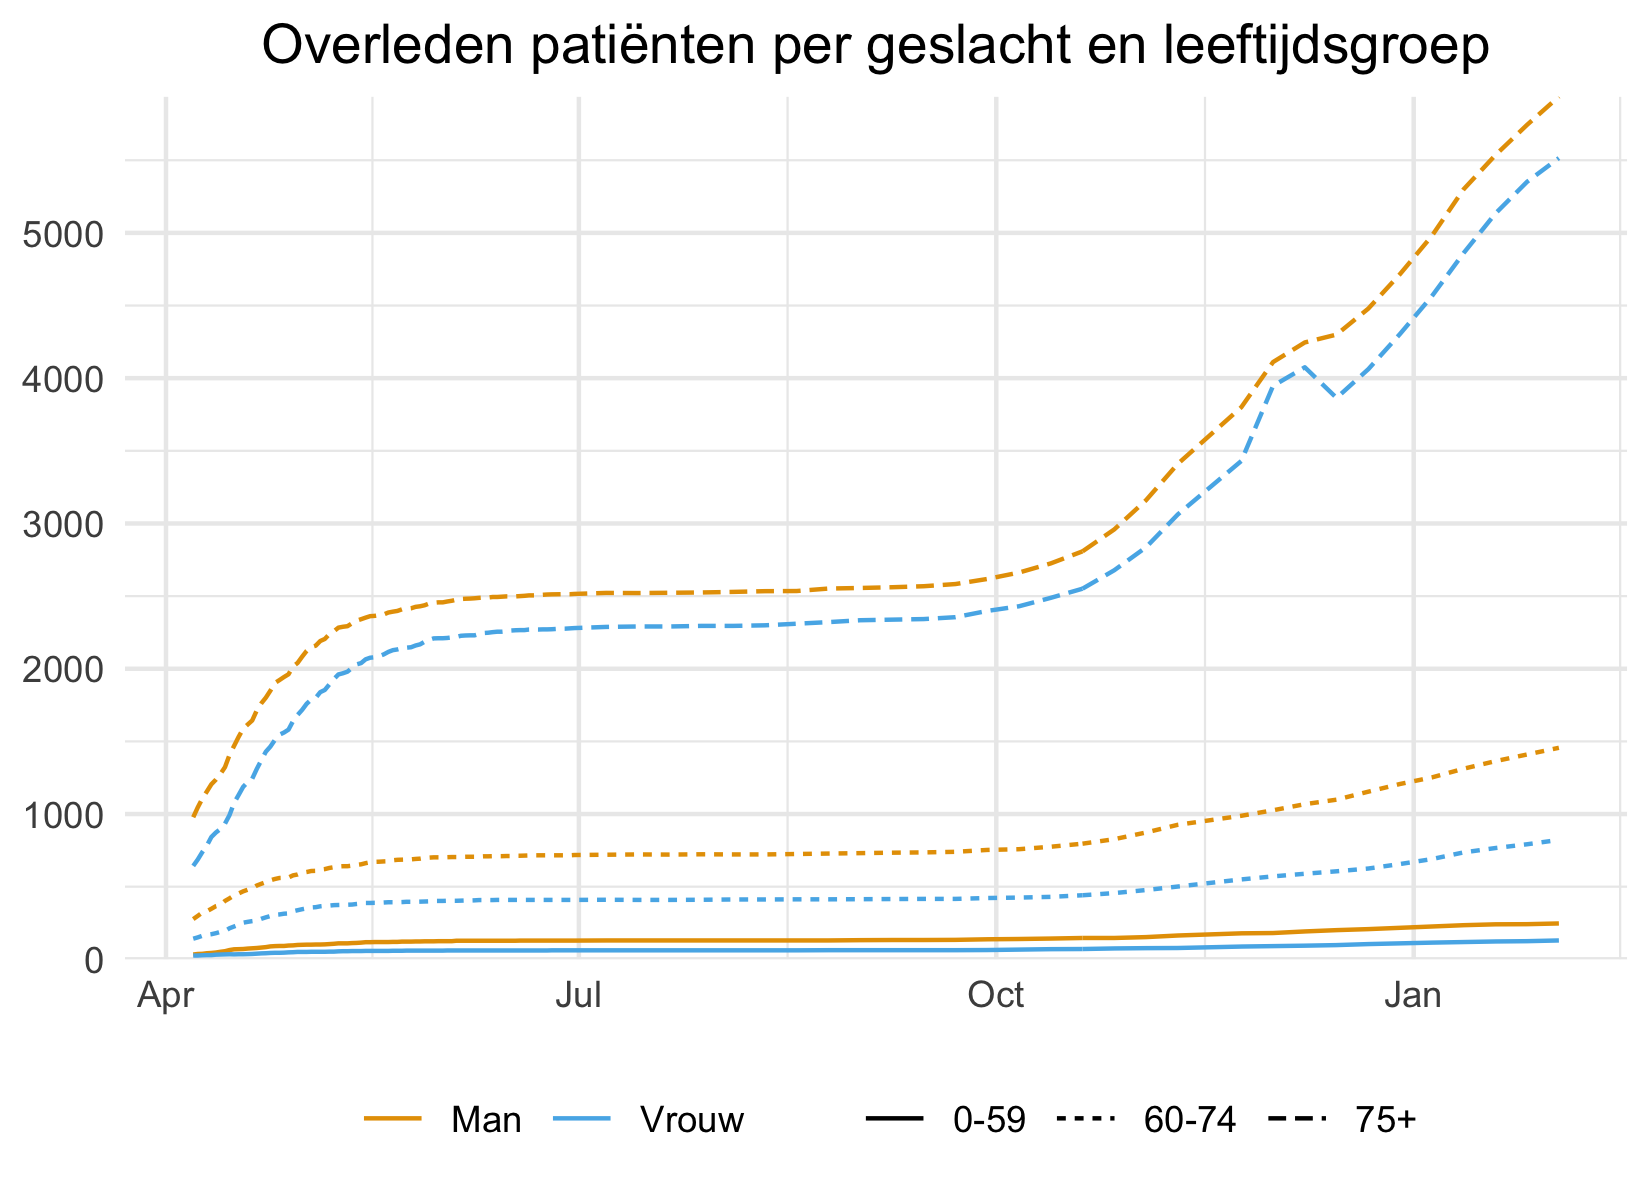
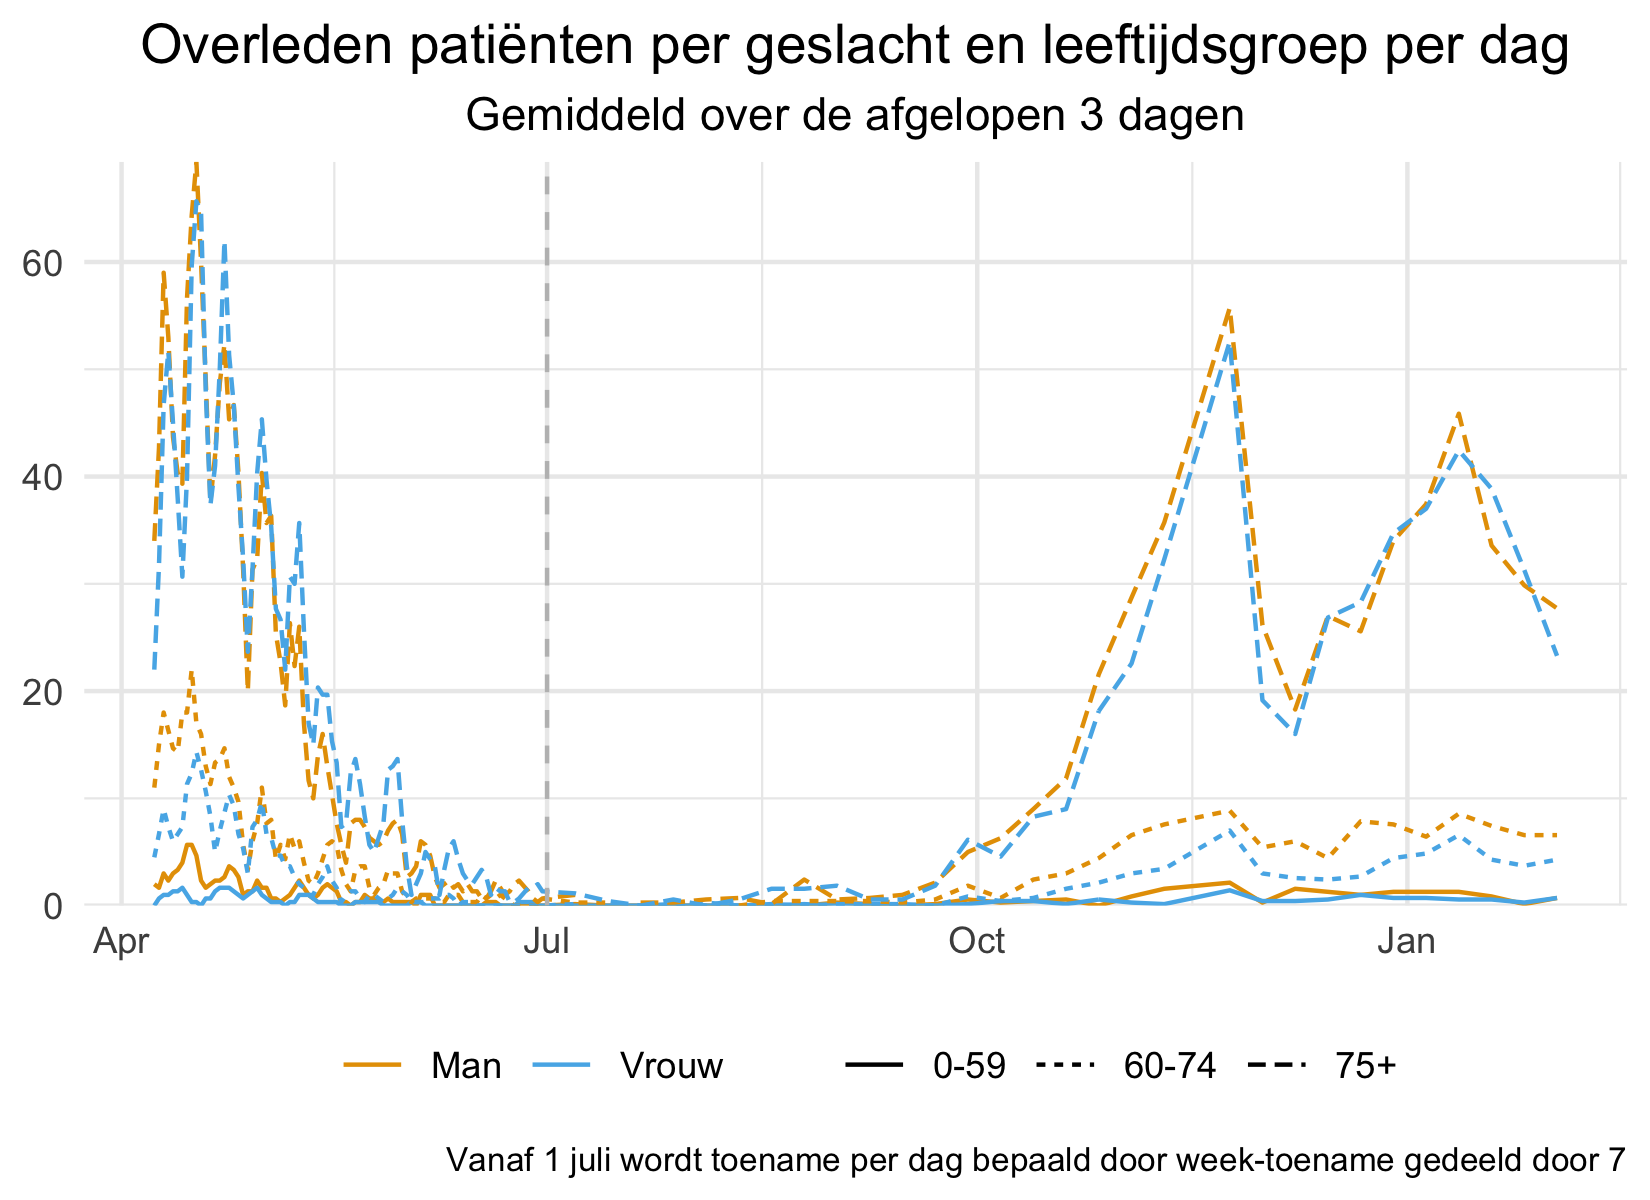
| Deceased case counts in NL per sex and age group | RIVM | Date, Age group, Sex, (Cumulative) Count of deceased cases |
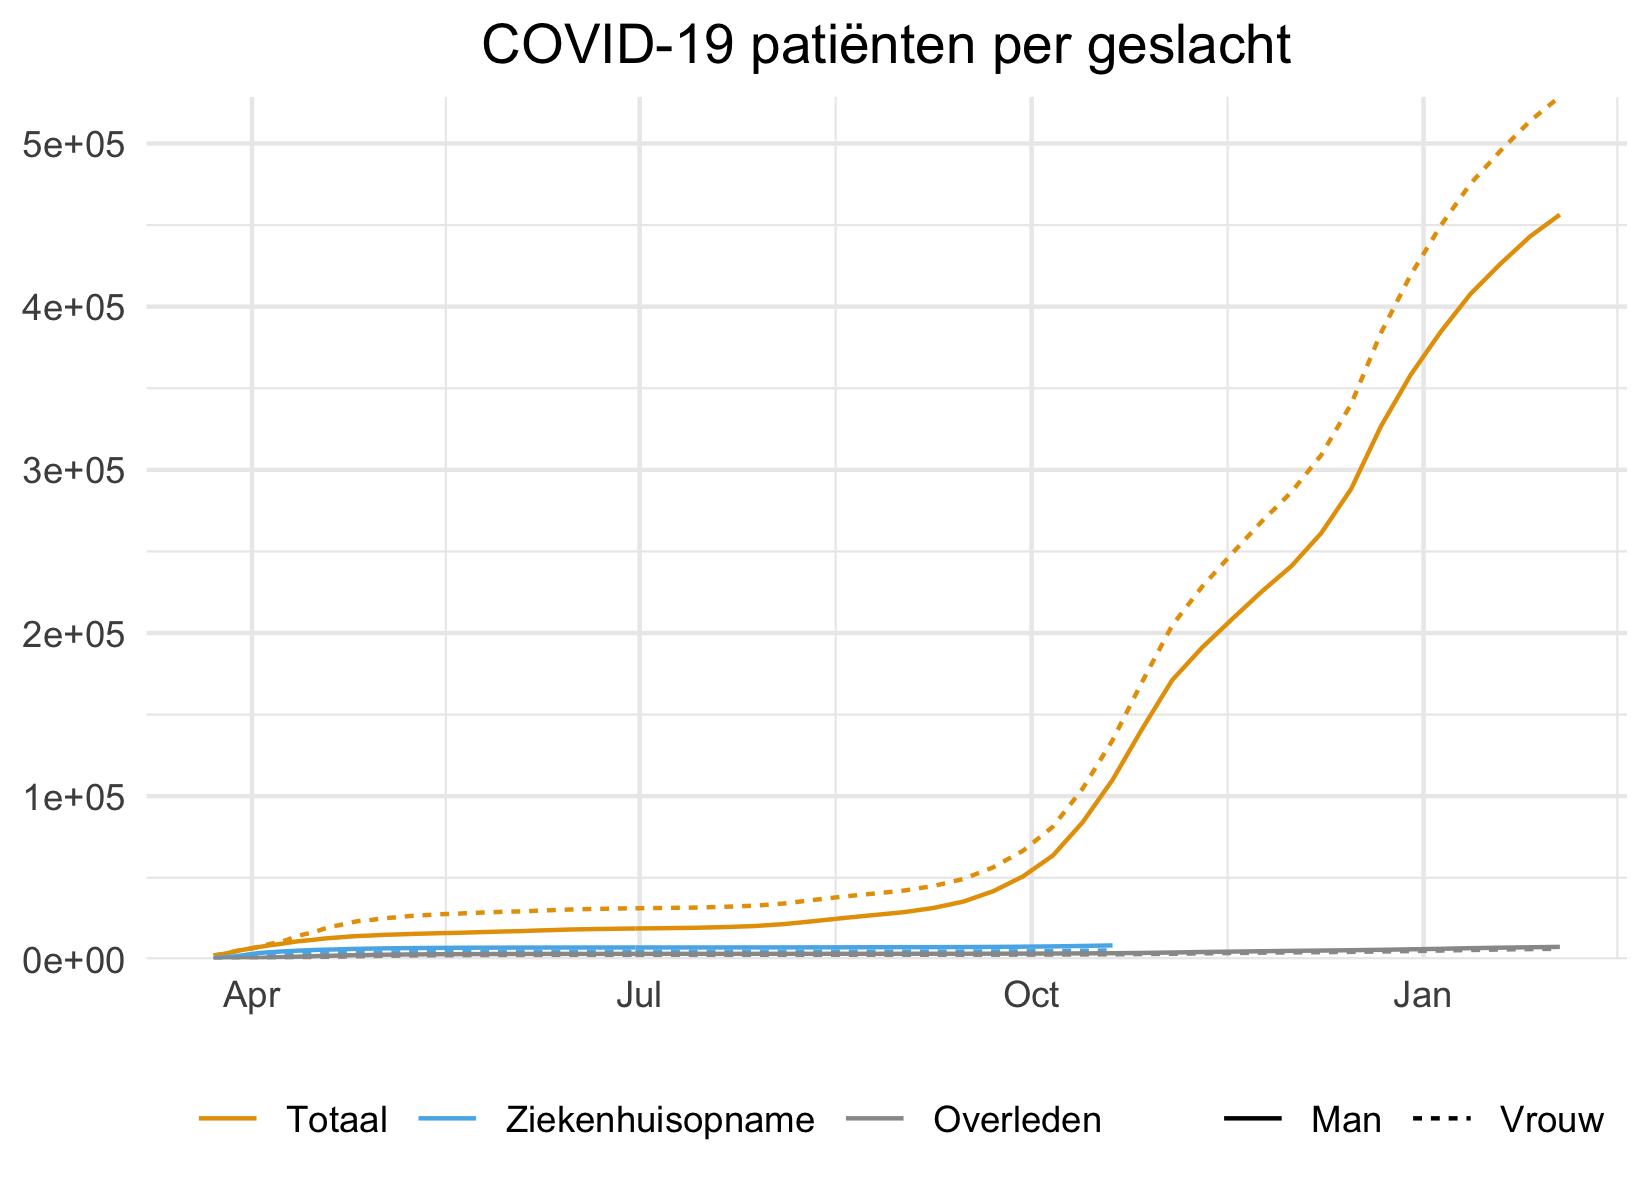
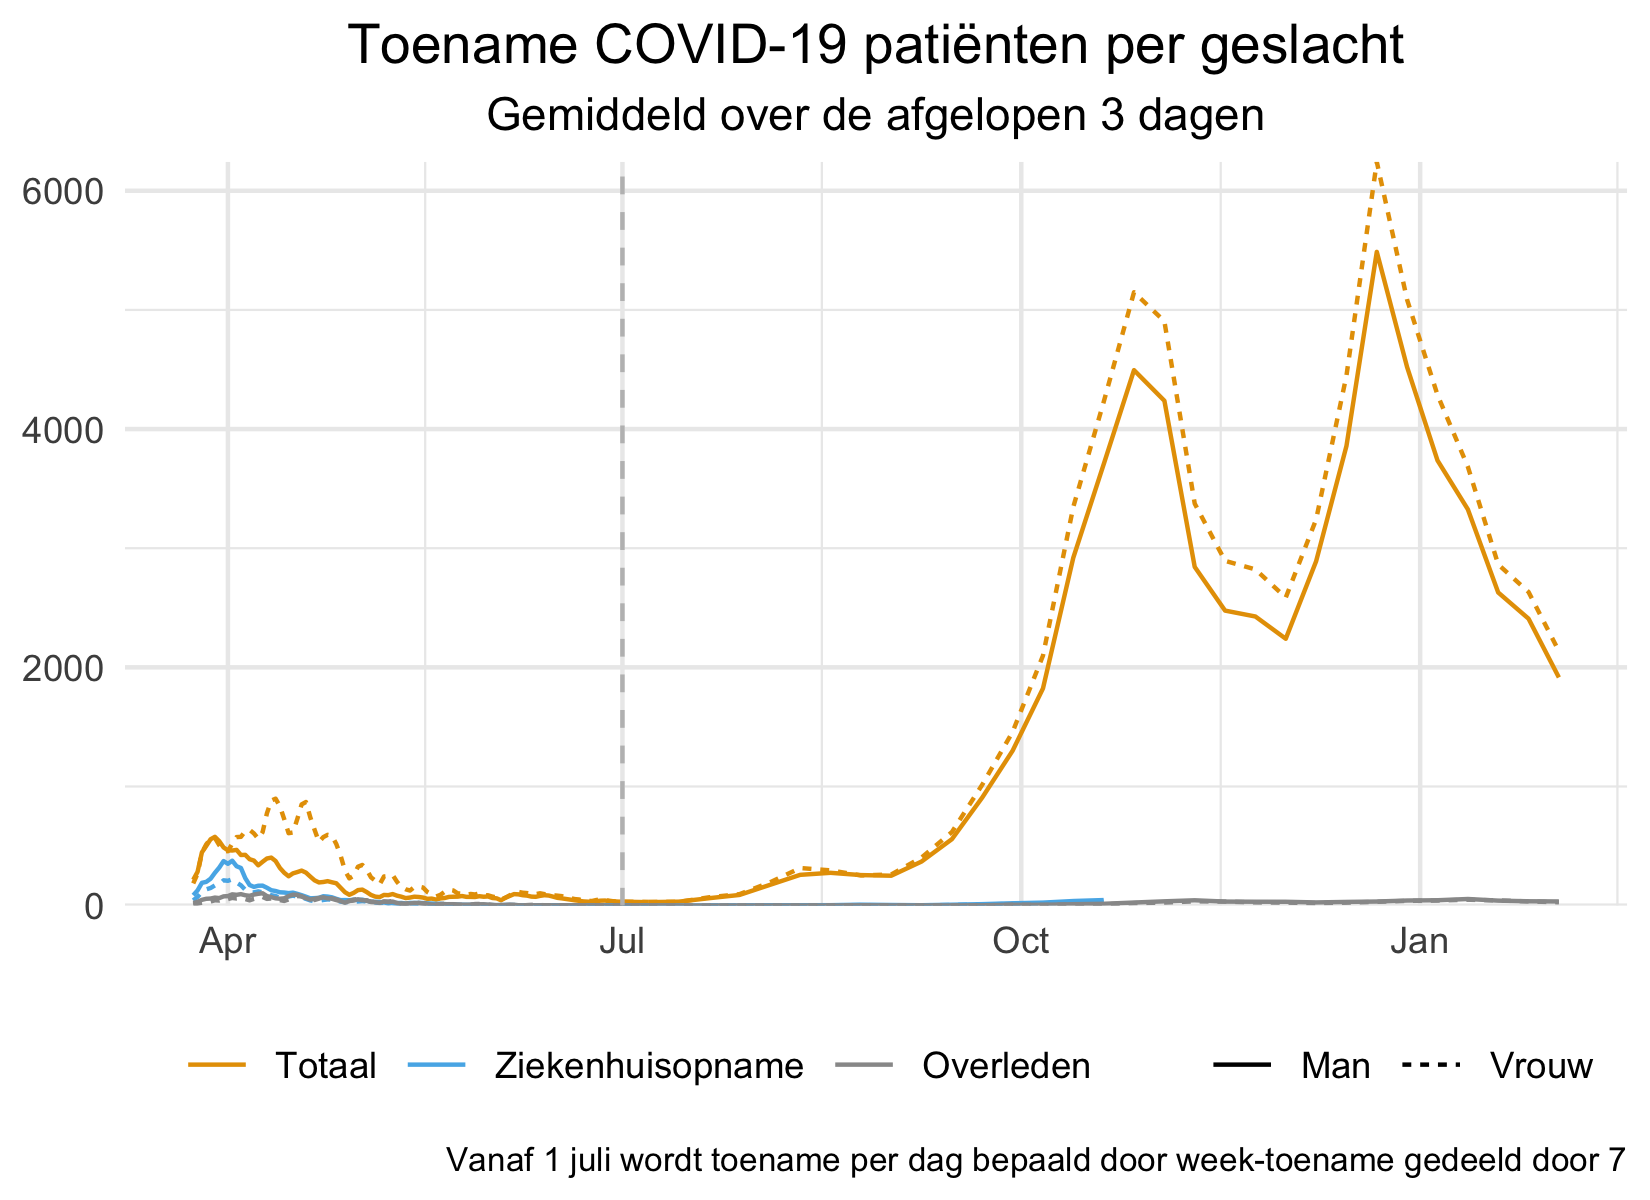
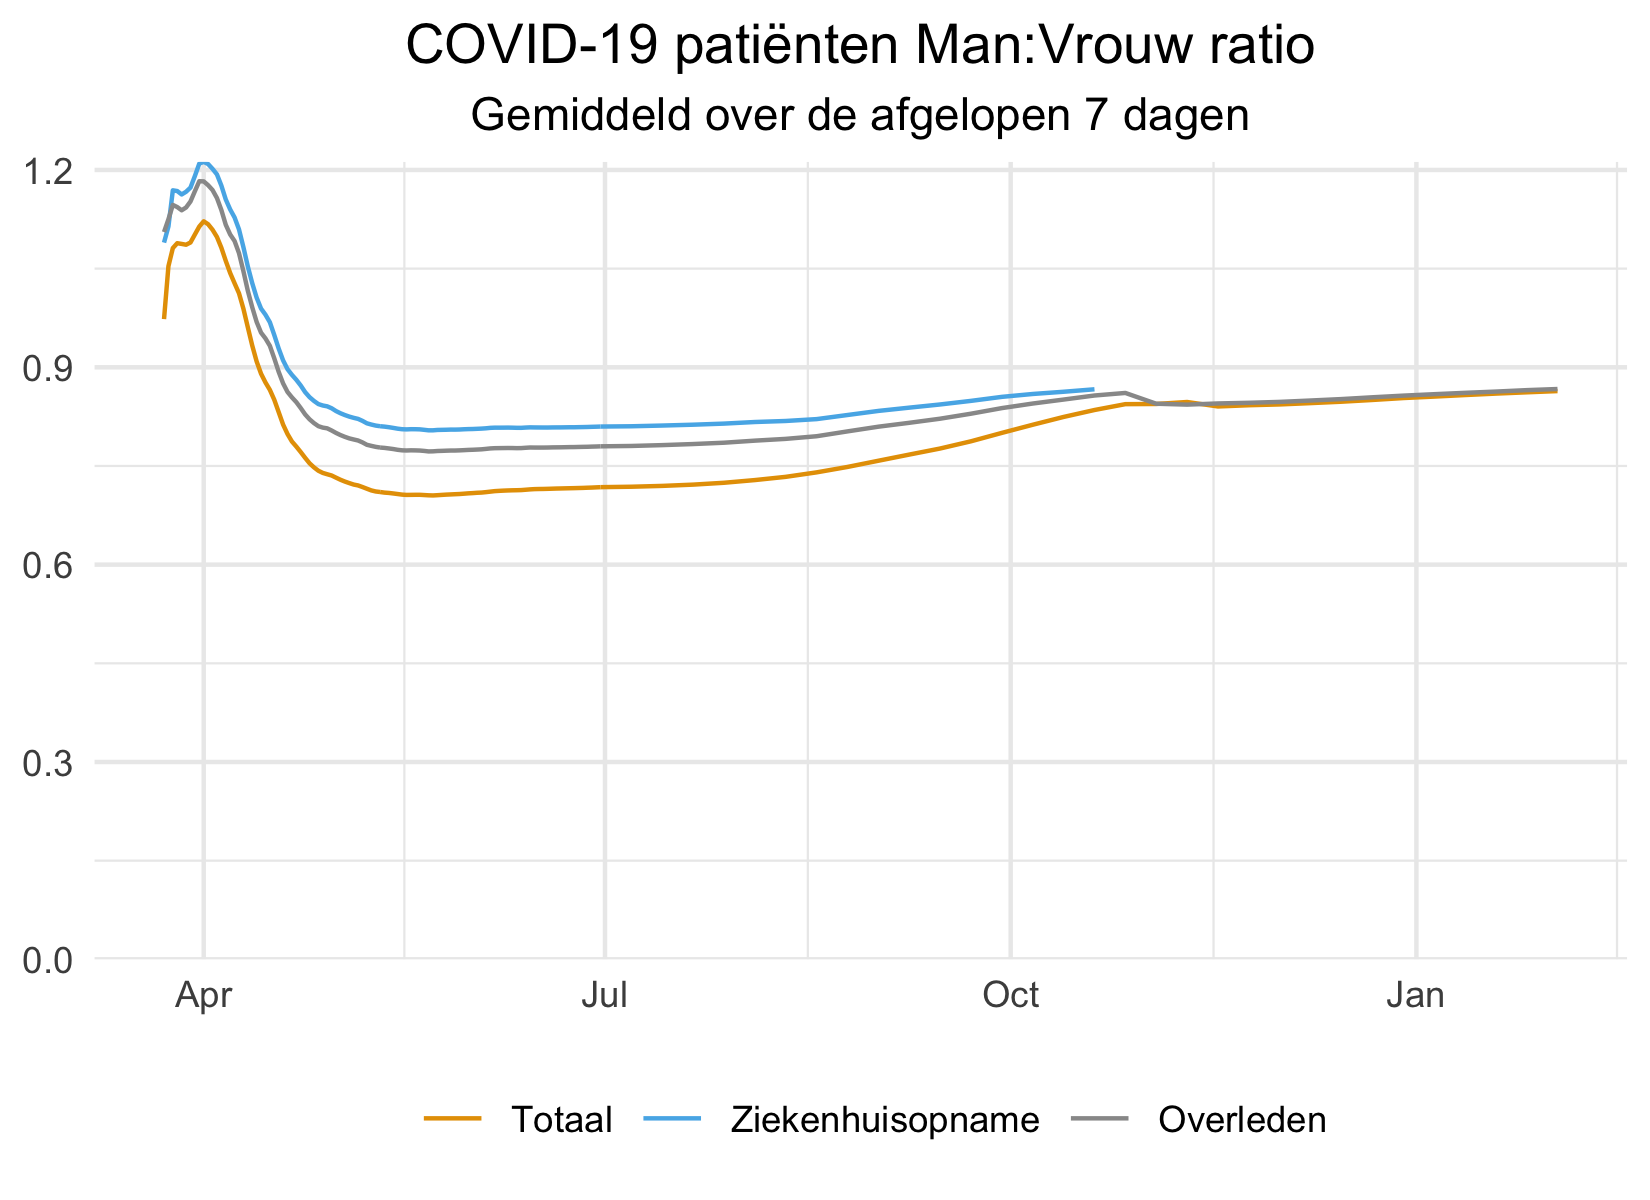
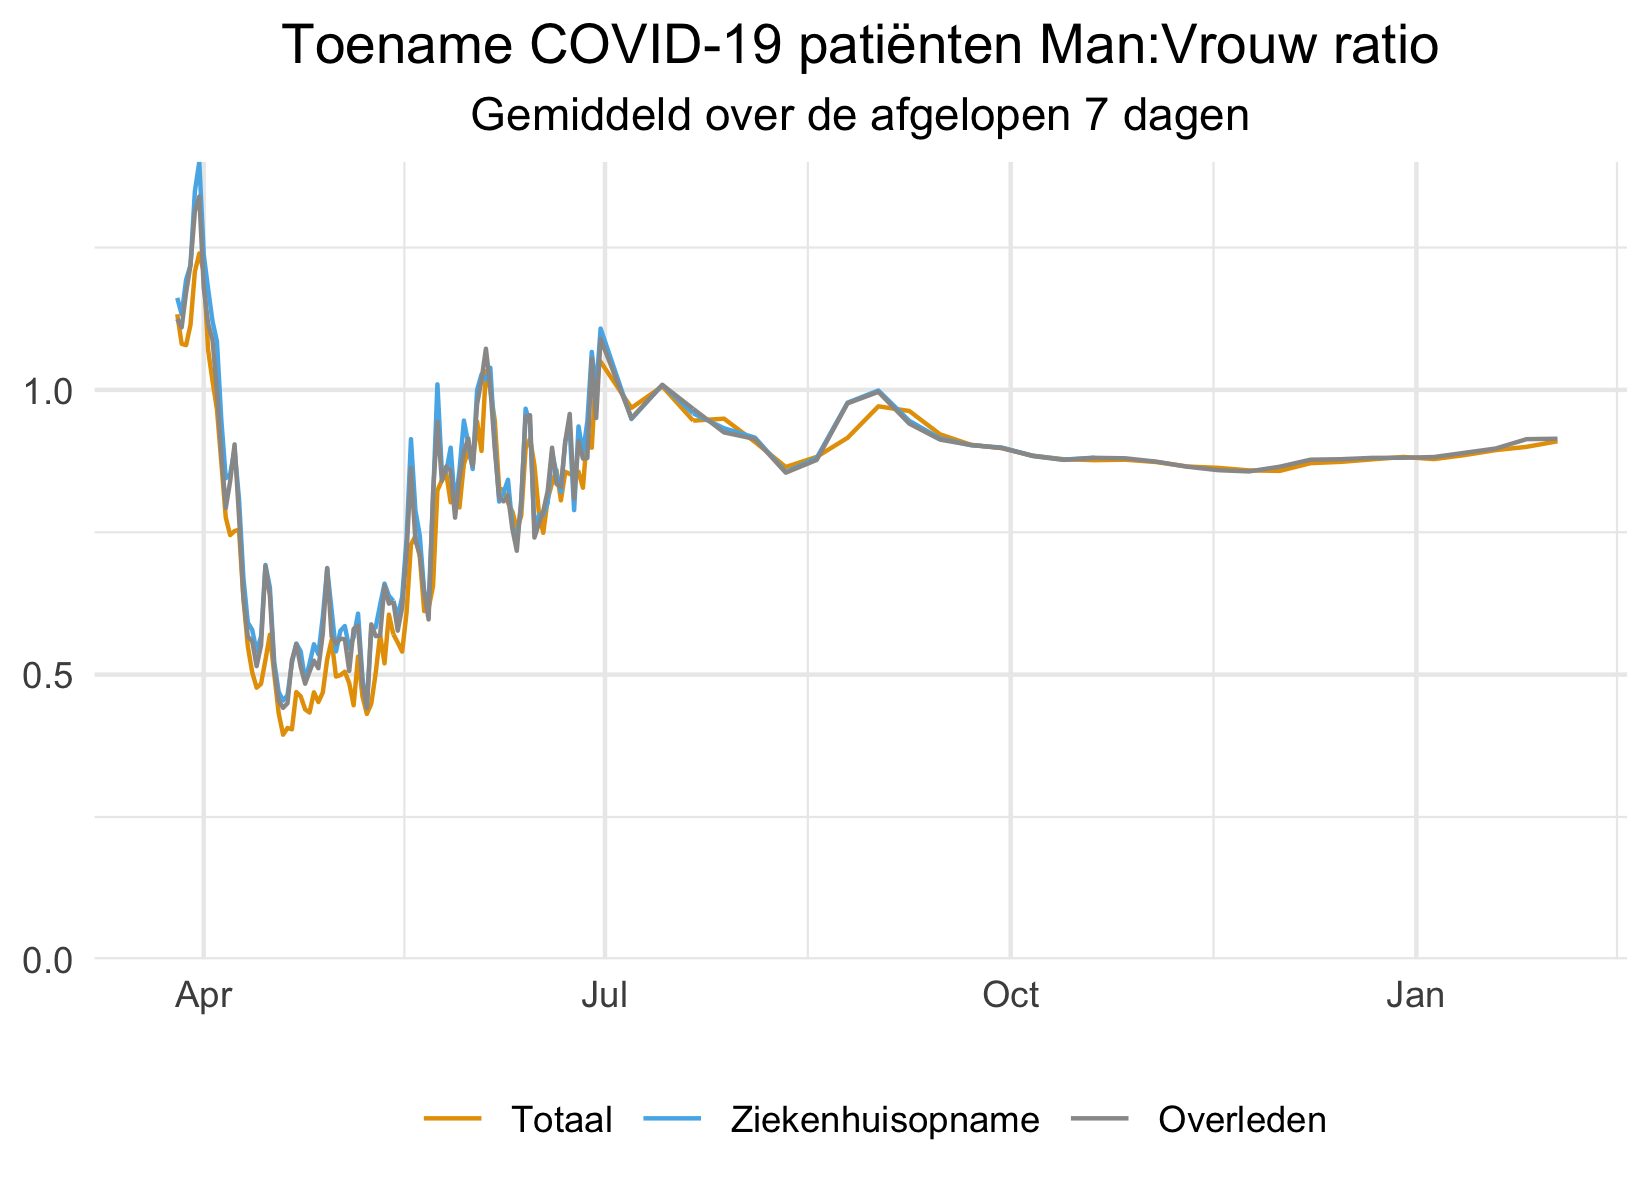
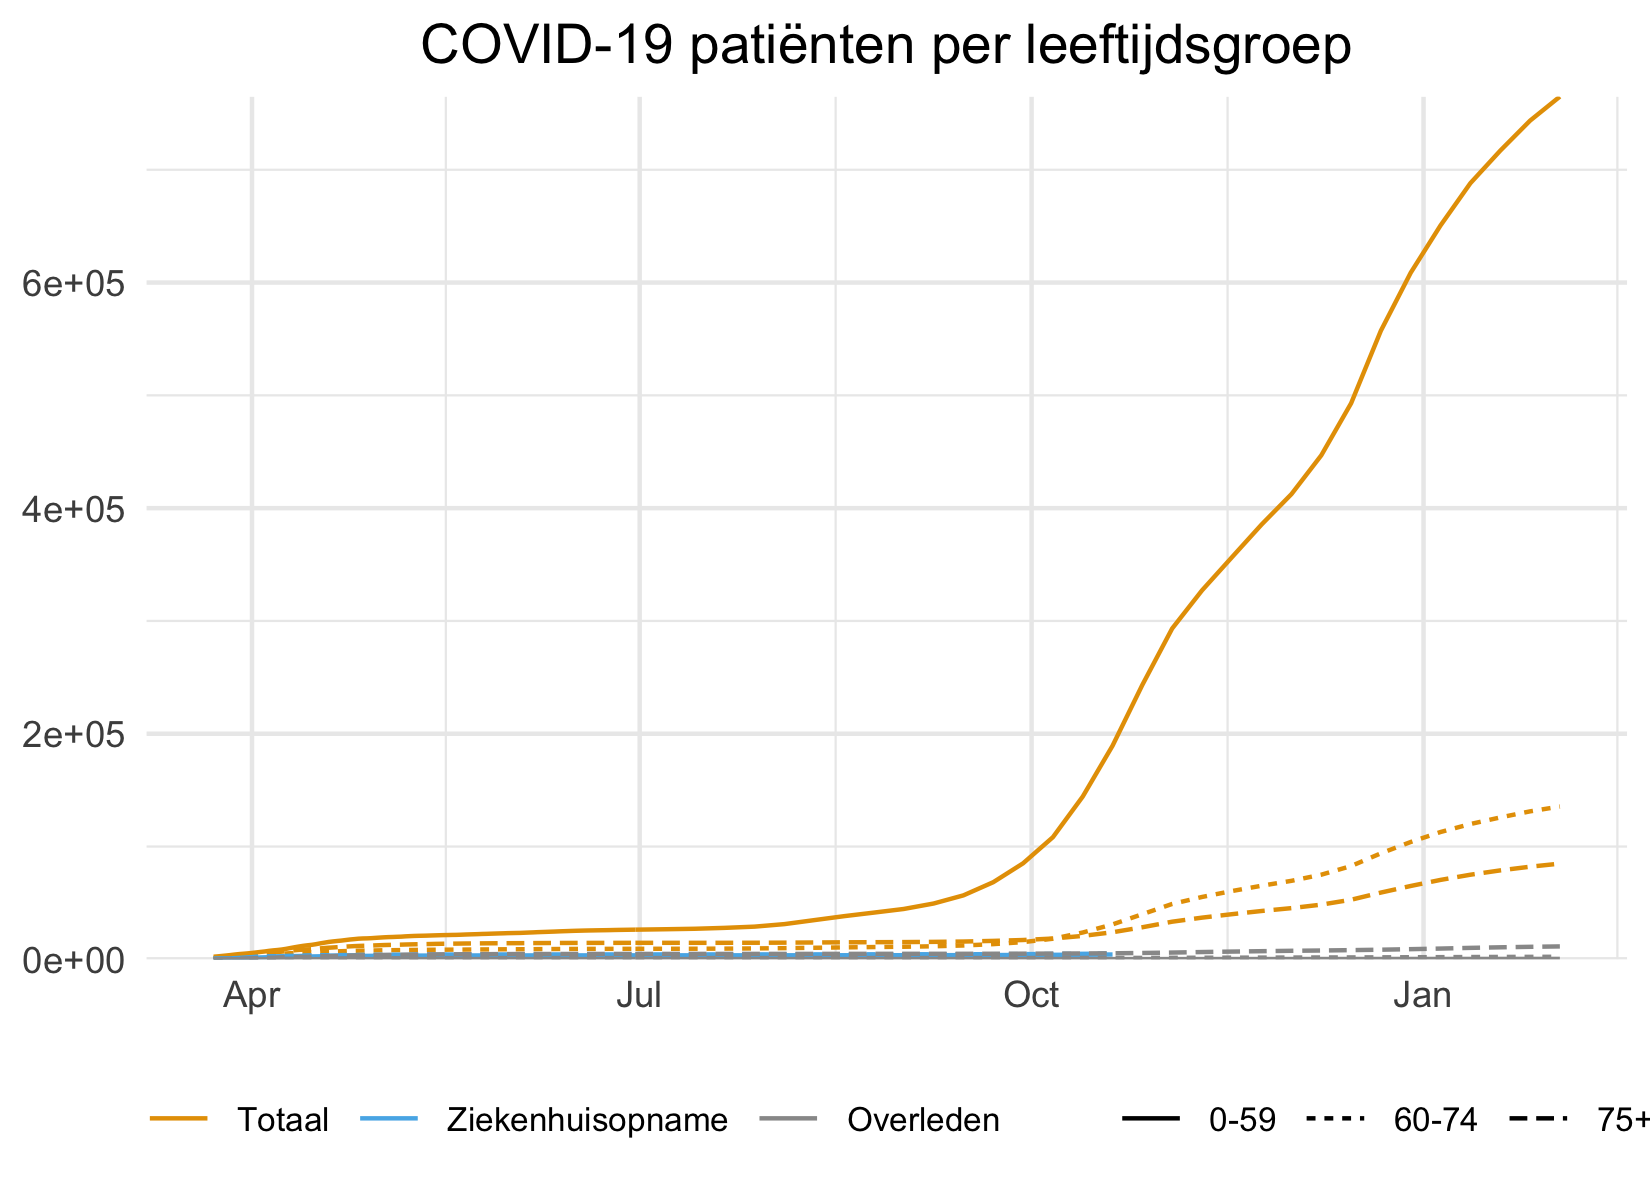
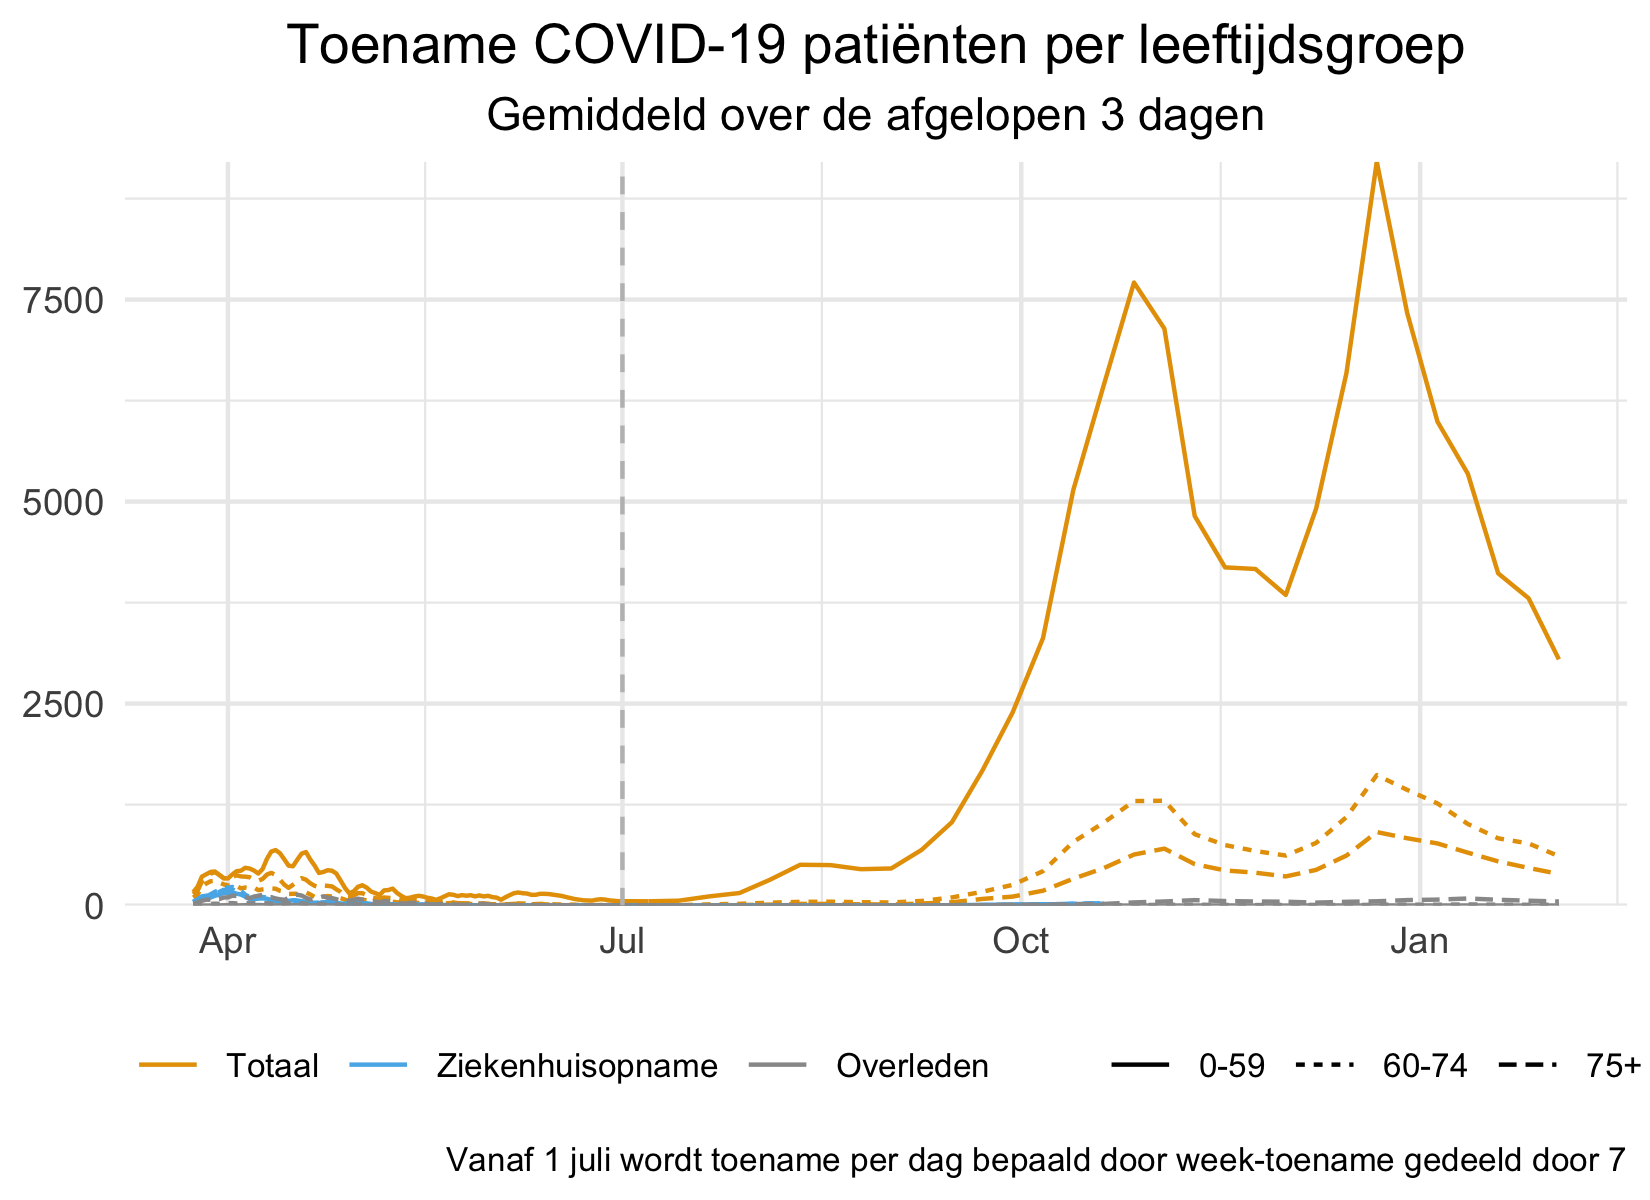
Visualizations descriptive data
The graphs below visualize the development of the COVID-19 disease outbreak per sex and age group.
Intensive care datasets
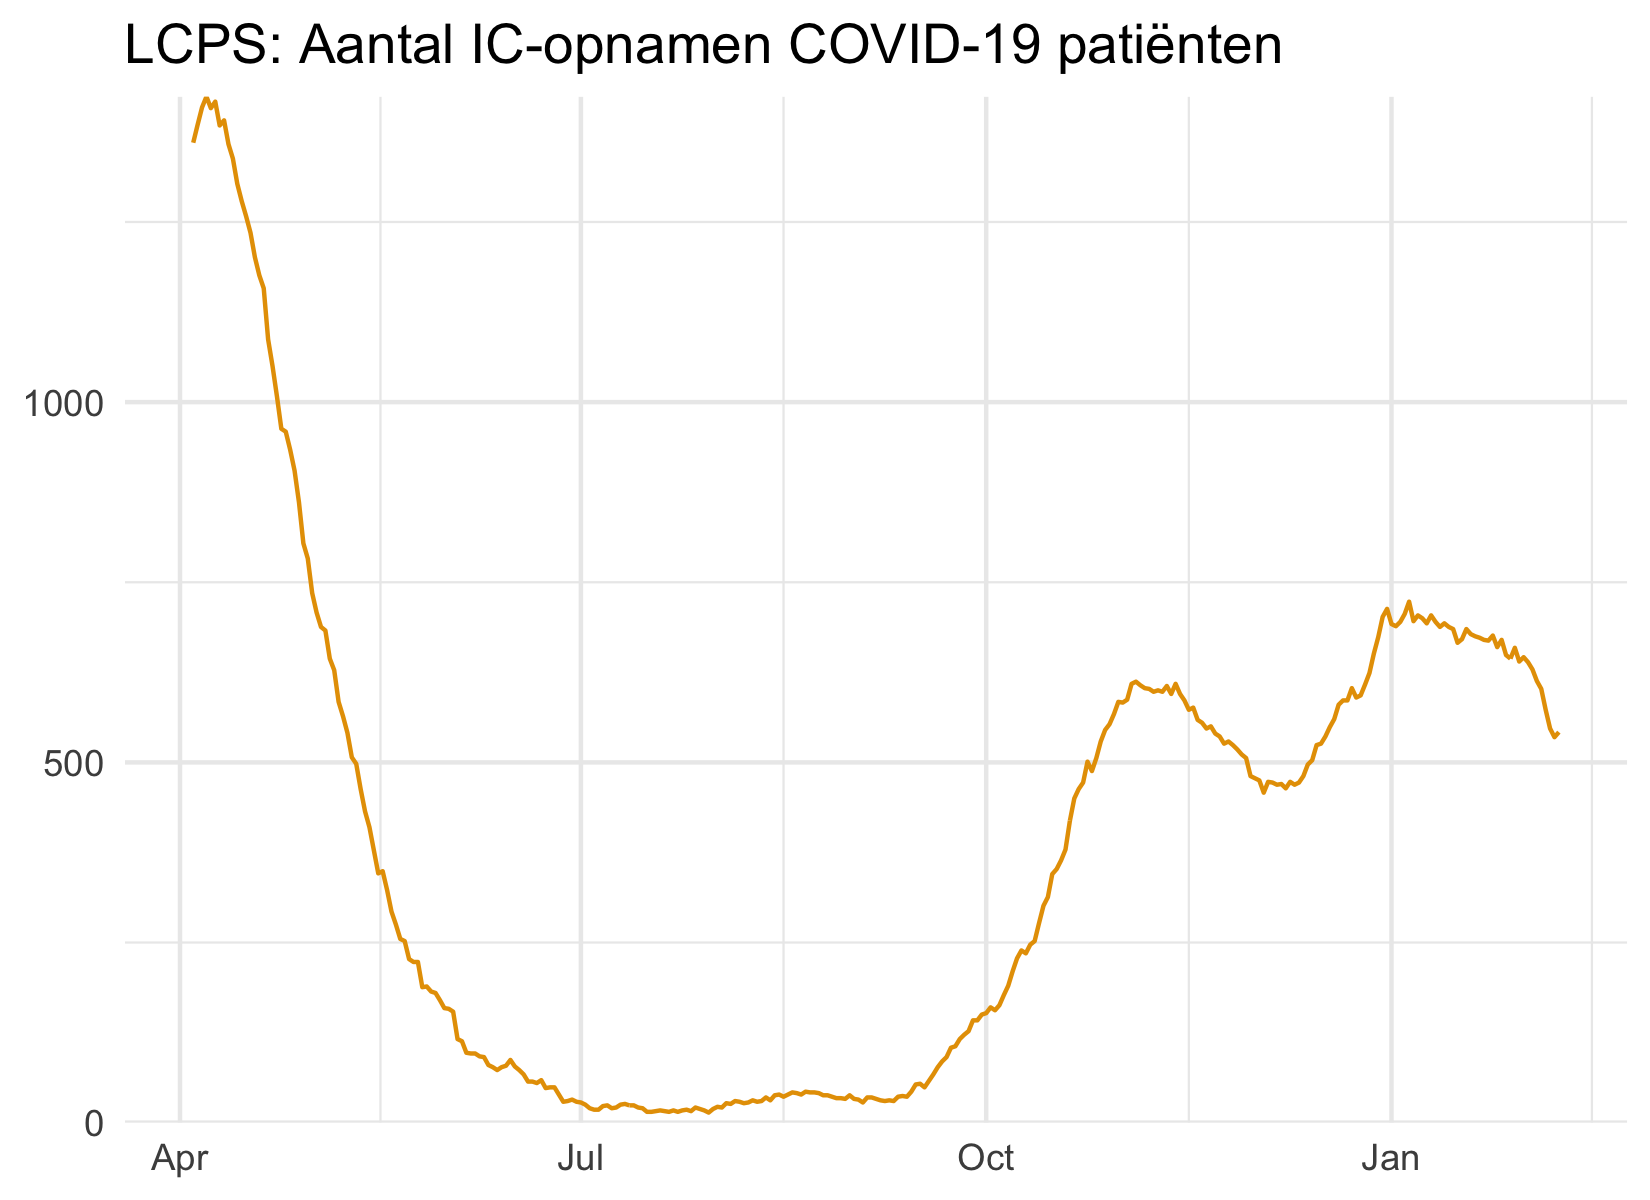
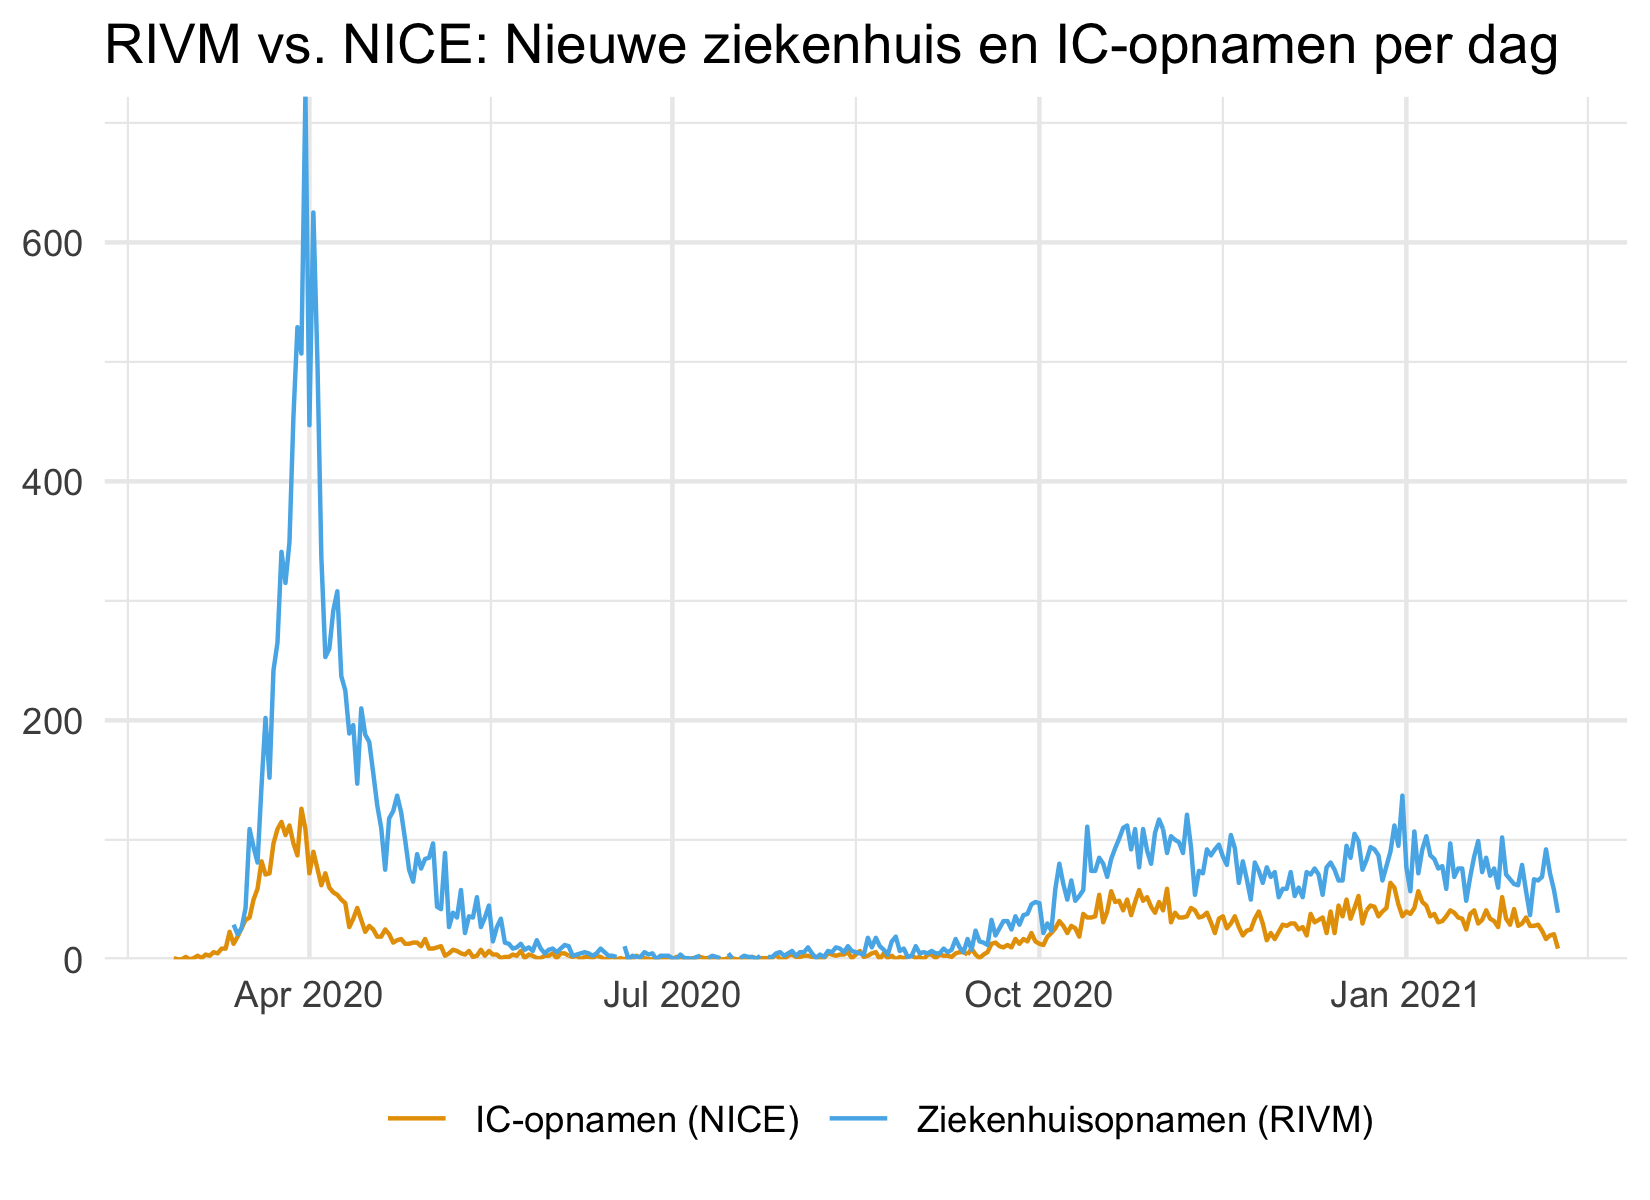
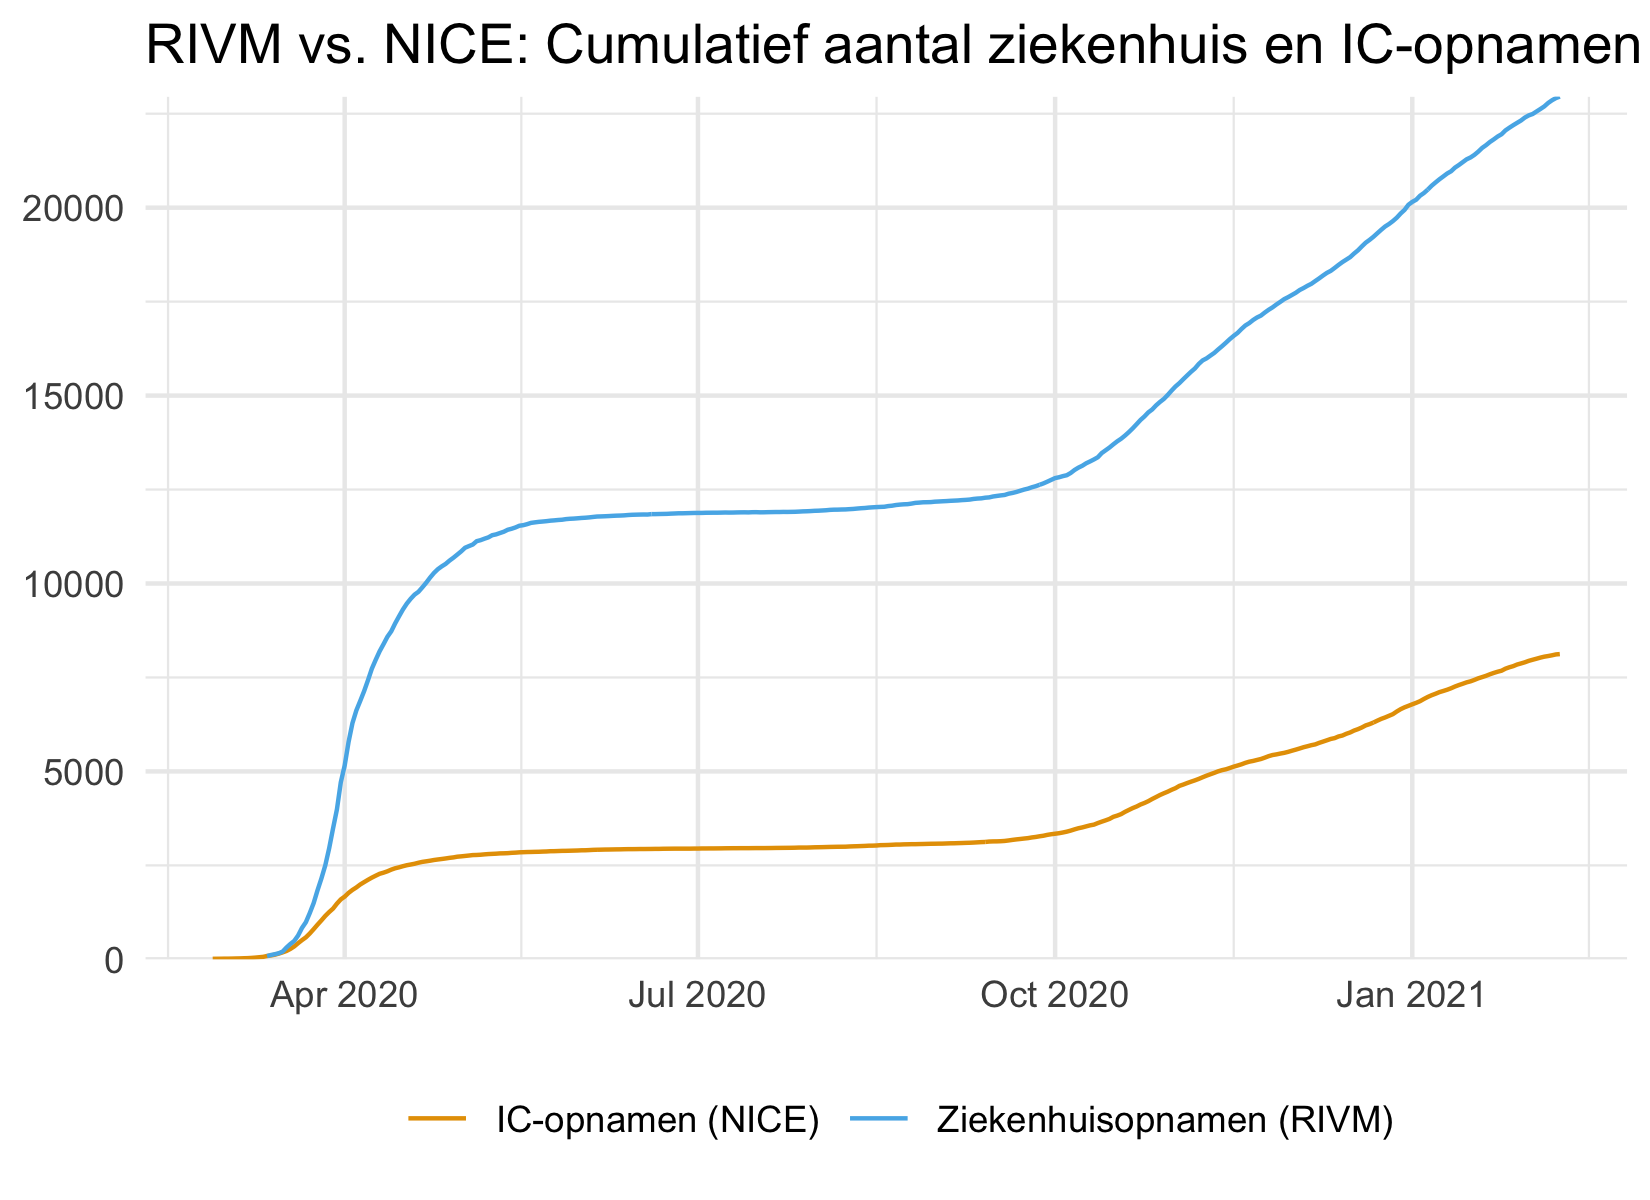
The intensive care datasets describe the new and cumulative number of COVID-19 intensive care unit (ICU) admissions per day. The datasets are categorized by their source. Compared to RIVM (reporting COVID-19 hospital admissions), CoronaWatchNL collects COVID-19 related intensive care data from LCPS and NICE.
- RIVM reports hospitalized COVID-19 cases, including - but not limited to - the intensive care unit (ICU) admissions. These are the largest numbers and most inclusive counts.
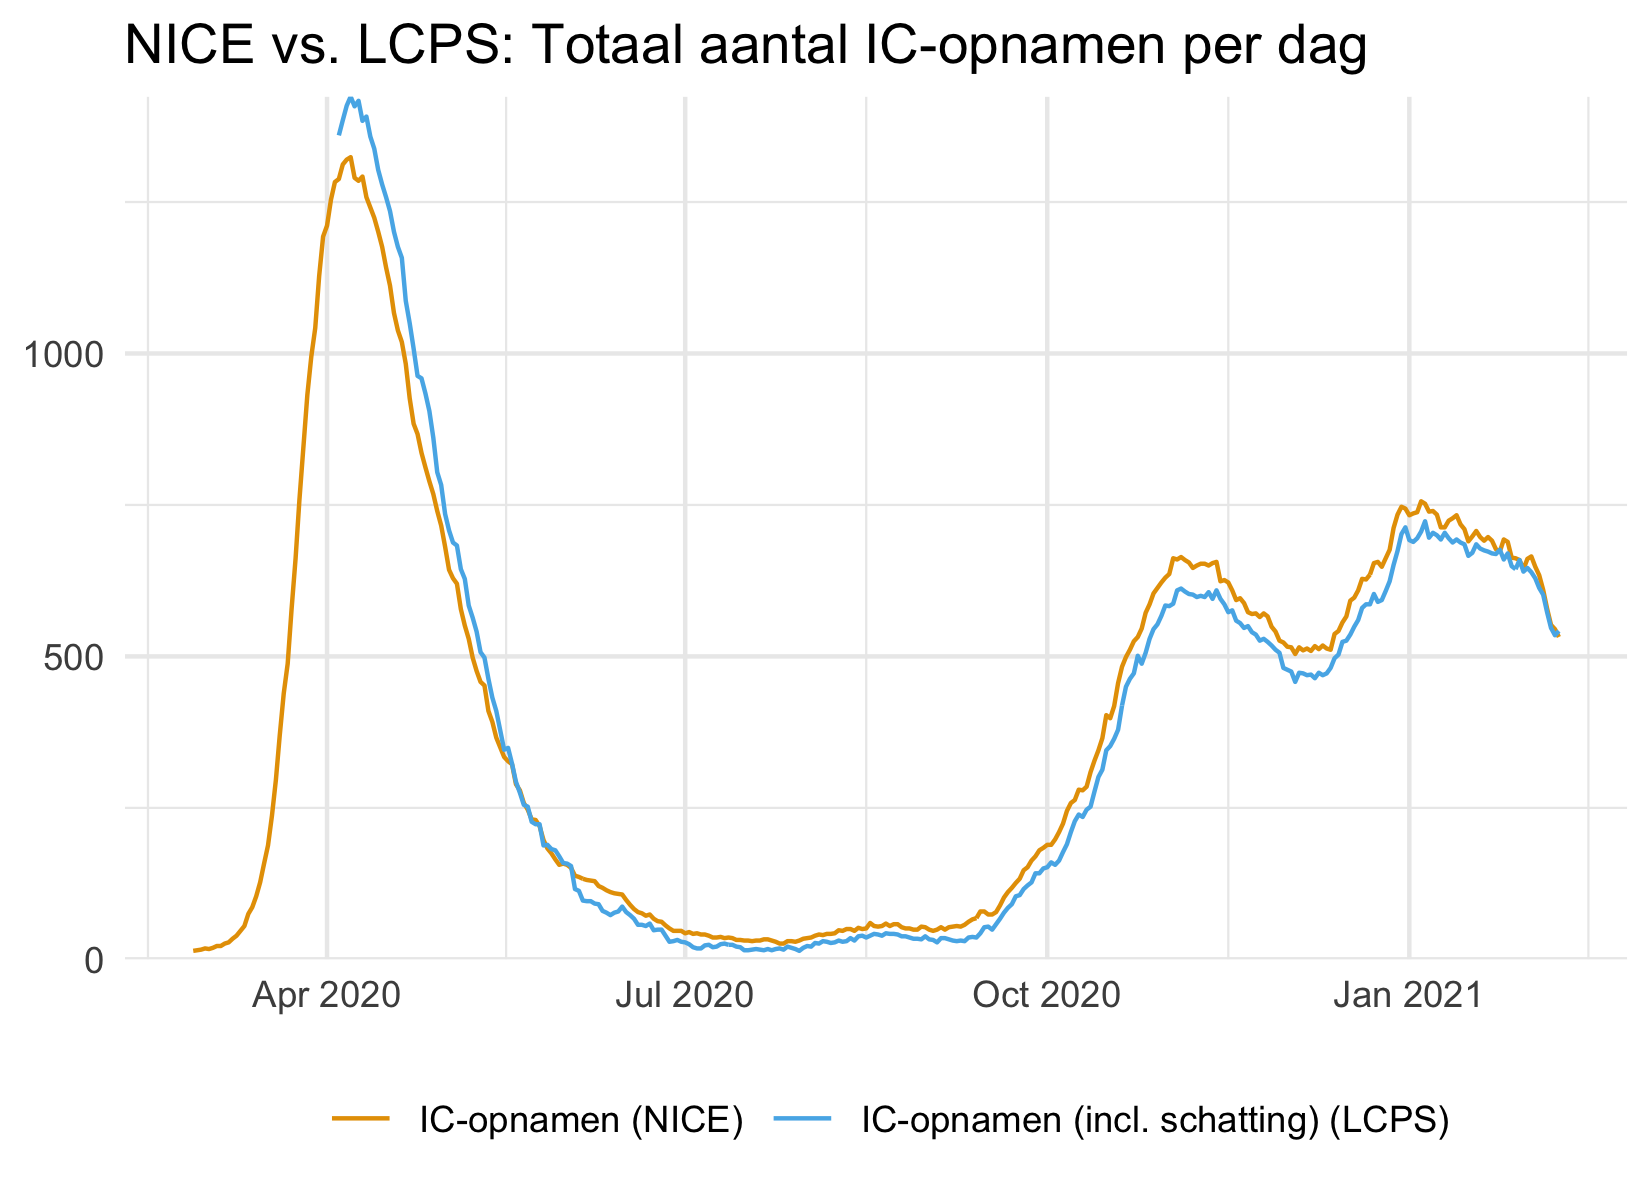
- NICE only reports COVID-19 cases that are admitted to the ICU.
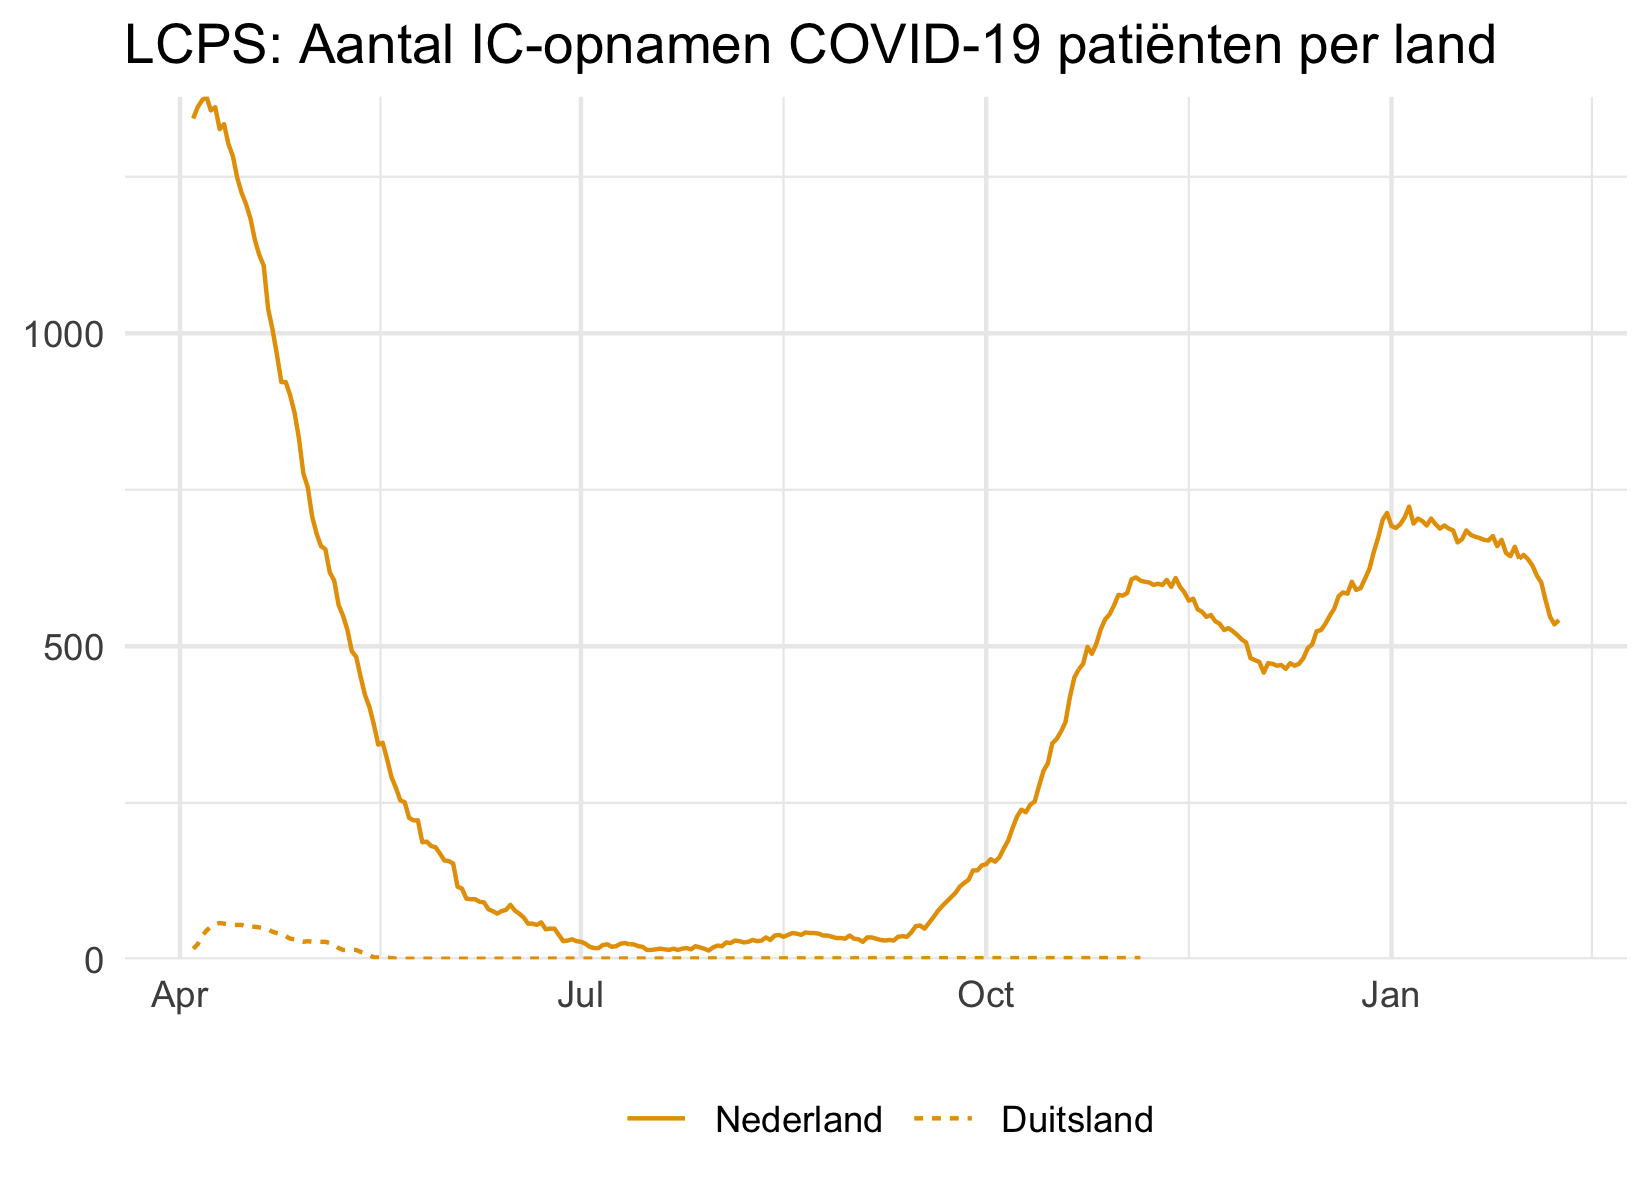
- LCPS, similarly to NICE, reports COVID-19 ICU admissions. However, LCPS tries to compensate for the reporting lag, by estimating its size and adding it to the numbers reported by NICE.
For more detail about the specific structure of the intensive care datasets, have a look at the data-iccodebook.
| Dataset | Source | Variables |
|---|---|---|
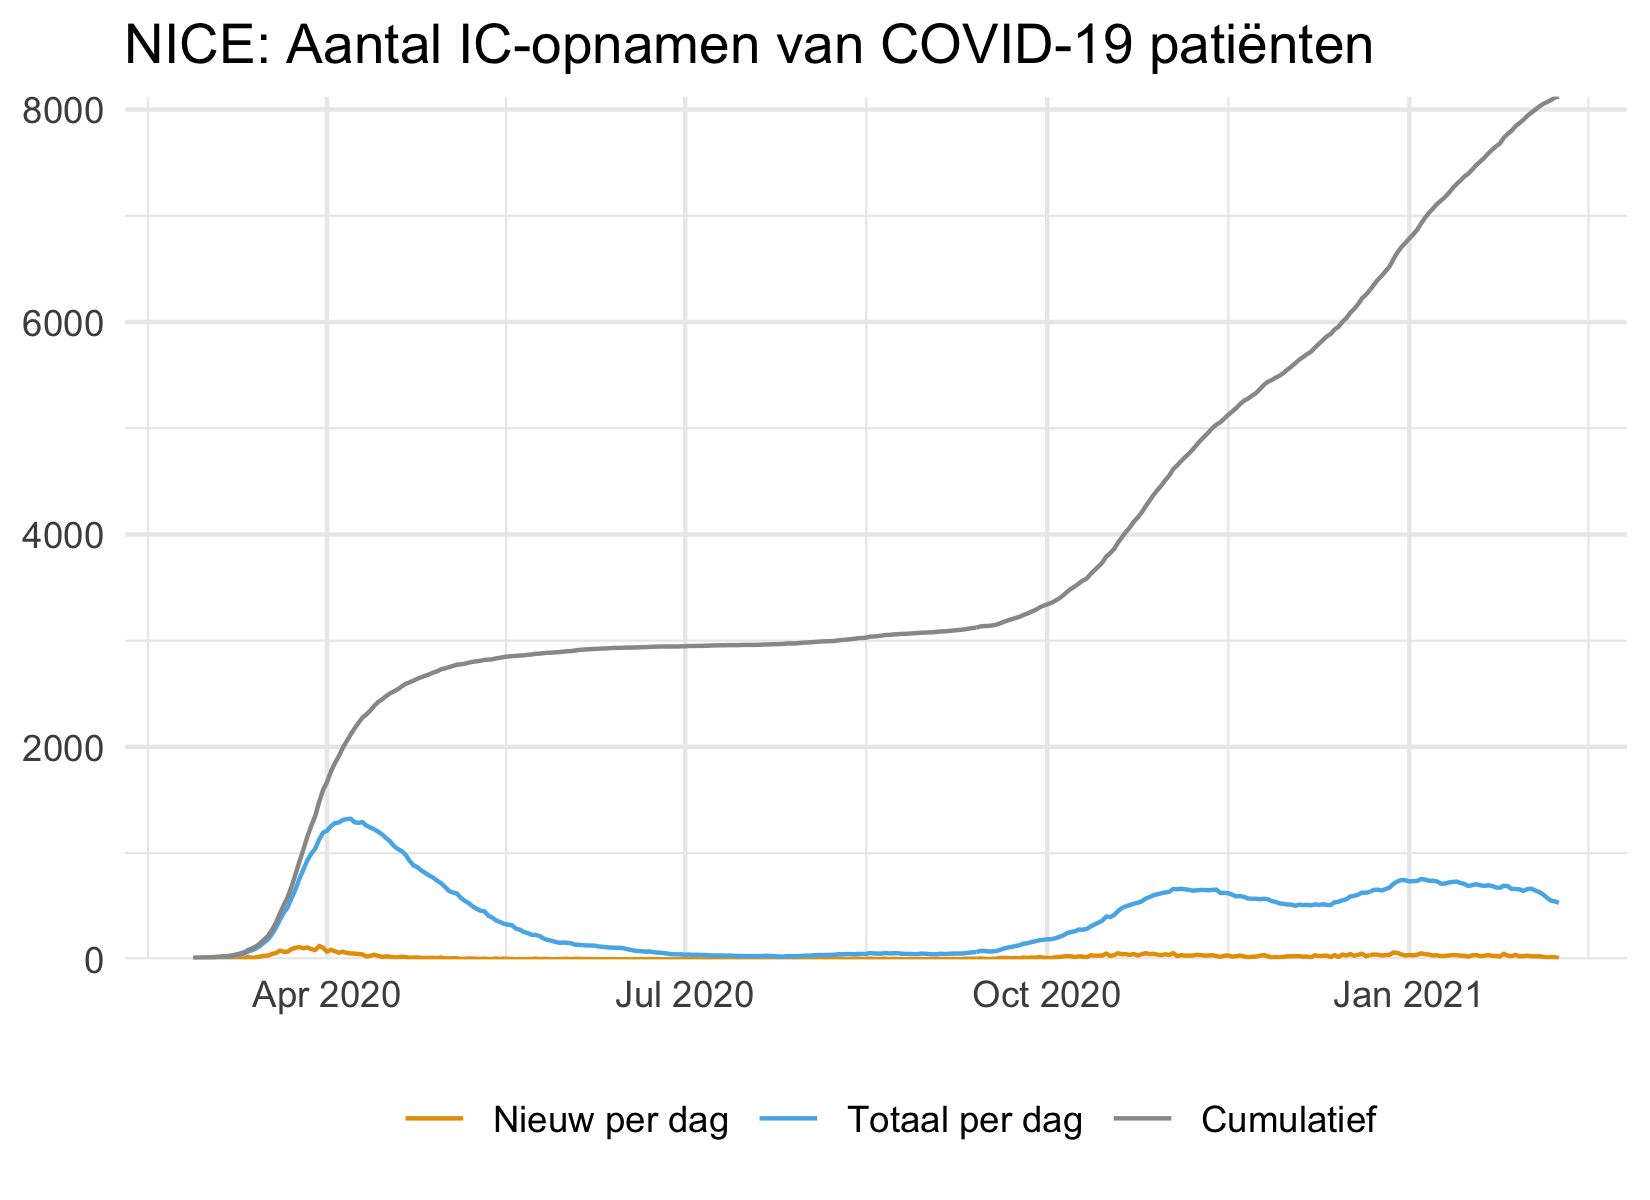
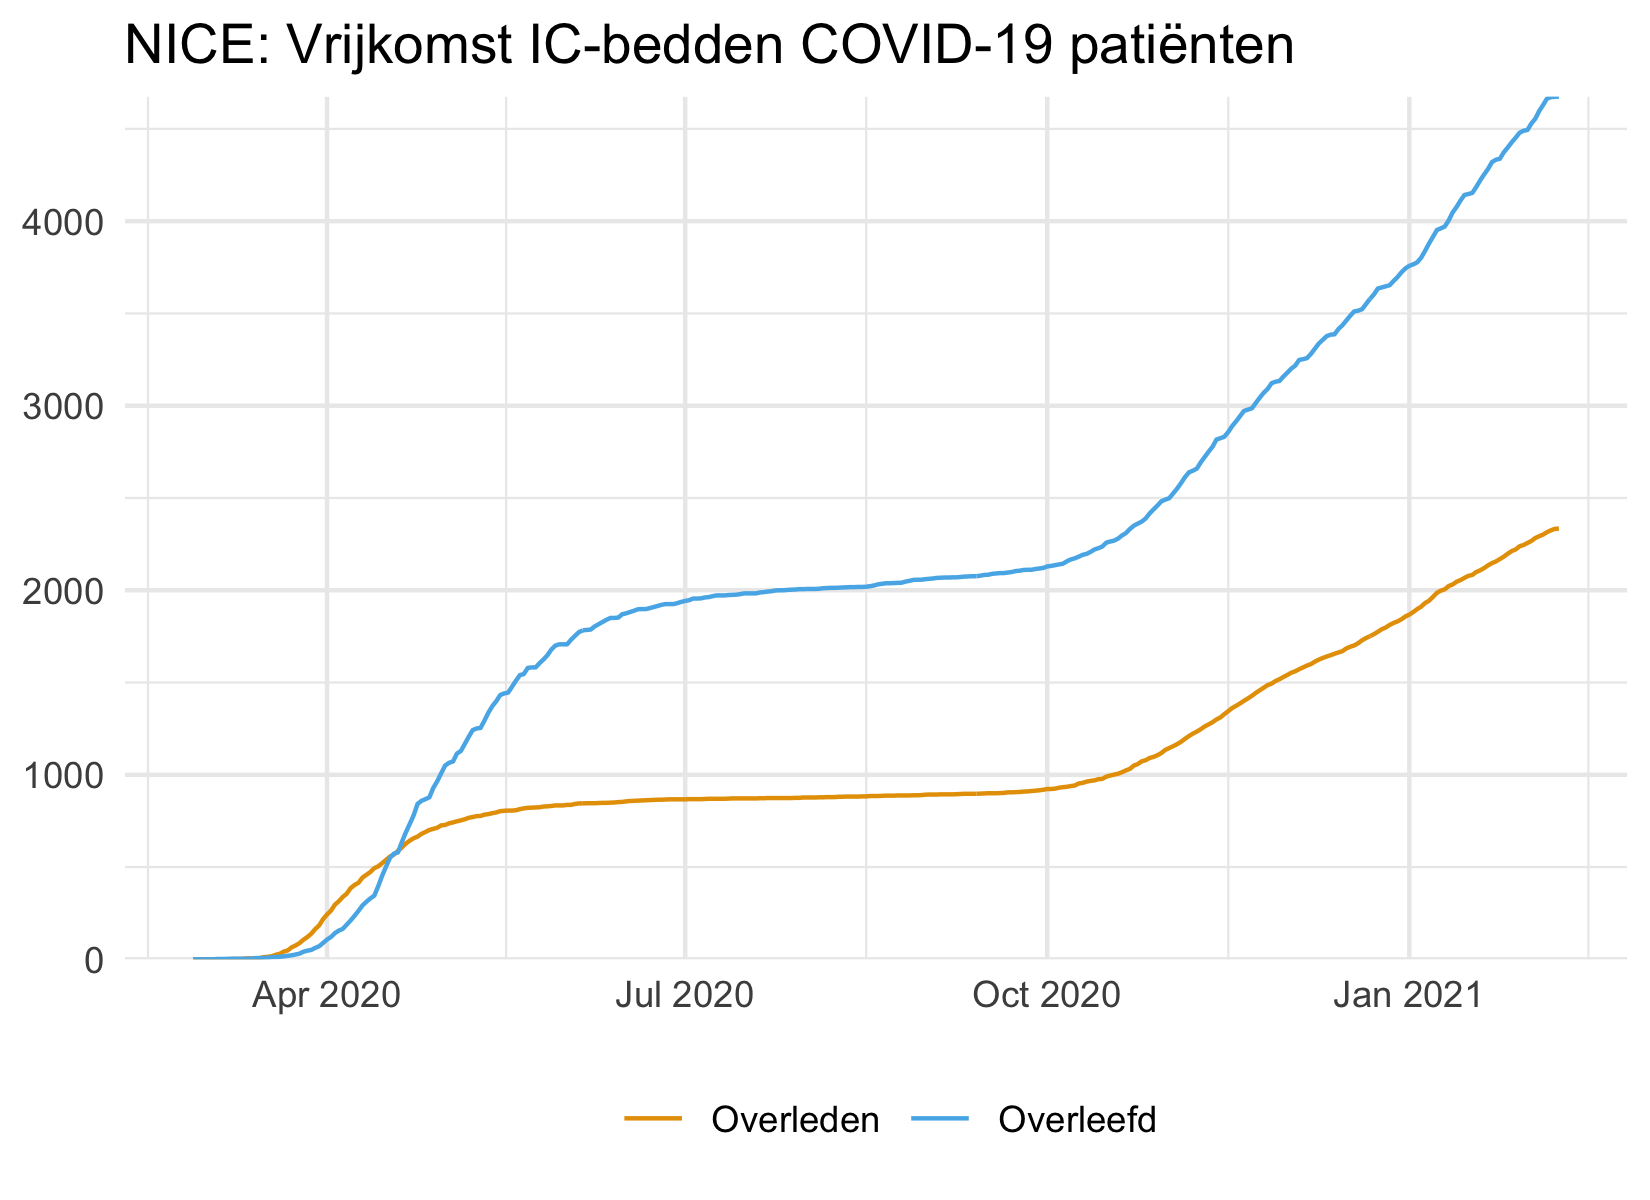
| COVID-19 intensive care patient counts in NL | Stichting NICE | Date, New, Total and Cumulative ICU admissions per day, Number of ICUs with at least one COVID-19 case, New and Cumulative fatal, survived and discharged ICU admissions |
| COVID-19 intensive care patient counts with country of hospitalisation | LCPS | Date, Country of Hospitalization, Total COVID-19 ICU admissions |
Visualizations intensive care
The first two graphs show the number of new (Nieuw), total (Actueel), cumulative (Cumulatief), deceased (Overleden), and survived (Overleefd) COVID-19 ICU admissions per day, as declared by NICE. The total number of ICU admissions per day as reported by LCPS is also shown.
Dashboard datasets
The datasets underlying the National Dashboard are listed in this folder. These datasets concern various topics, such as an overview of the number and age distribution of hospitalized, positively tested, and suspected cases, an estimate of the number of contagious people, the reproduction index, the number of (deceased) infected nursery home residents, and the amount of virus particles measured in the sewage water.
For more detail about the specific structure of the dashboard datasets, have a look at the data-dashboardcodebook.
| Dataset | Source | Variables |
|---|---|---|
| Reported case counts in NL | National Dashboard | Date, Type of measure, (Cumulative) Count |
| Age distribution of reported cases in NL | National Dashboard | Date, Age group, Count |
| Suspected patients in NL | National Dashboard | Date, Type of measure, Count |
| COVID-19 particles in sewage | National Dashboard | Date, Type of measure, Count, Measurement units |
| Reproduction index COVID-19 virus | National Dashboard | Date, Type of measure, Value |
| Contagion estimate COVID-19 virus | National Dashboard | Date, Type of measure, Value |
| Number of infected and deceased nursery home cases | National Dashboard | Date, Type of measure, (Cumulative) Count |
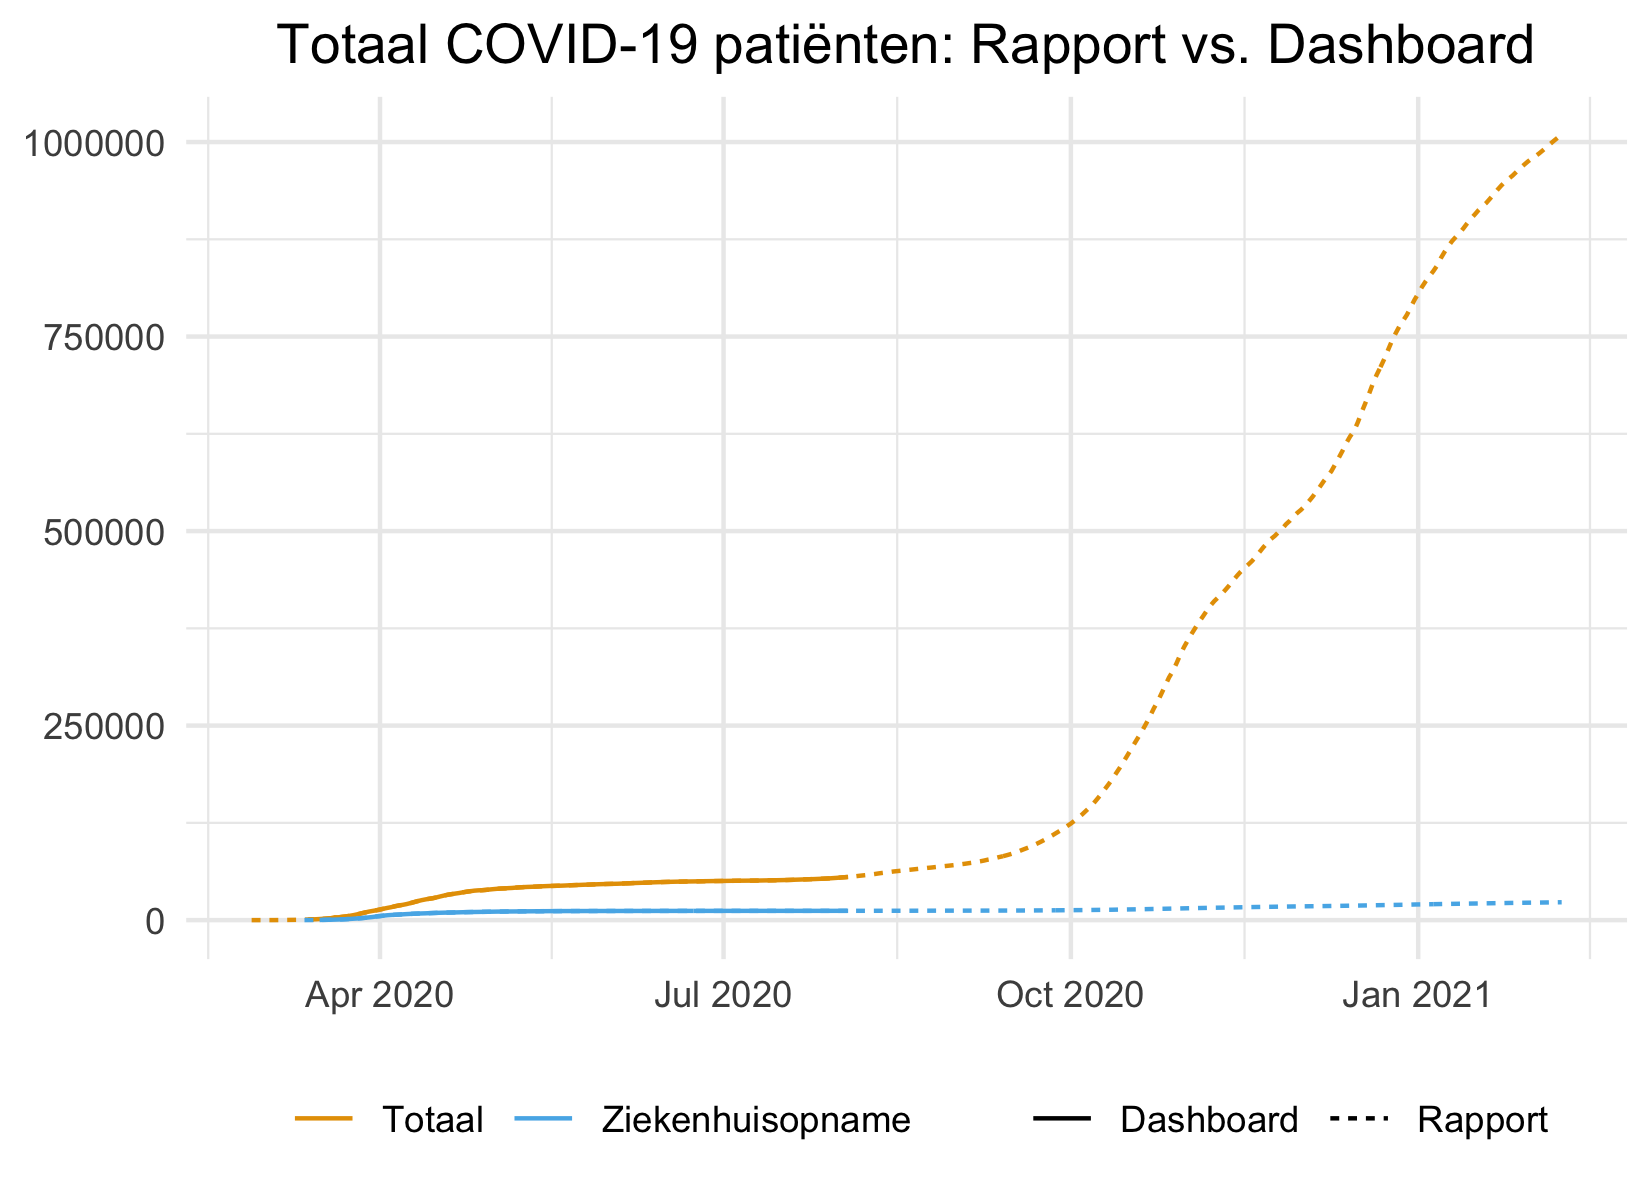
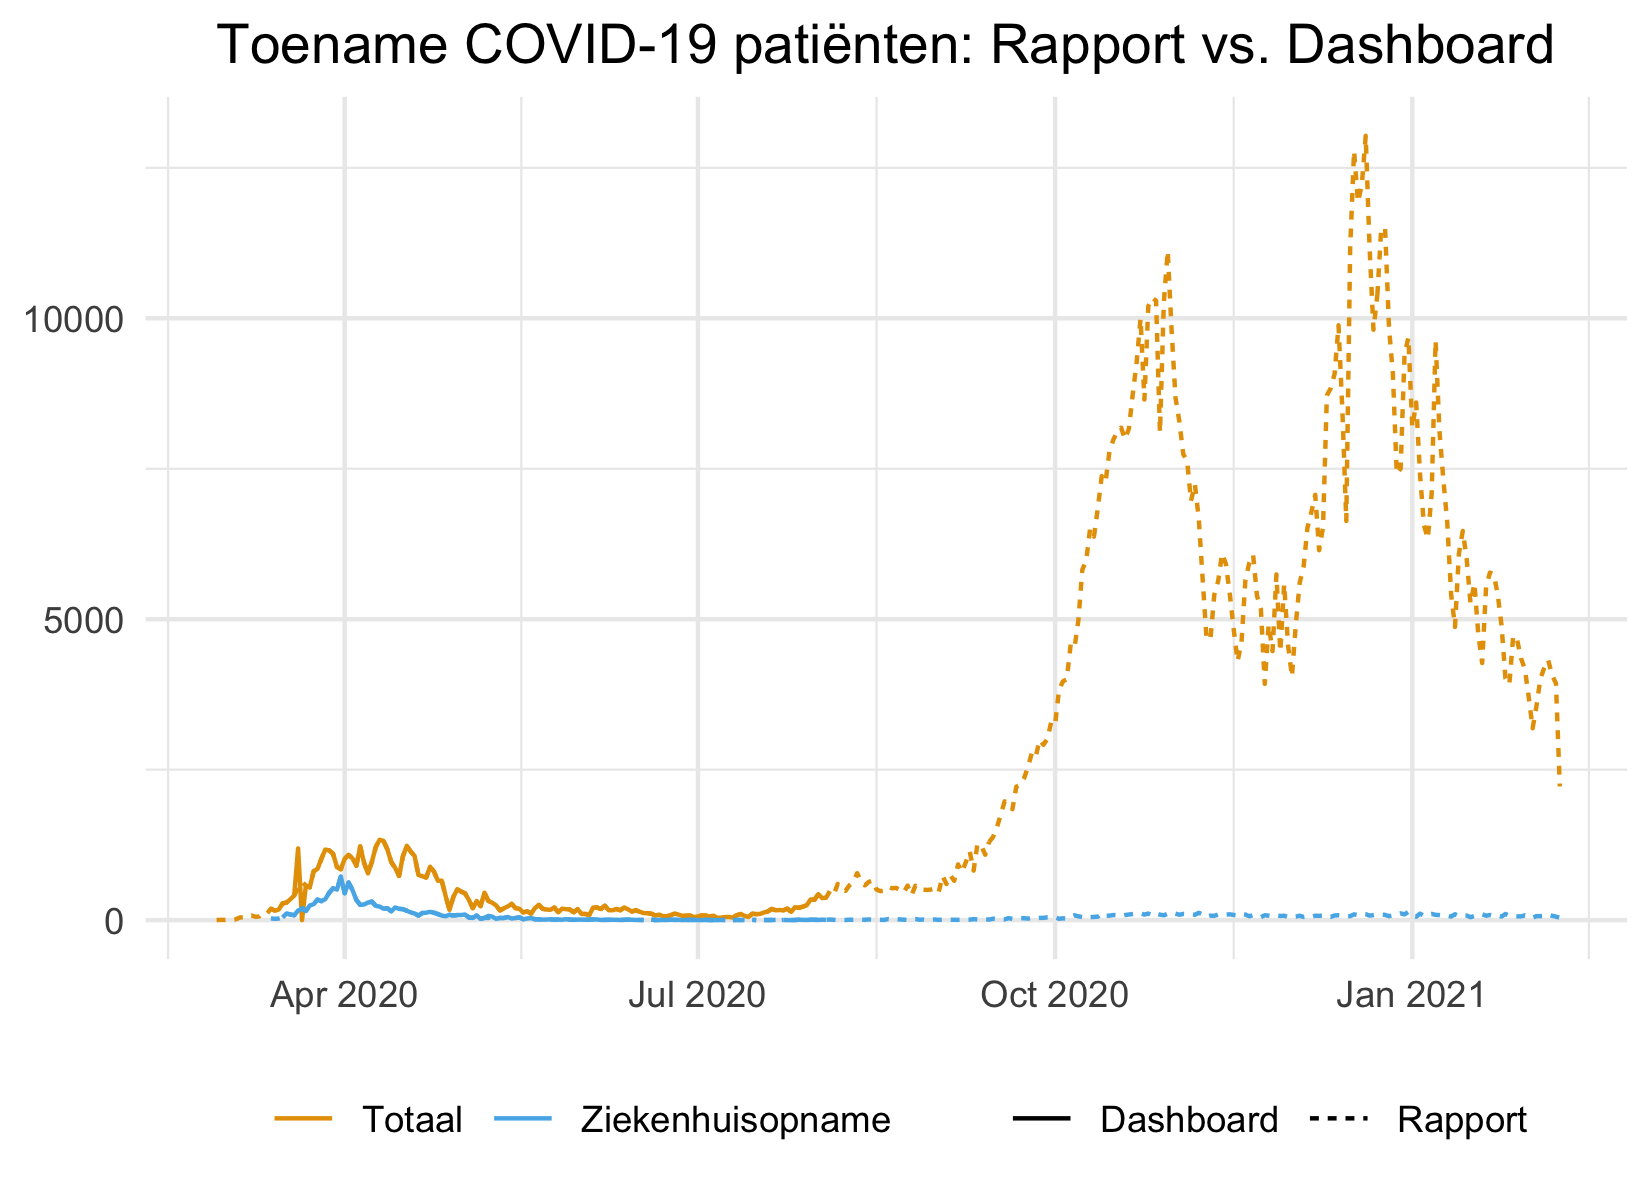
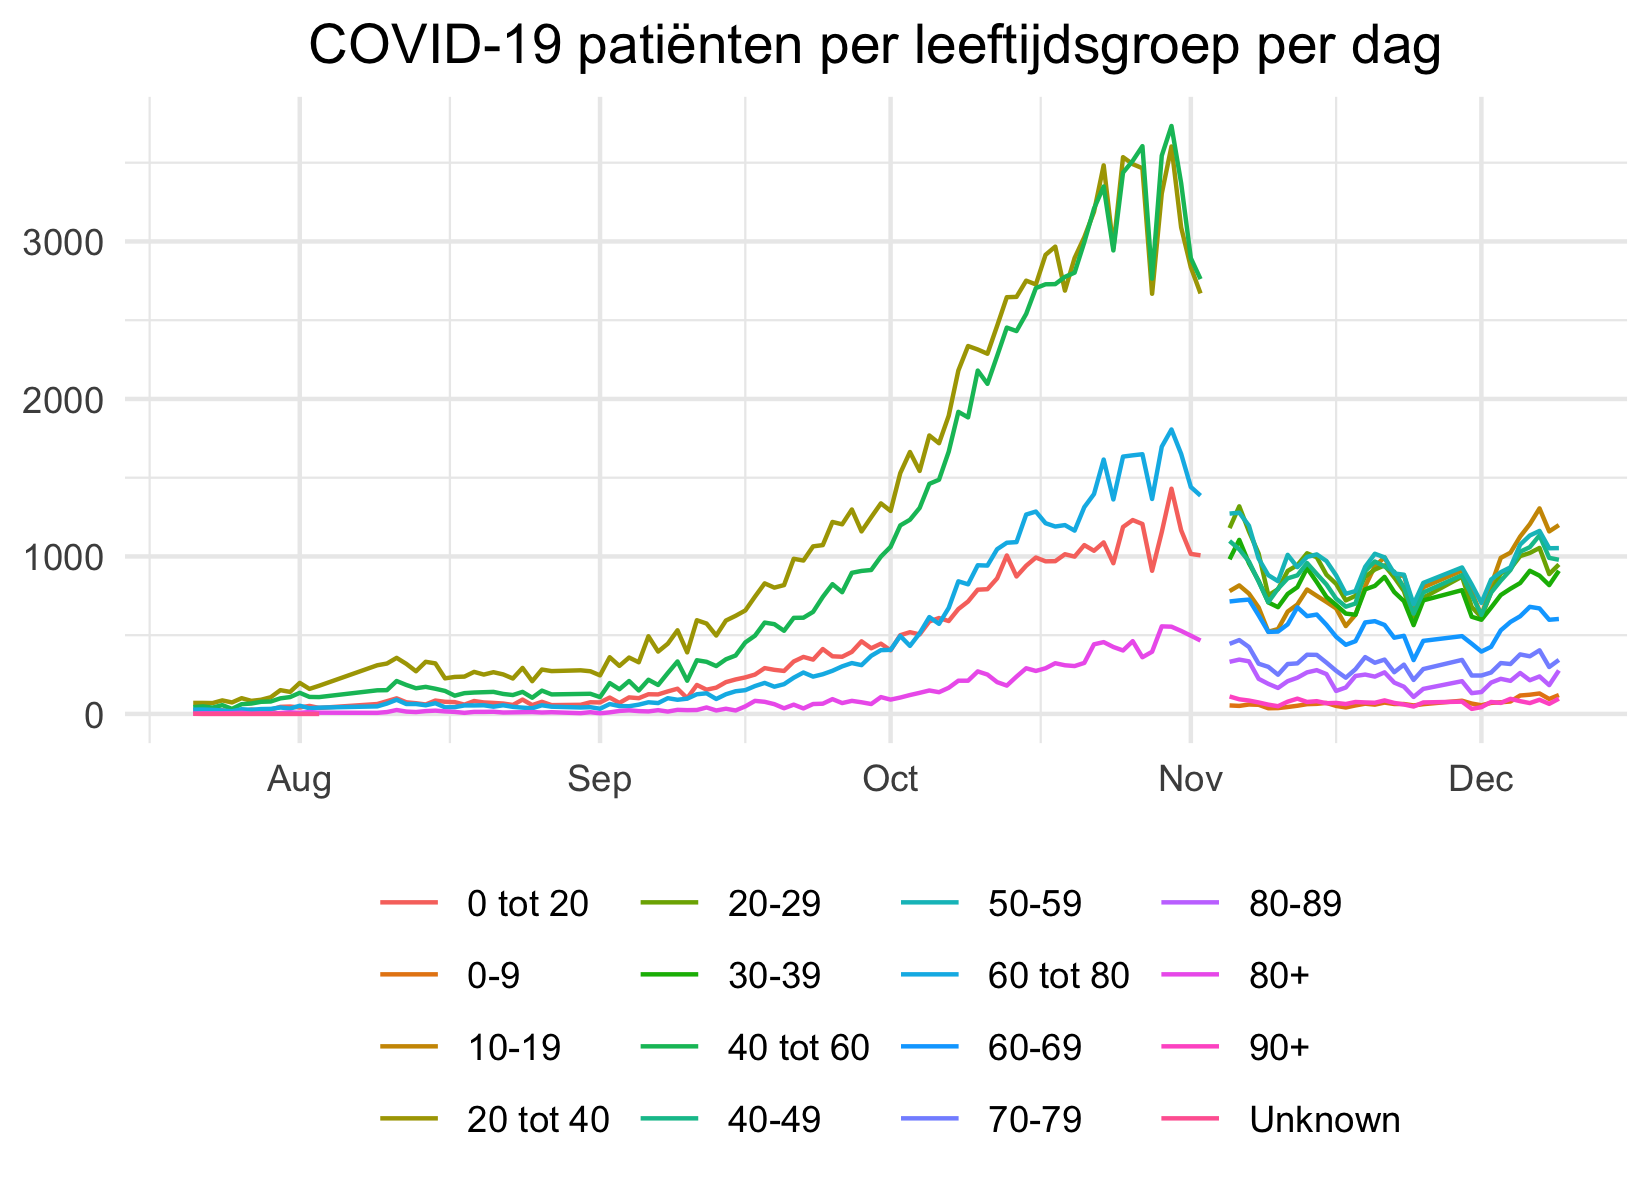
Visualizations dashboard data
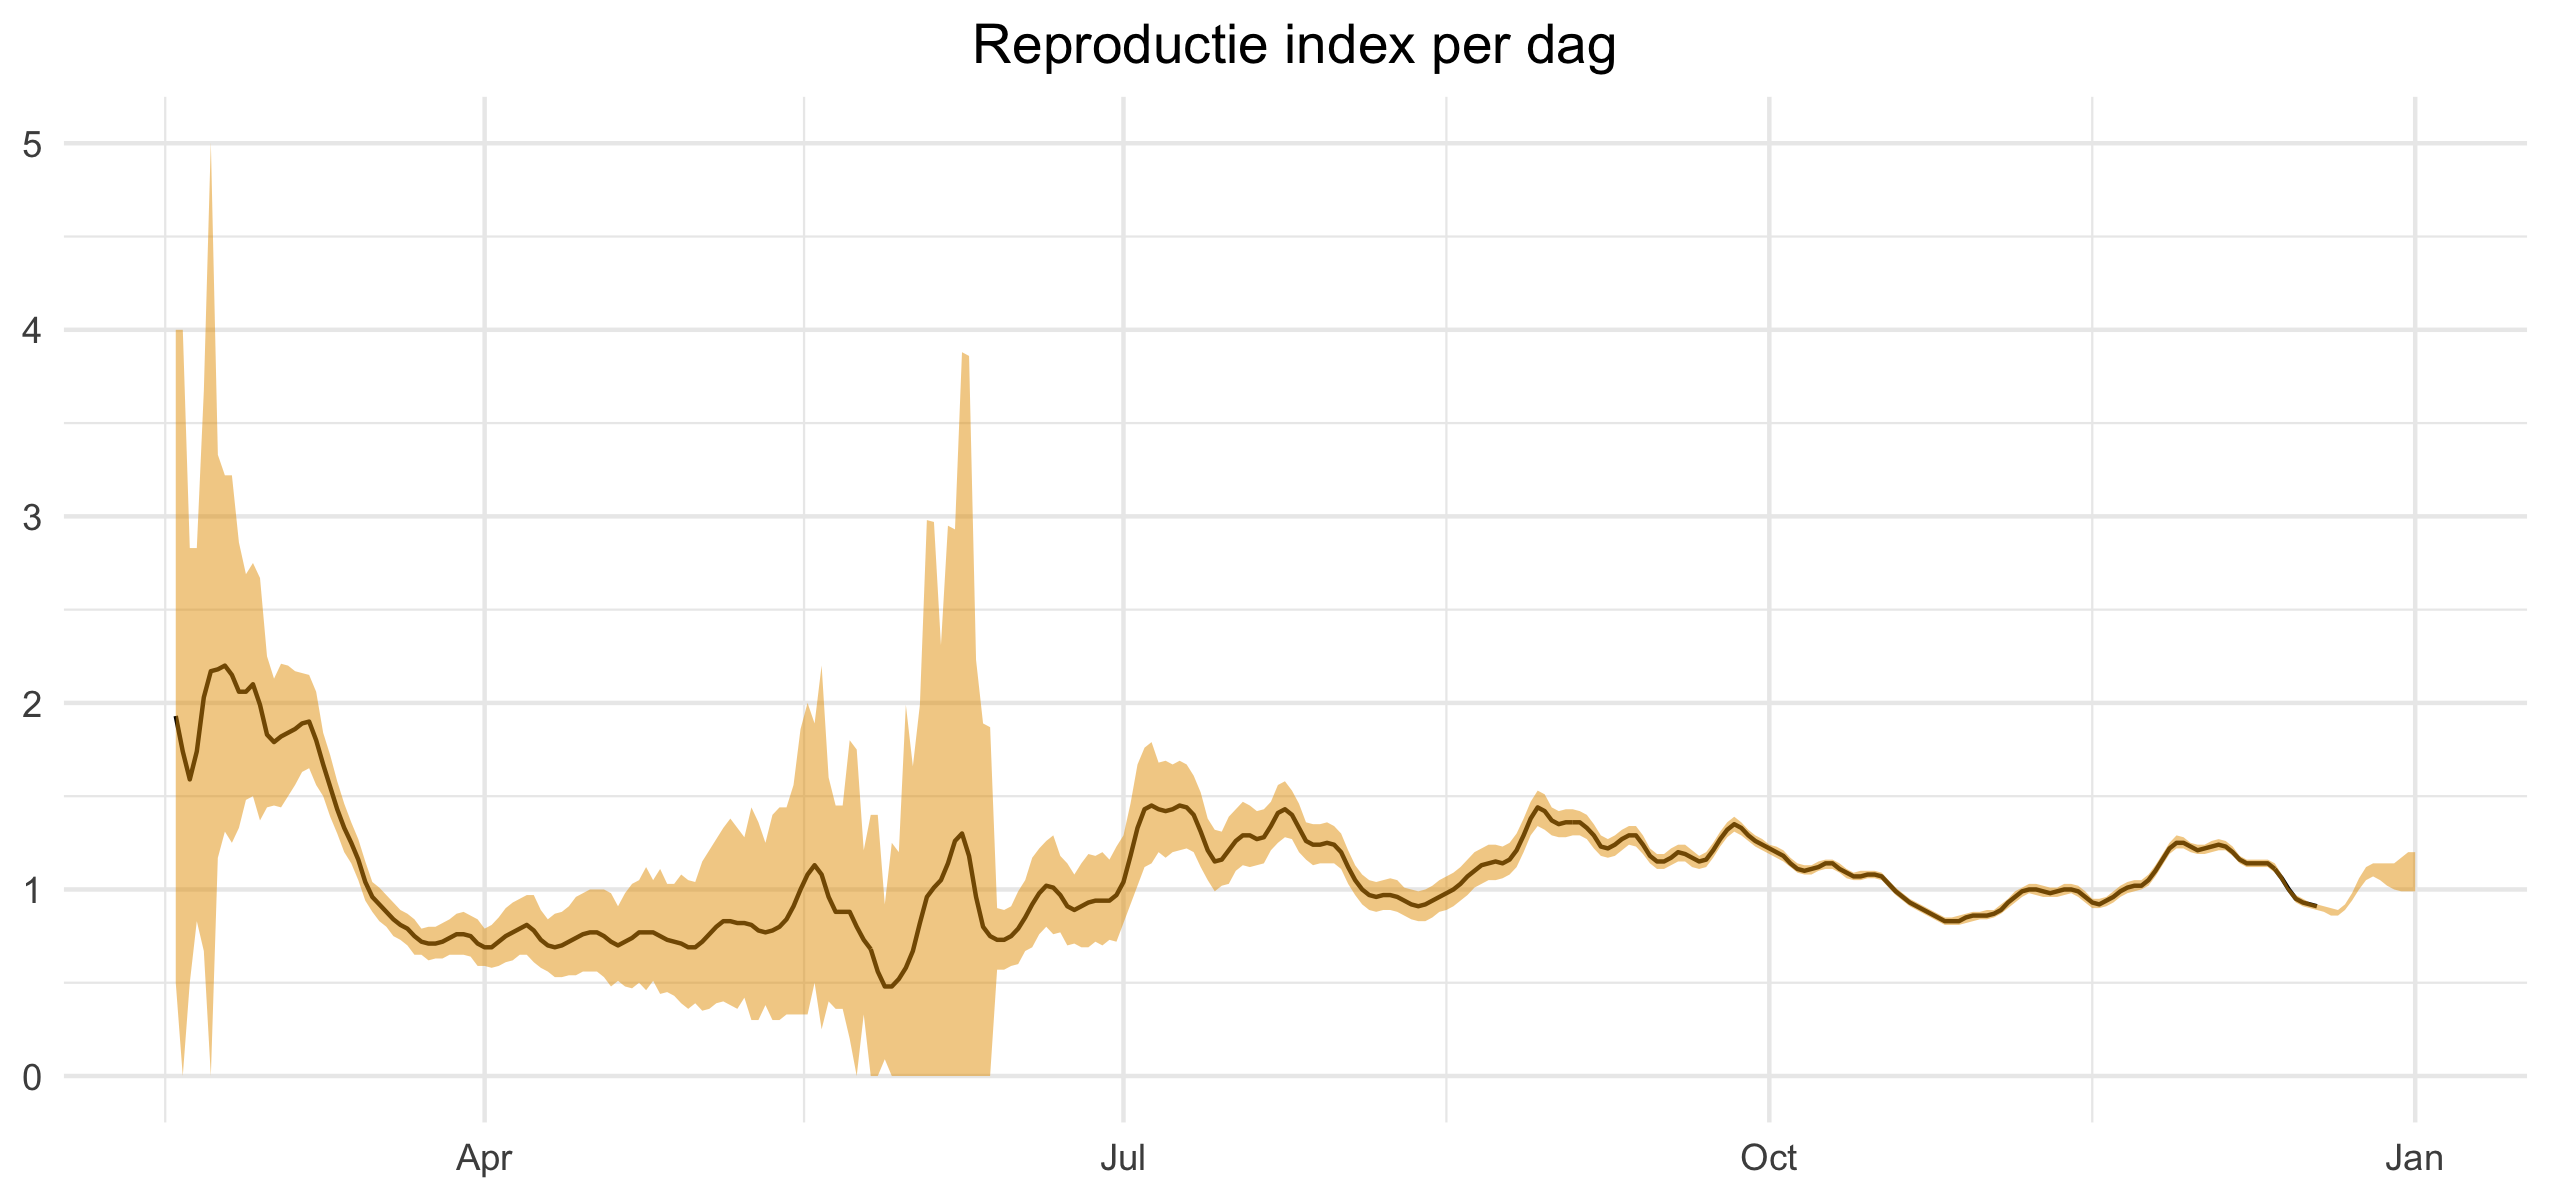
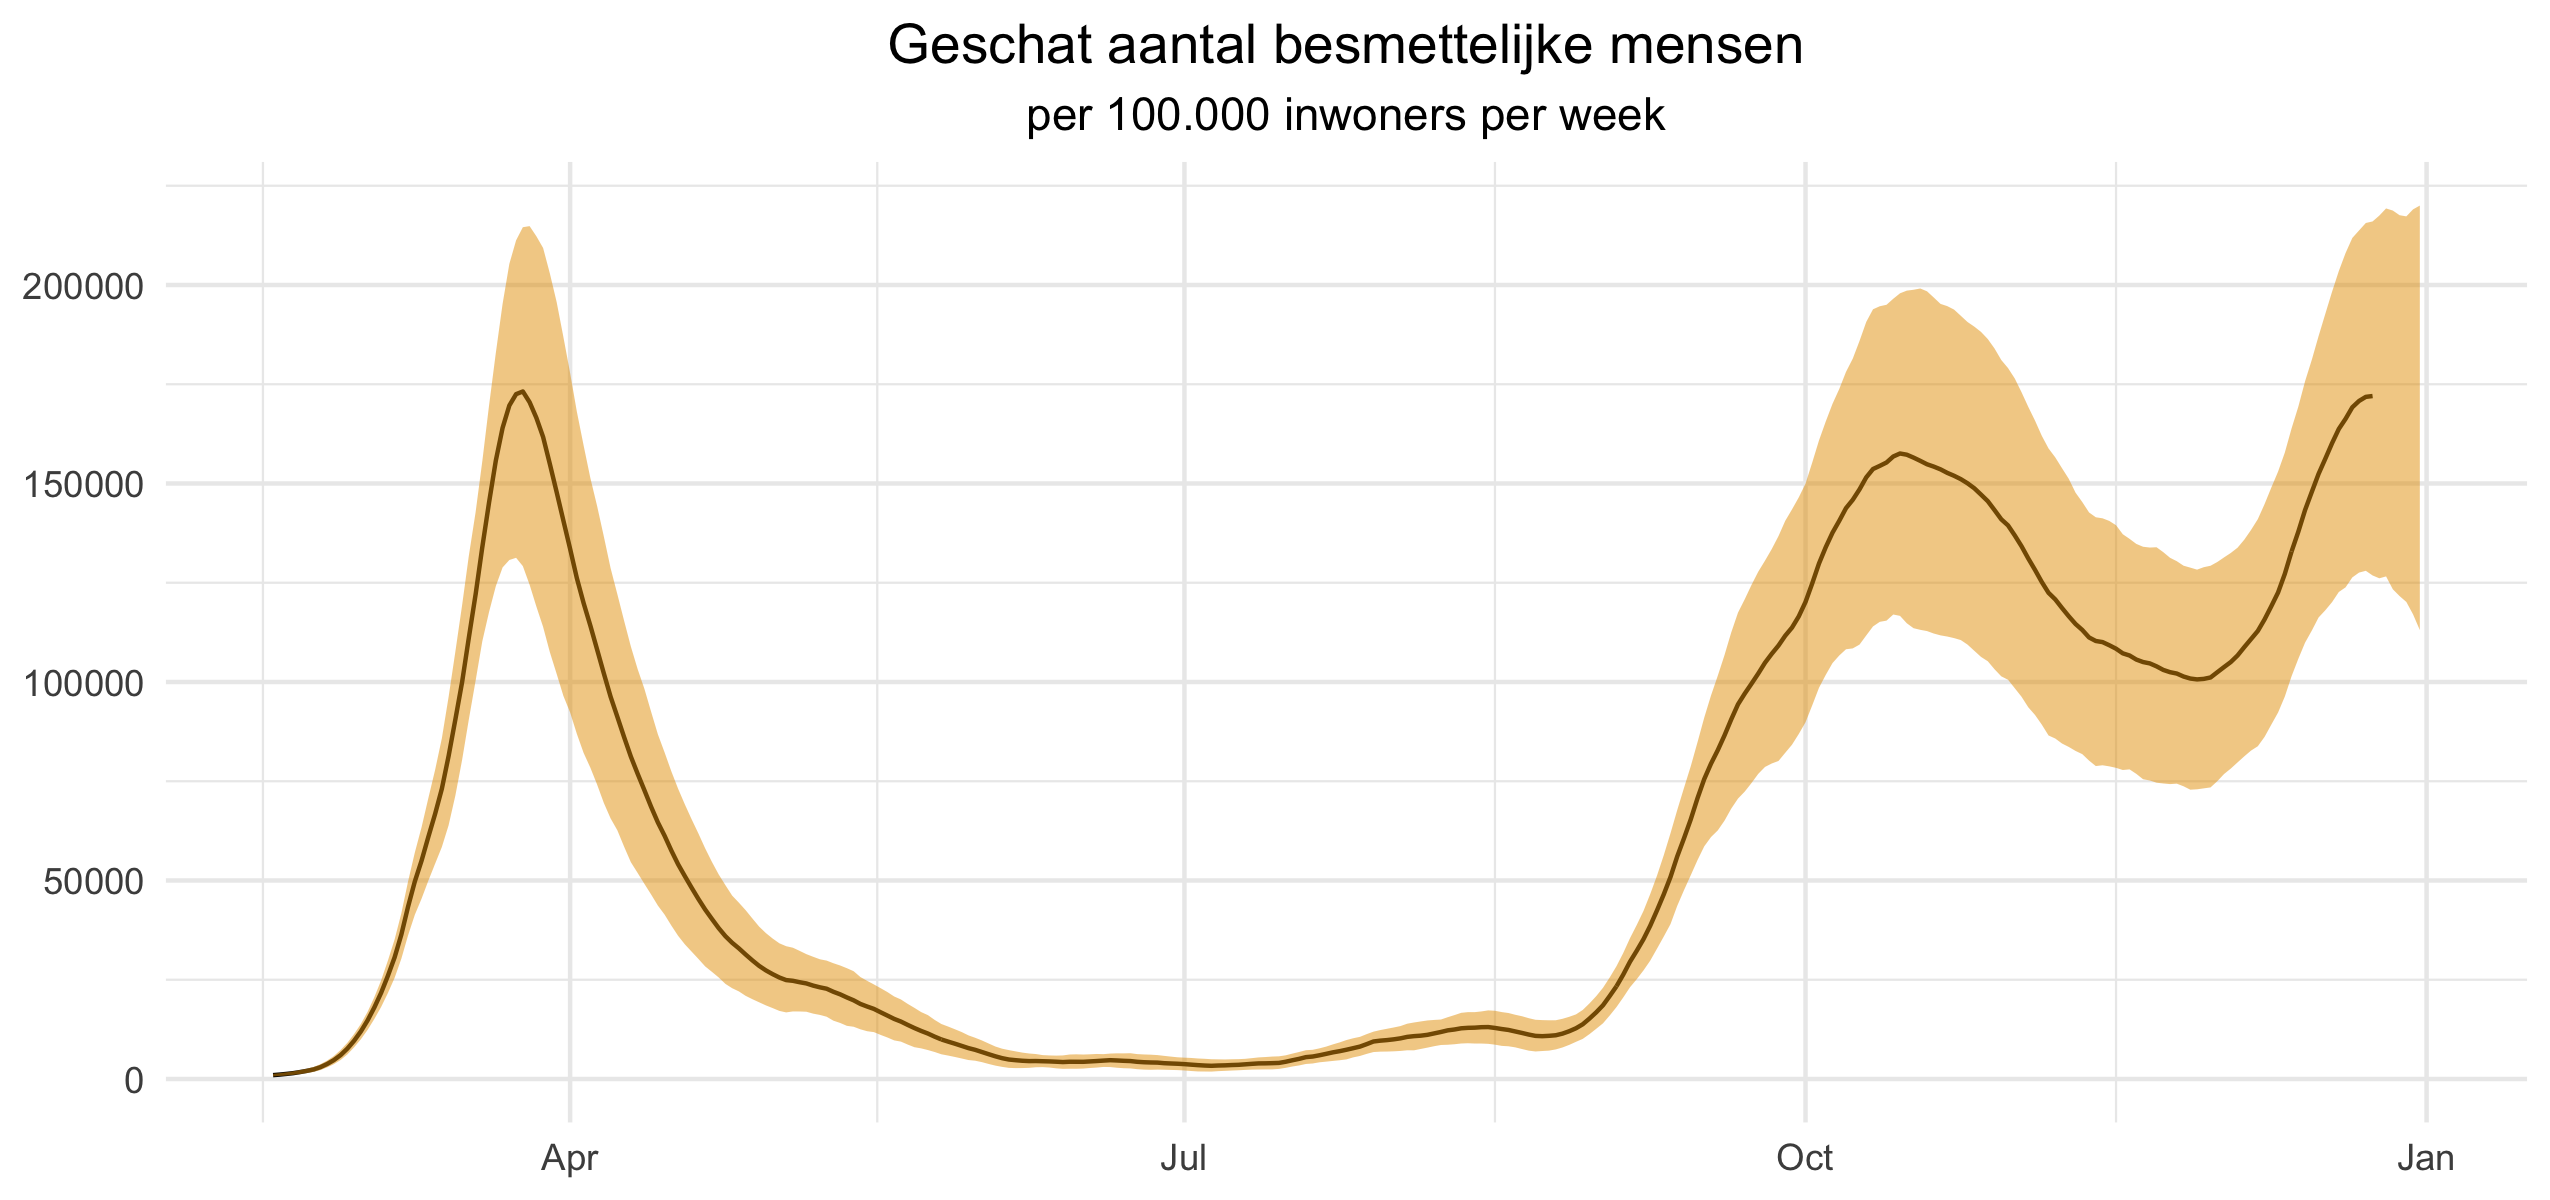
These visuals show the development of the COVID-19 disease outbreak on a national level as reported by the National Dashboard and by the RIVM reports.
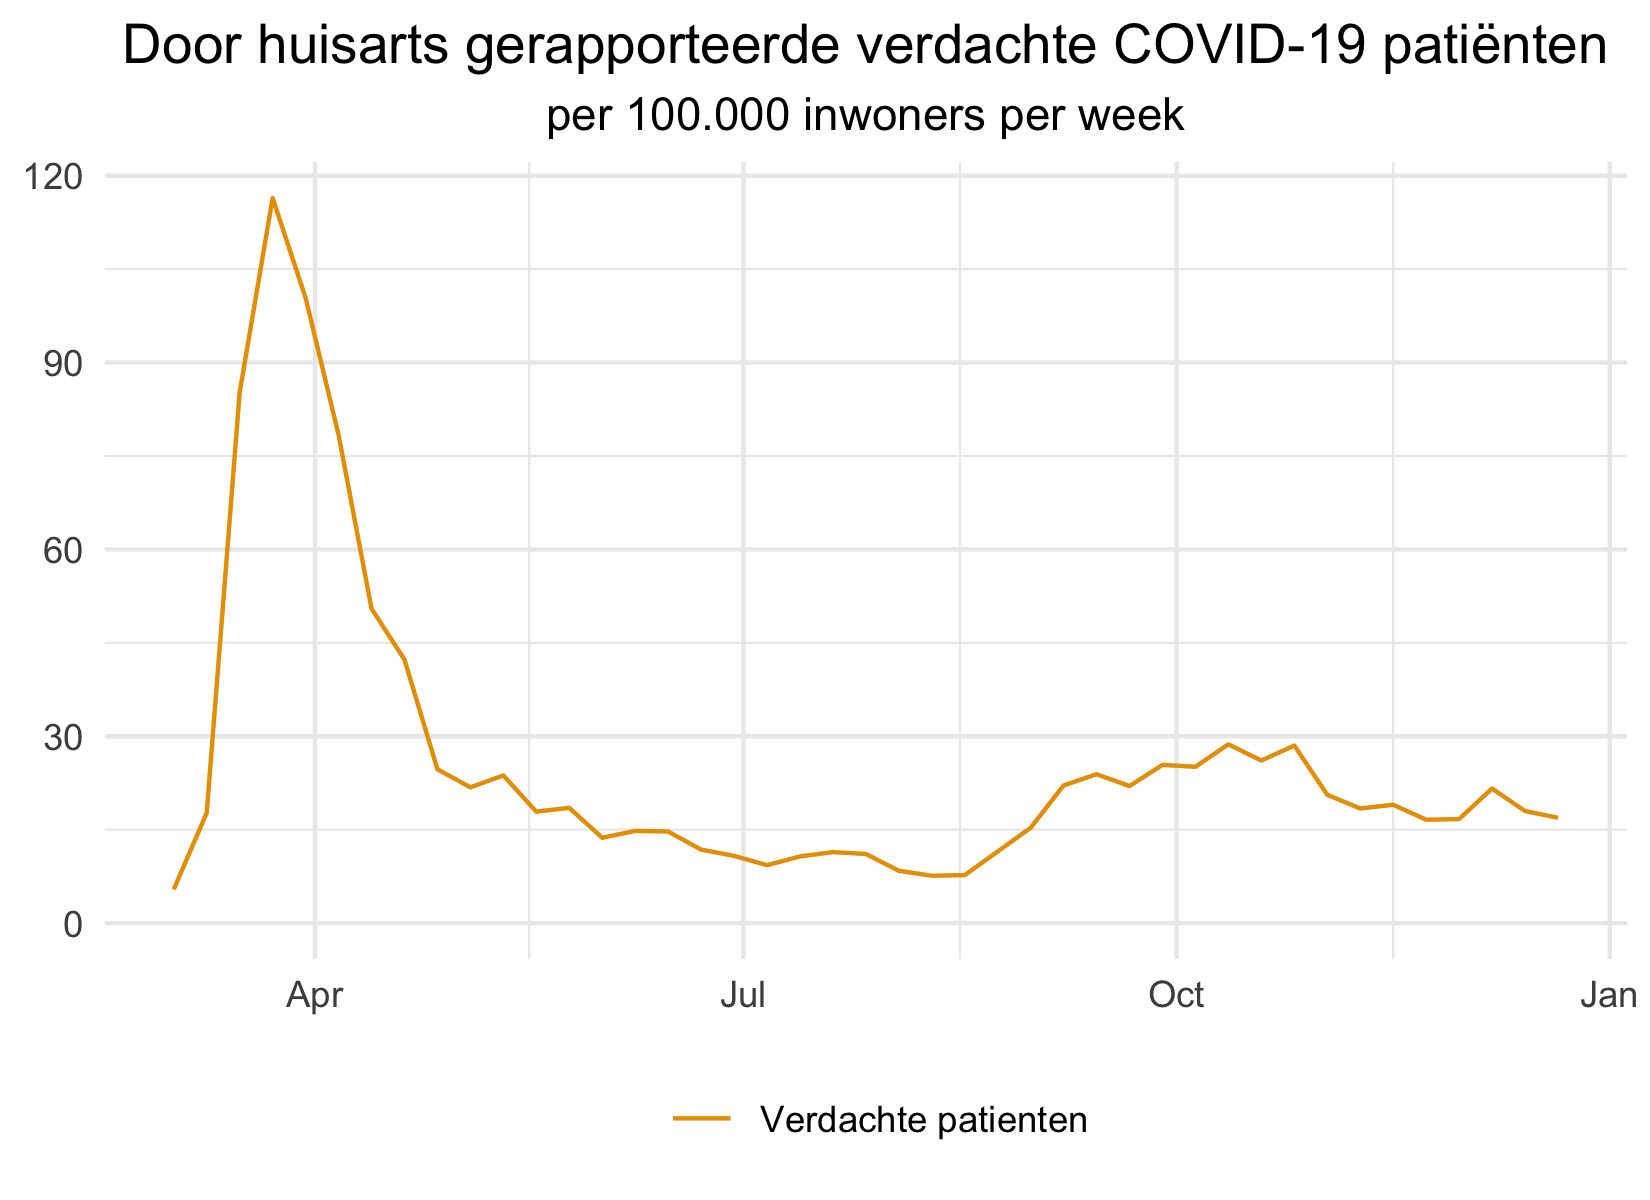
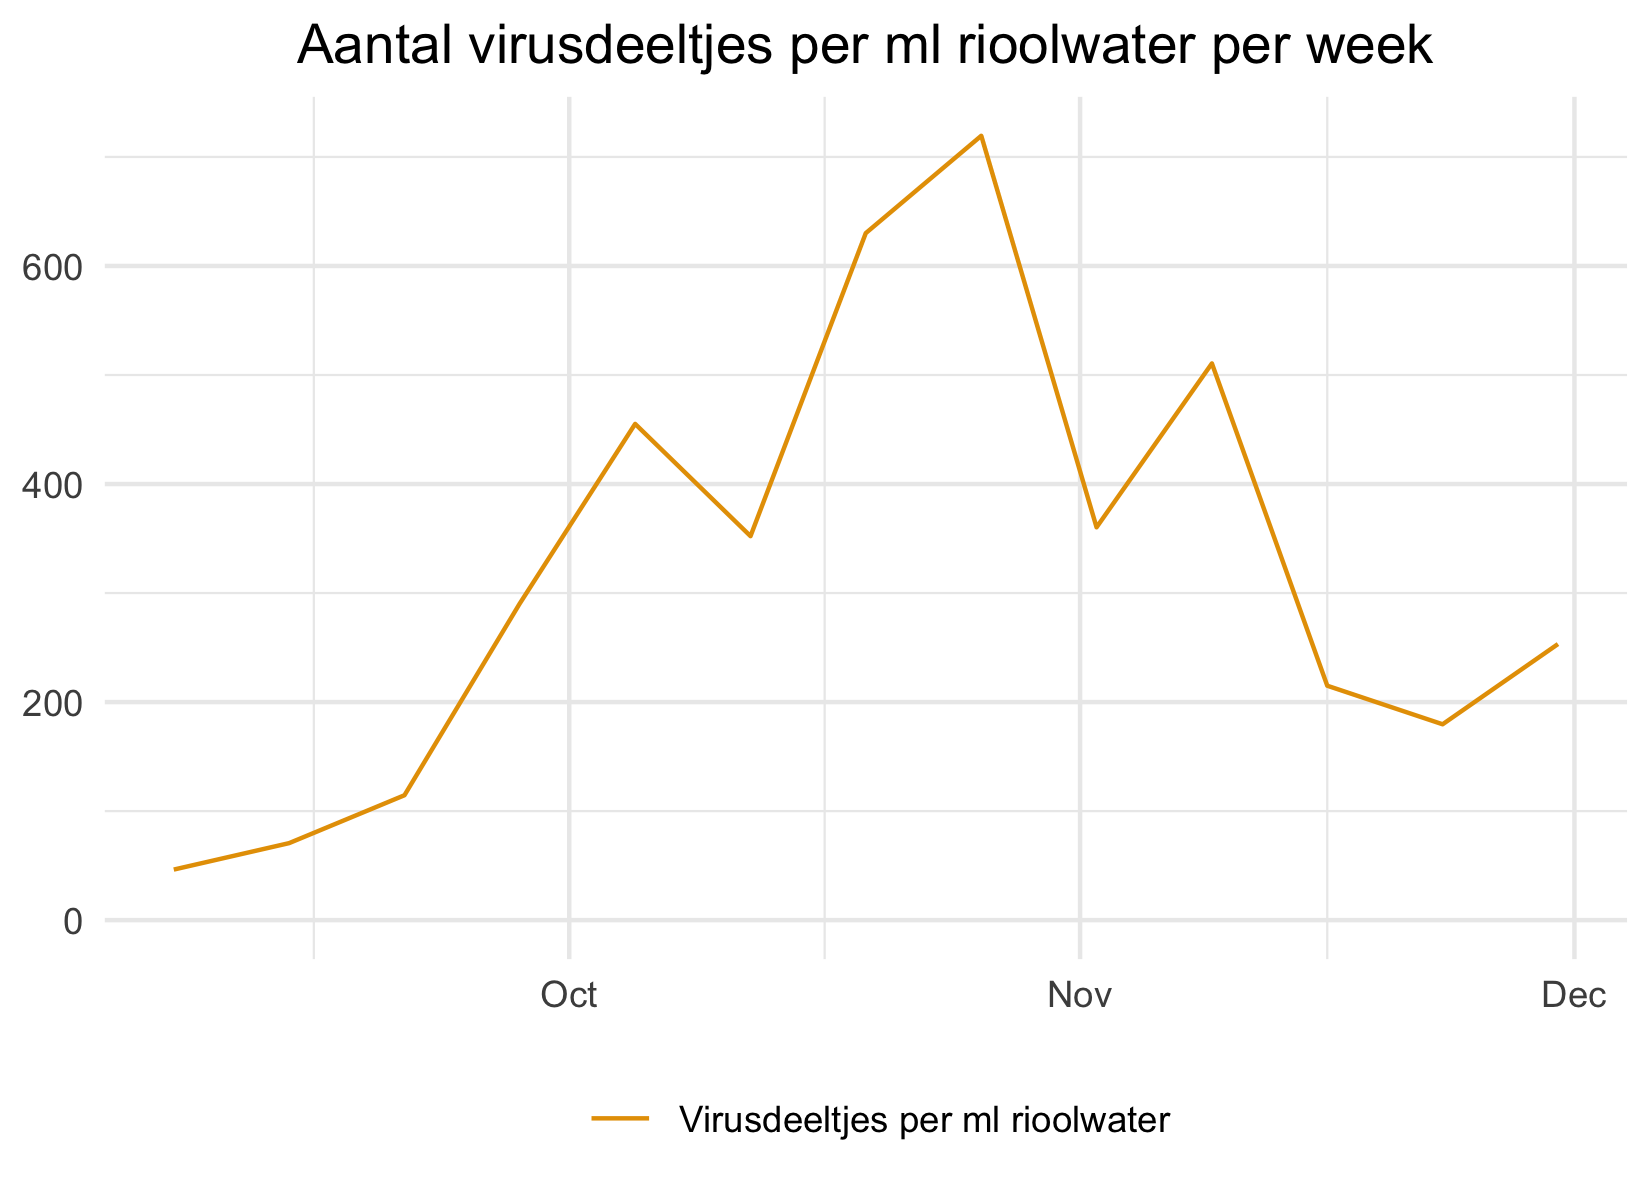
Below, the number of suspected COVID-19 patients as registered by the GPs, and the amount of COVID-19 particles per milliliter sewage water are depicted.
The reproduction index and estimated contagious people are plotted with their corresponding minimum and maximum values. The reproduction index indicates how quickly the COVID-19 virus is spreading in the Netherlands. The estimated contagious people represent the number of COVID-19 people per 100.000 inhabitants that are contagious for others.
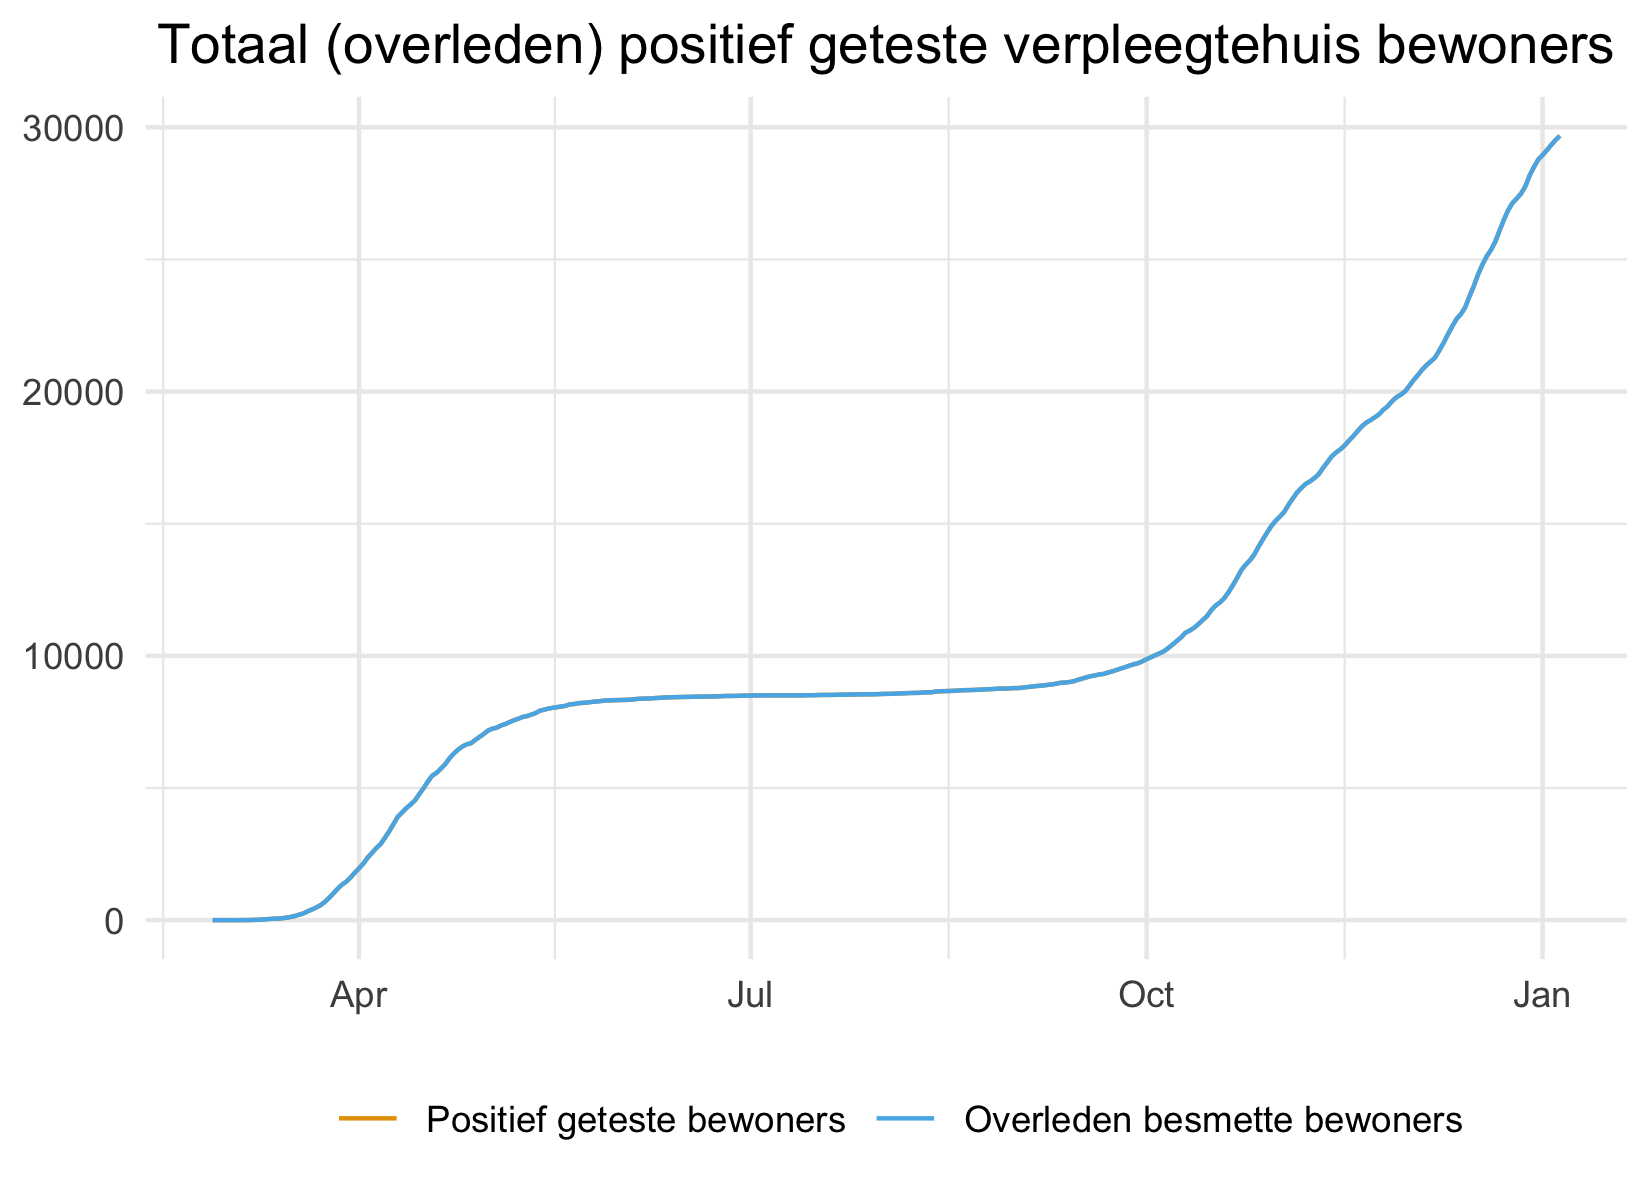
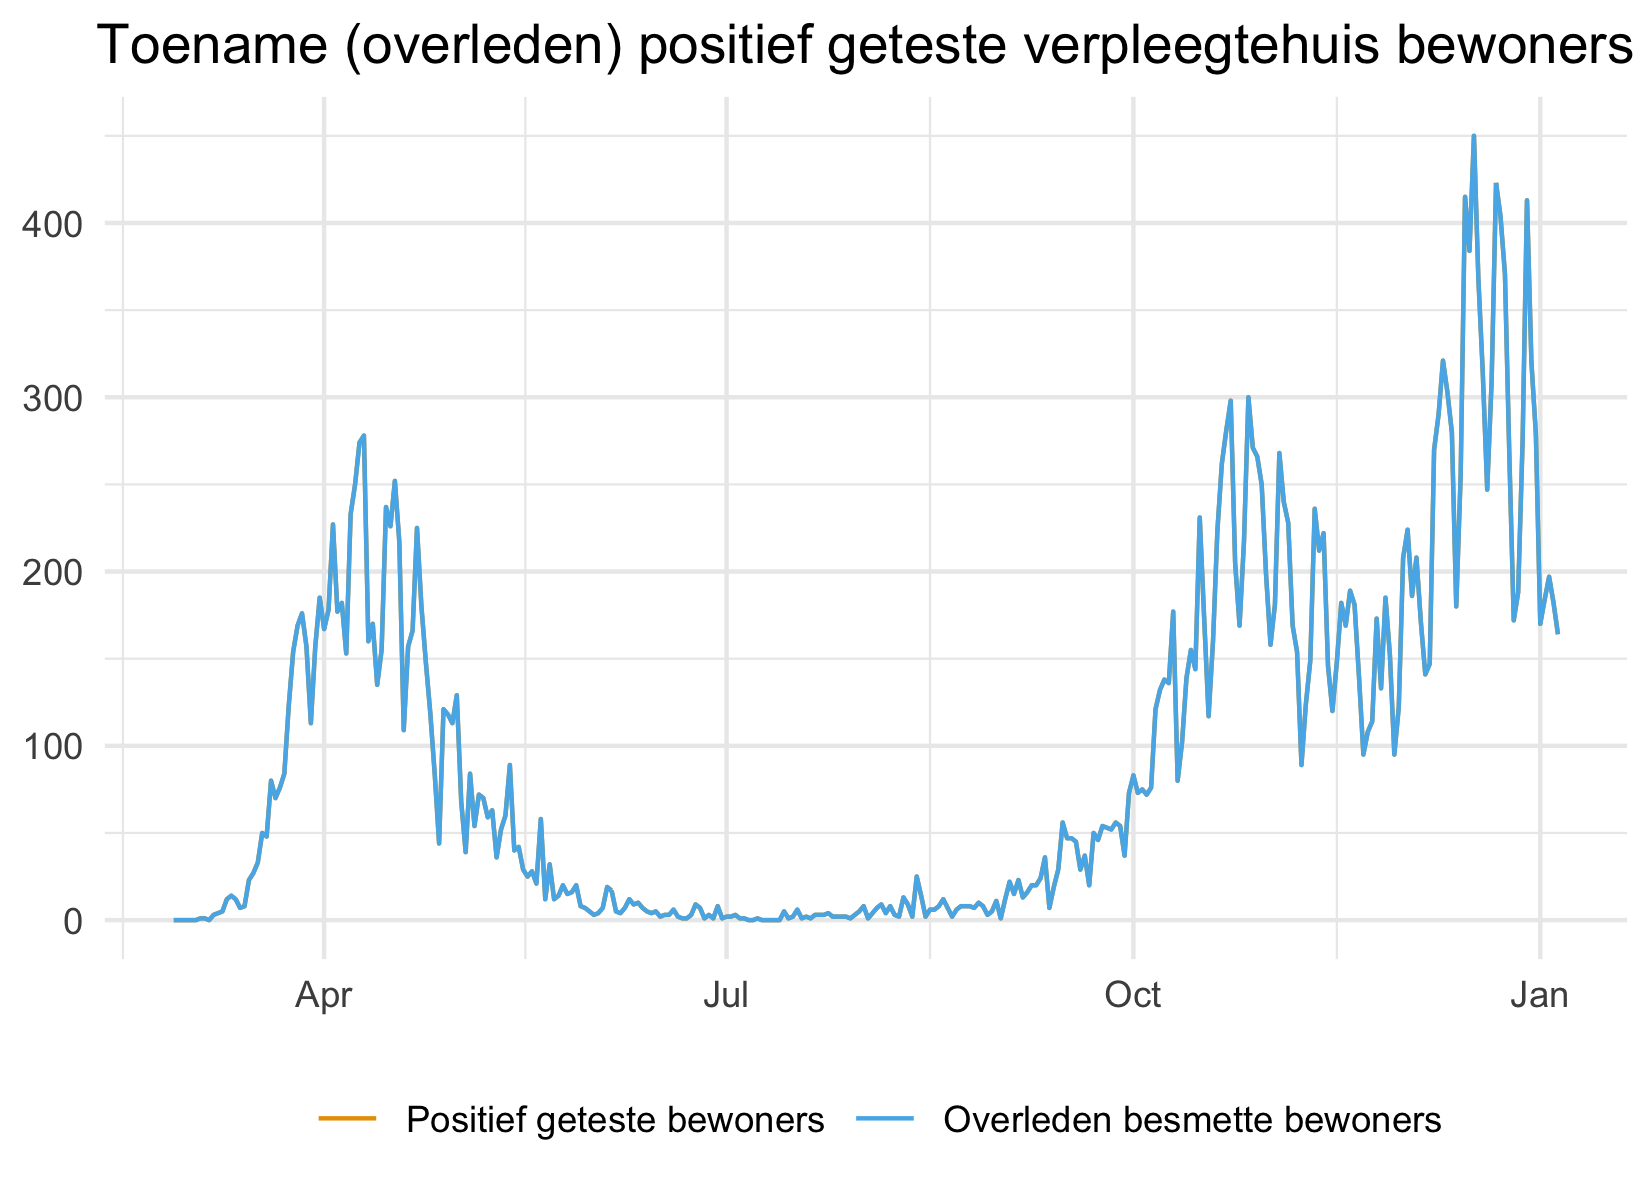
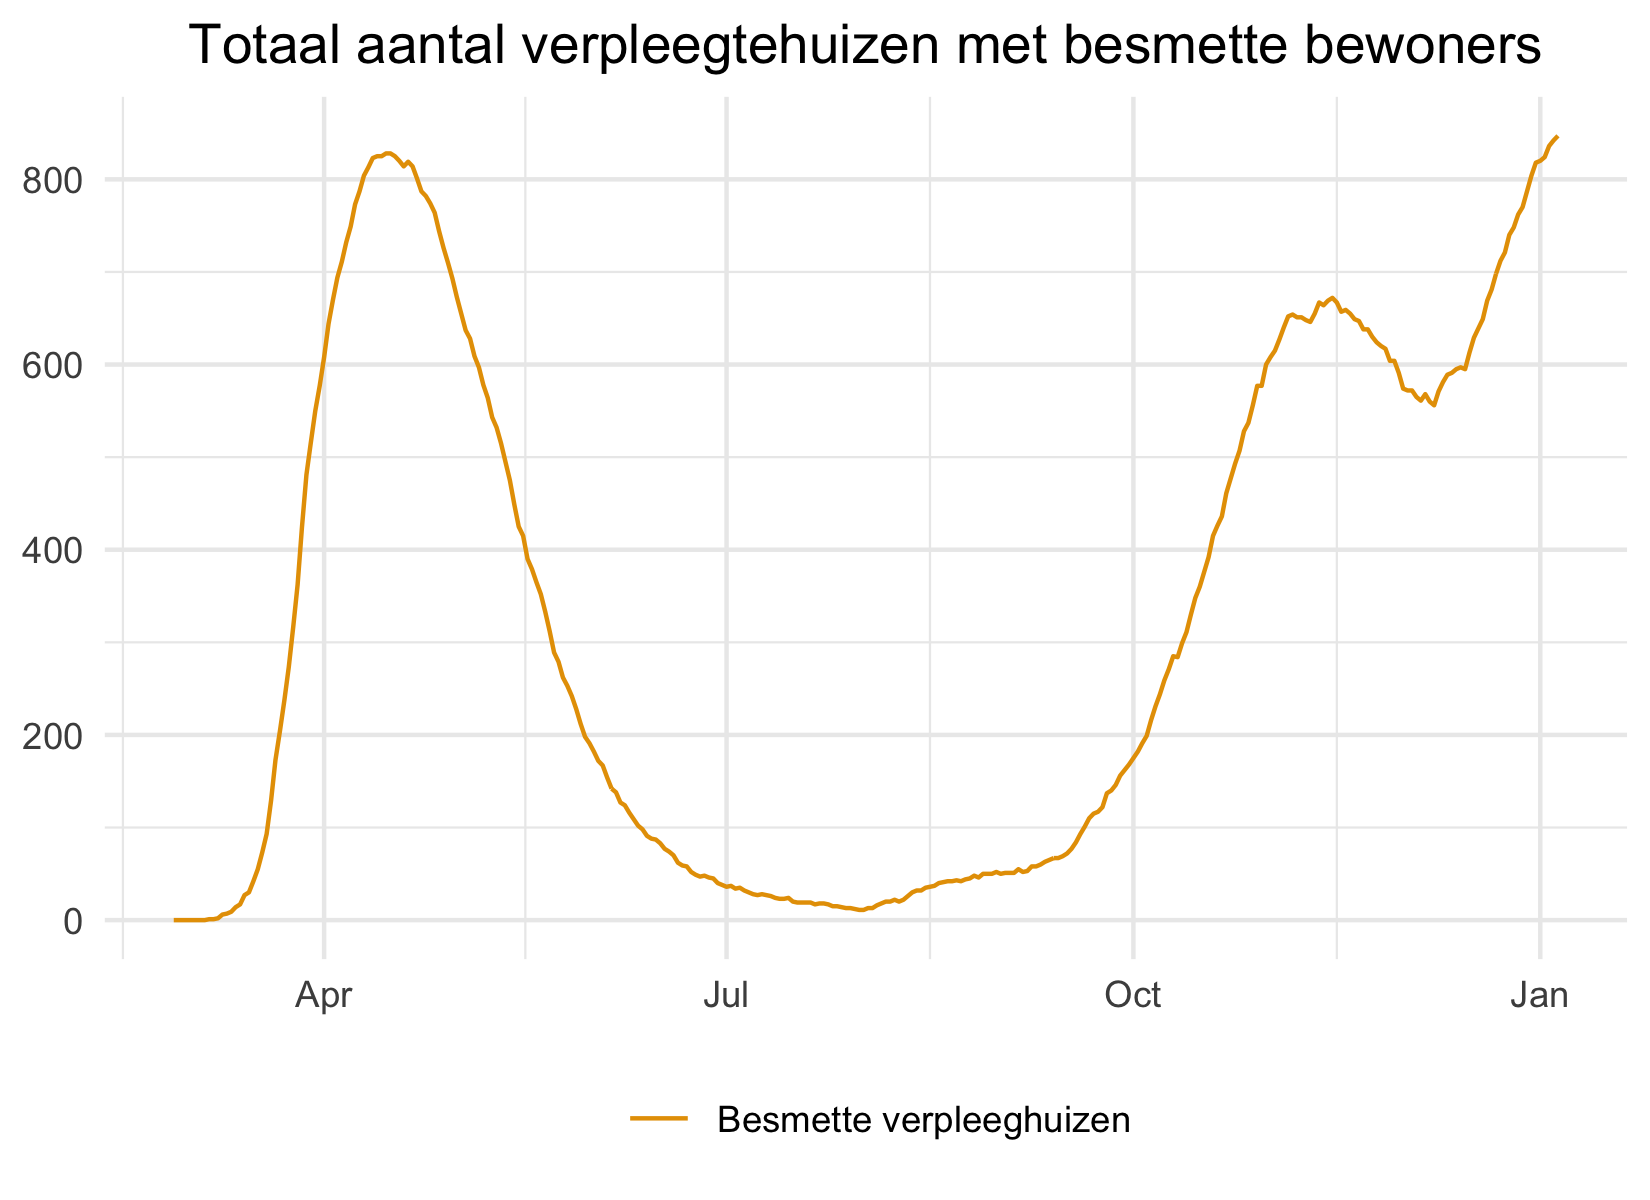
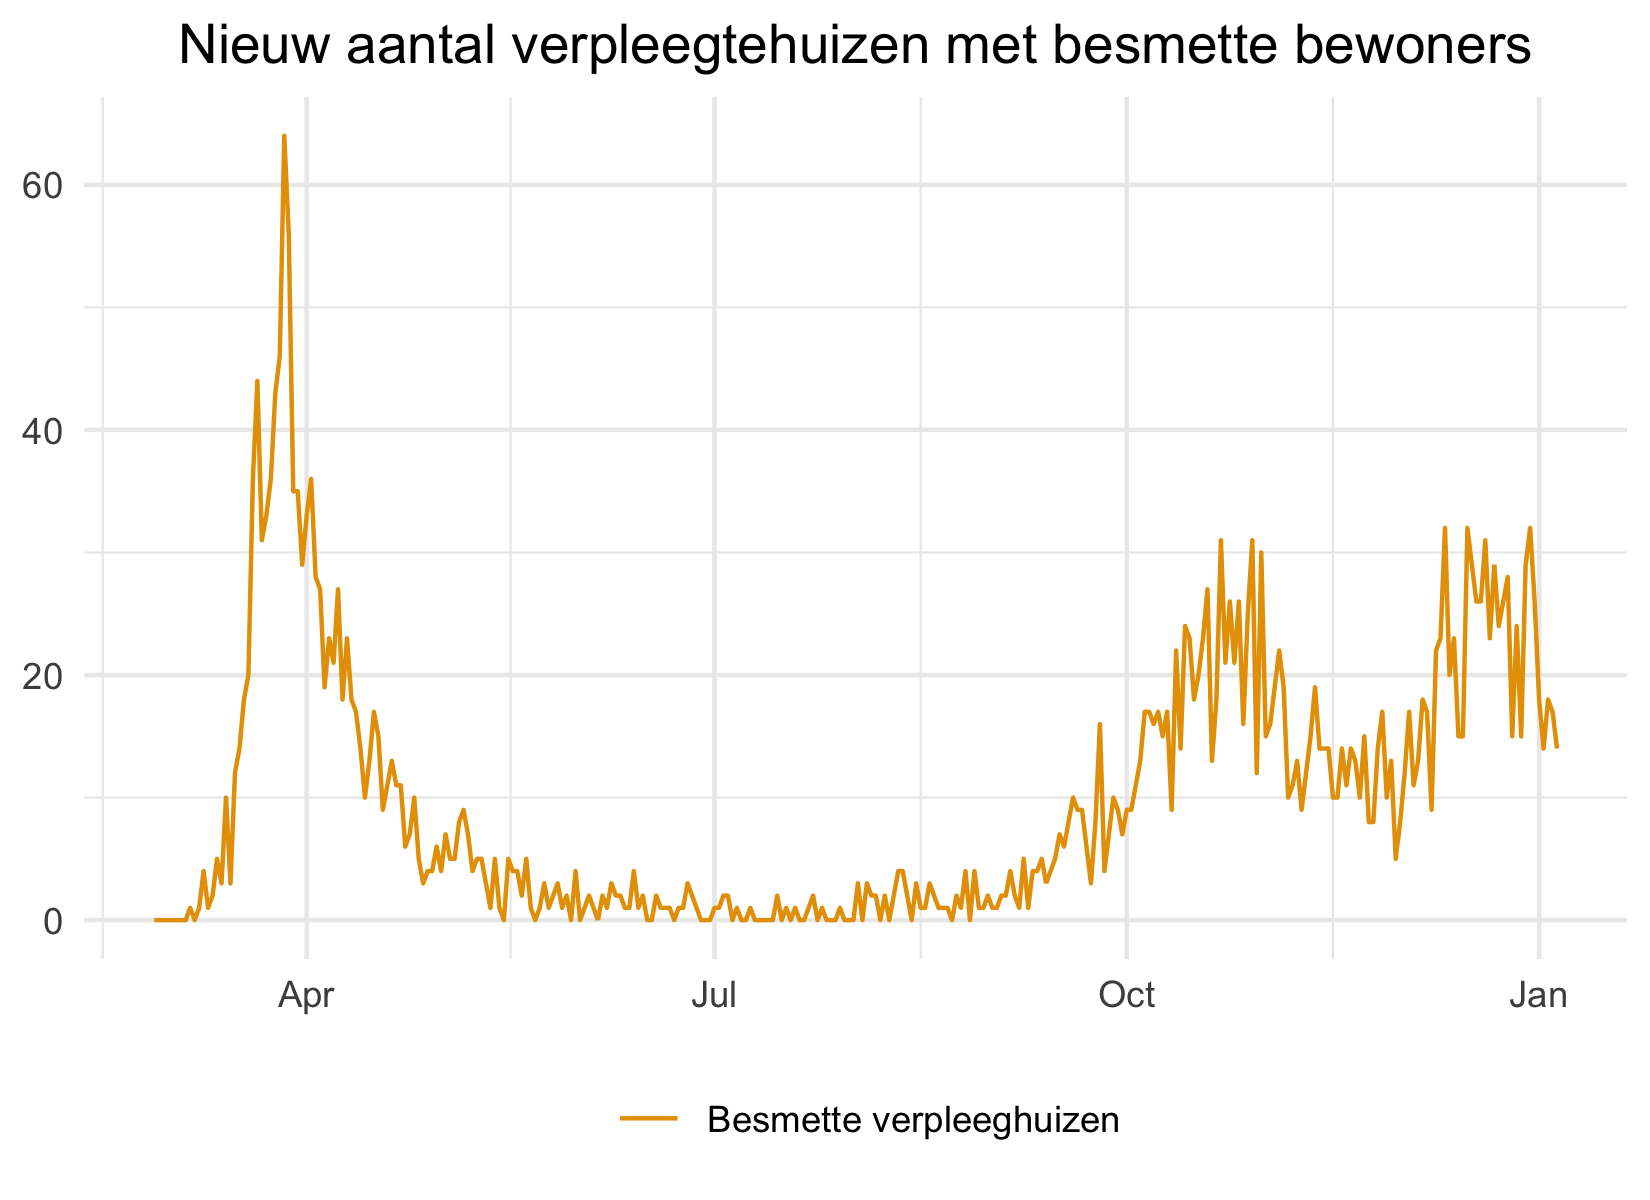
The number of (deceased) nursery home residents infected with COVID-19 are shown here.
Miscellaneous datasets
This folder contains datasets describing various miscellaneous topics, such as the number of (positively) tested people, the underlying conditions and/or pregnancy of deceased cases younger than 70, an overview of the reinforced measures and press releases in the Netherlands, and a list of companies that requested and received an advance on their reimbursement.
For more detail about the specific structure of the miscellaneous datasets, have a look at the data-misccodebook.
| Dataset | Source | Variables |
|---|---|---|
| COVID-19 tests in NL per week | RIVM | Year, Calendar week, Start date (Monday), End date (Sunday), Included labs, Type (Total and positive tests), Count |
| COVID-19 tests in NL per week by GGD-GHOR | GGD-GHOR | Year, Calendar week, Start date (Monday), End date (Sunday), Type (Total), Count |
| Underlying conditions and/or pregnancy in deceased COVID-19 cased under the age of 70 | RIVM | Date, Type of condition, Cumulative count |
| COVID-19 measures by the government | European Commission Joint Research Centre | Various variables on governmental measures (in English) |
| RIVM press releases | RIVM | Date and Time, Content of press release |
| NOW registry | UWV | Company, Location, Advance |
Visualizations miscellaneous data
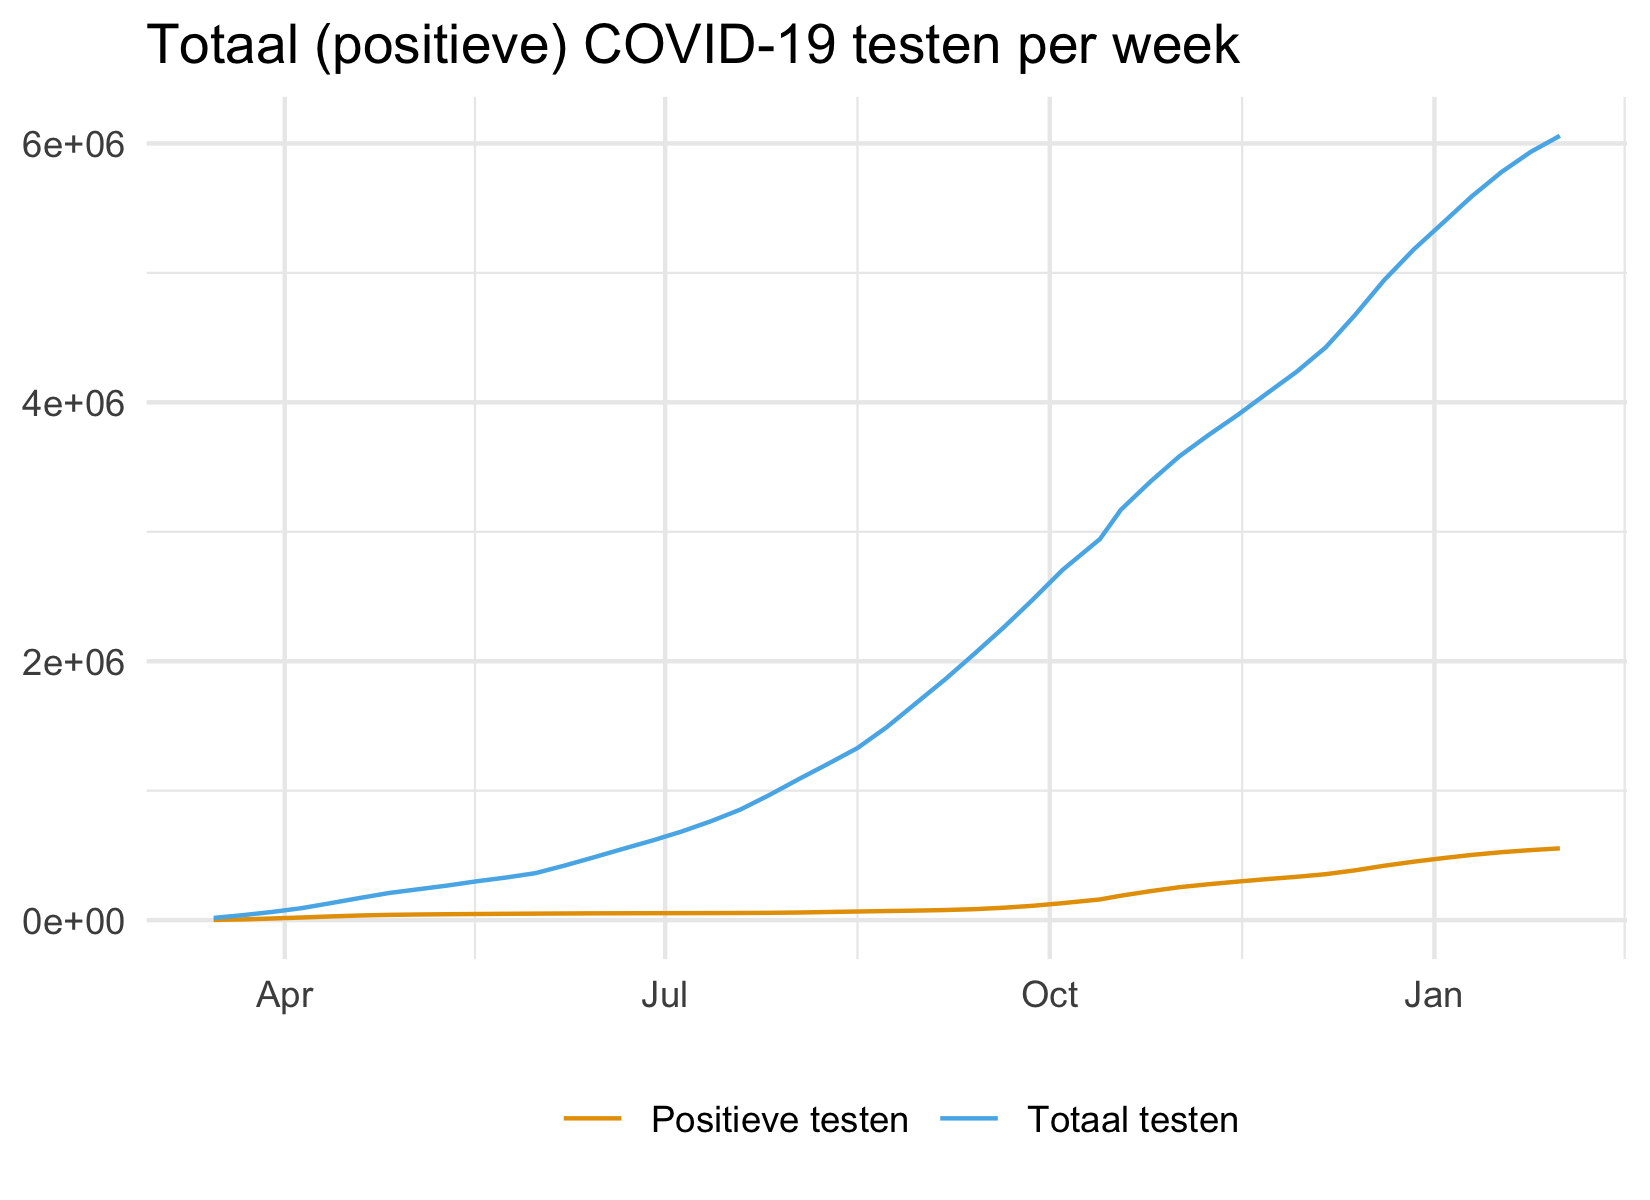
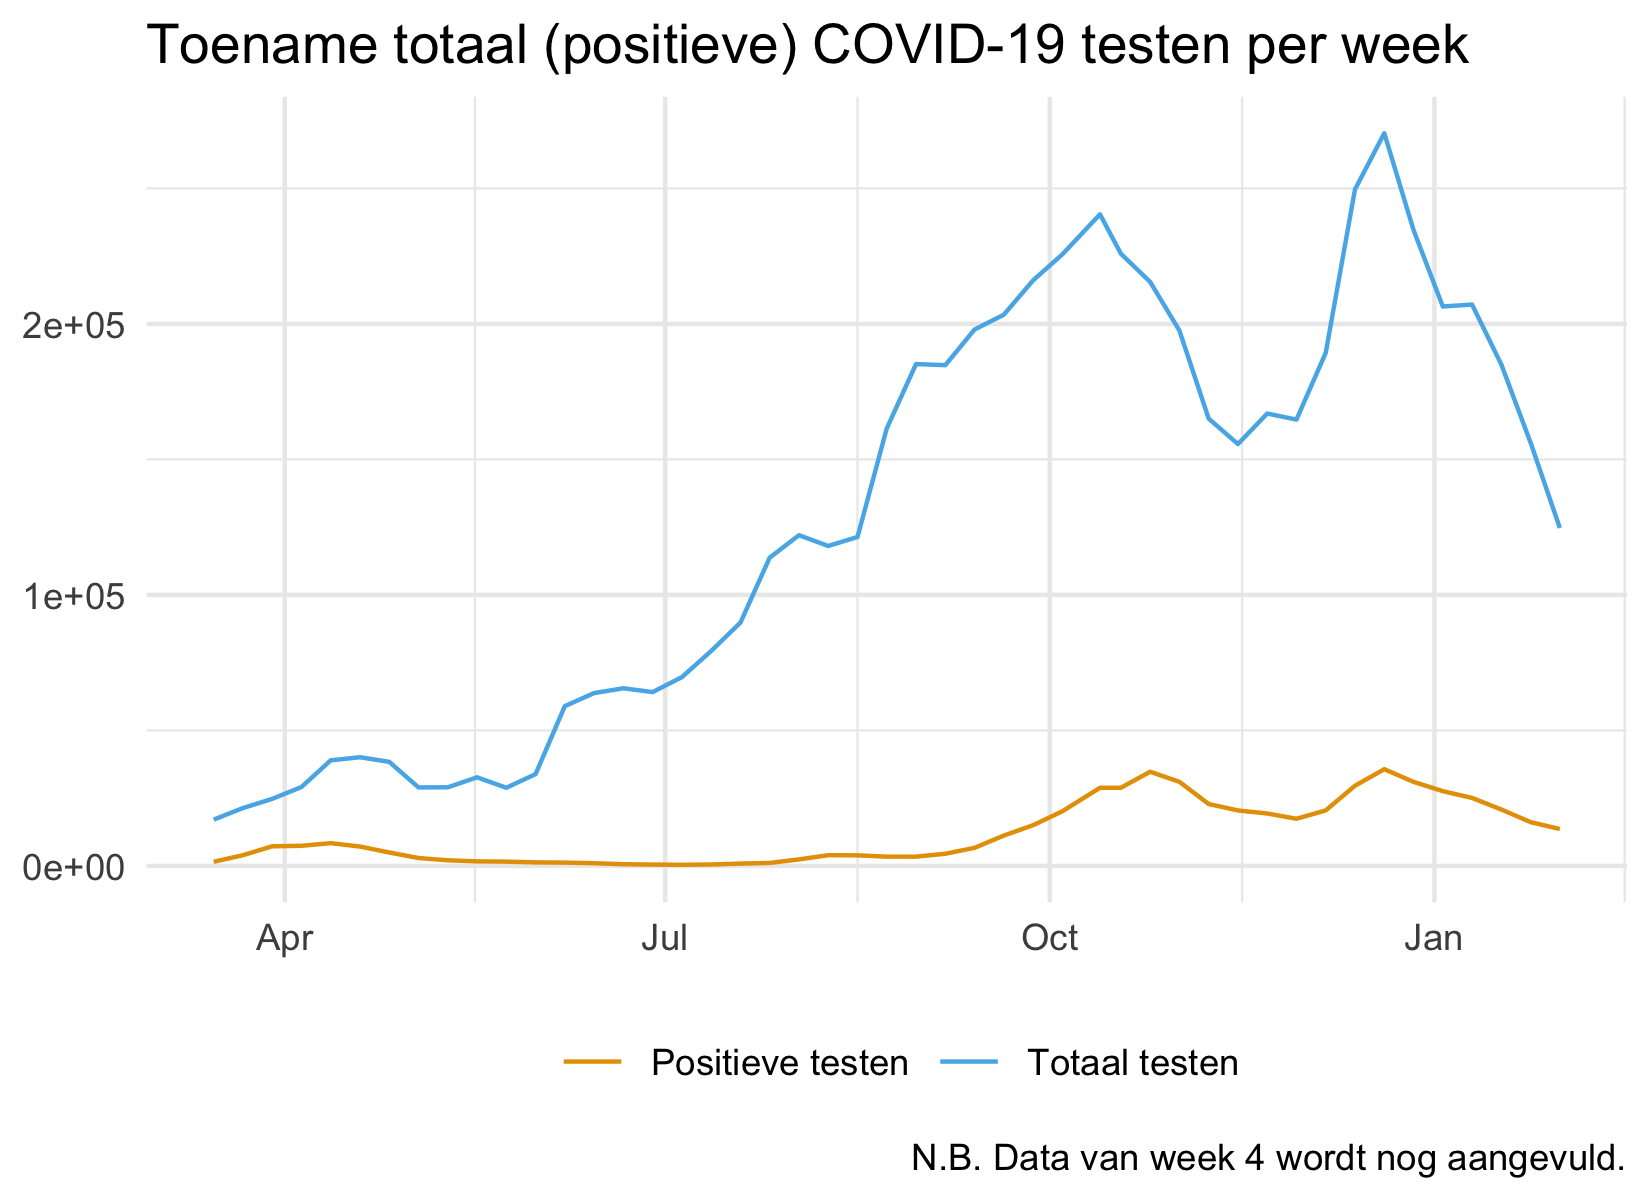
These graphs display the number of (positively) tested people per week. The end date of each week - Sunday - is used as indicator for the respective week.
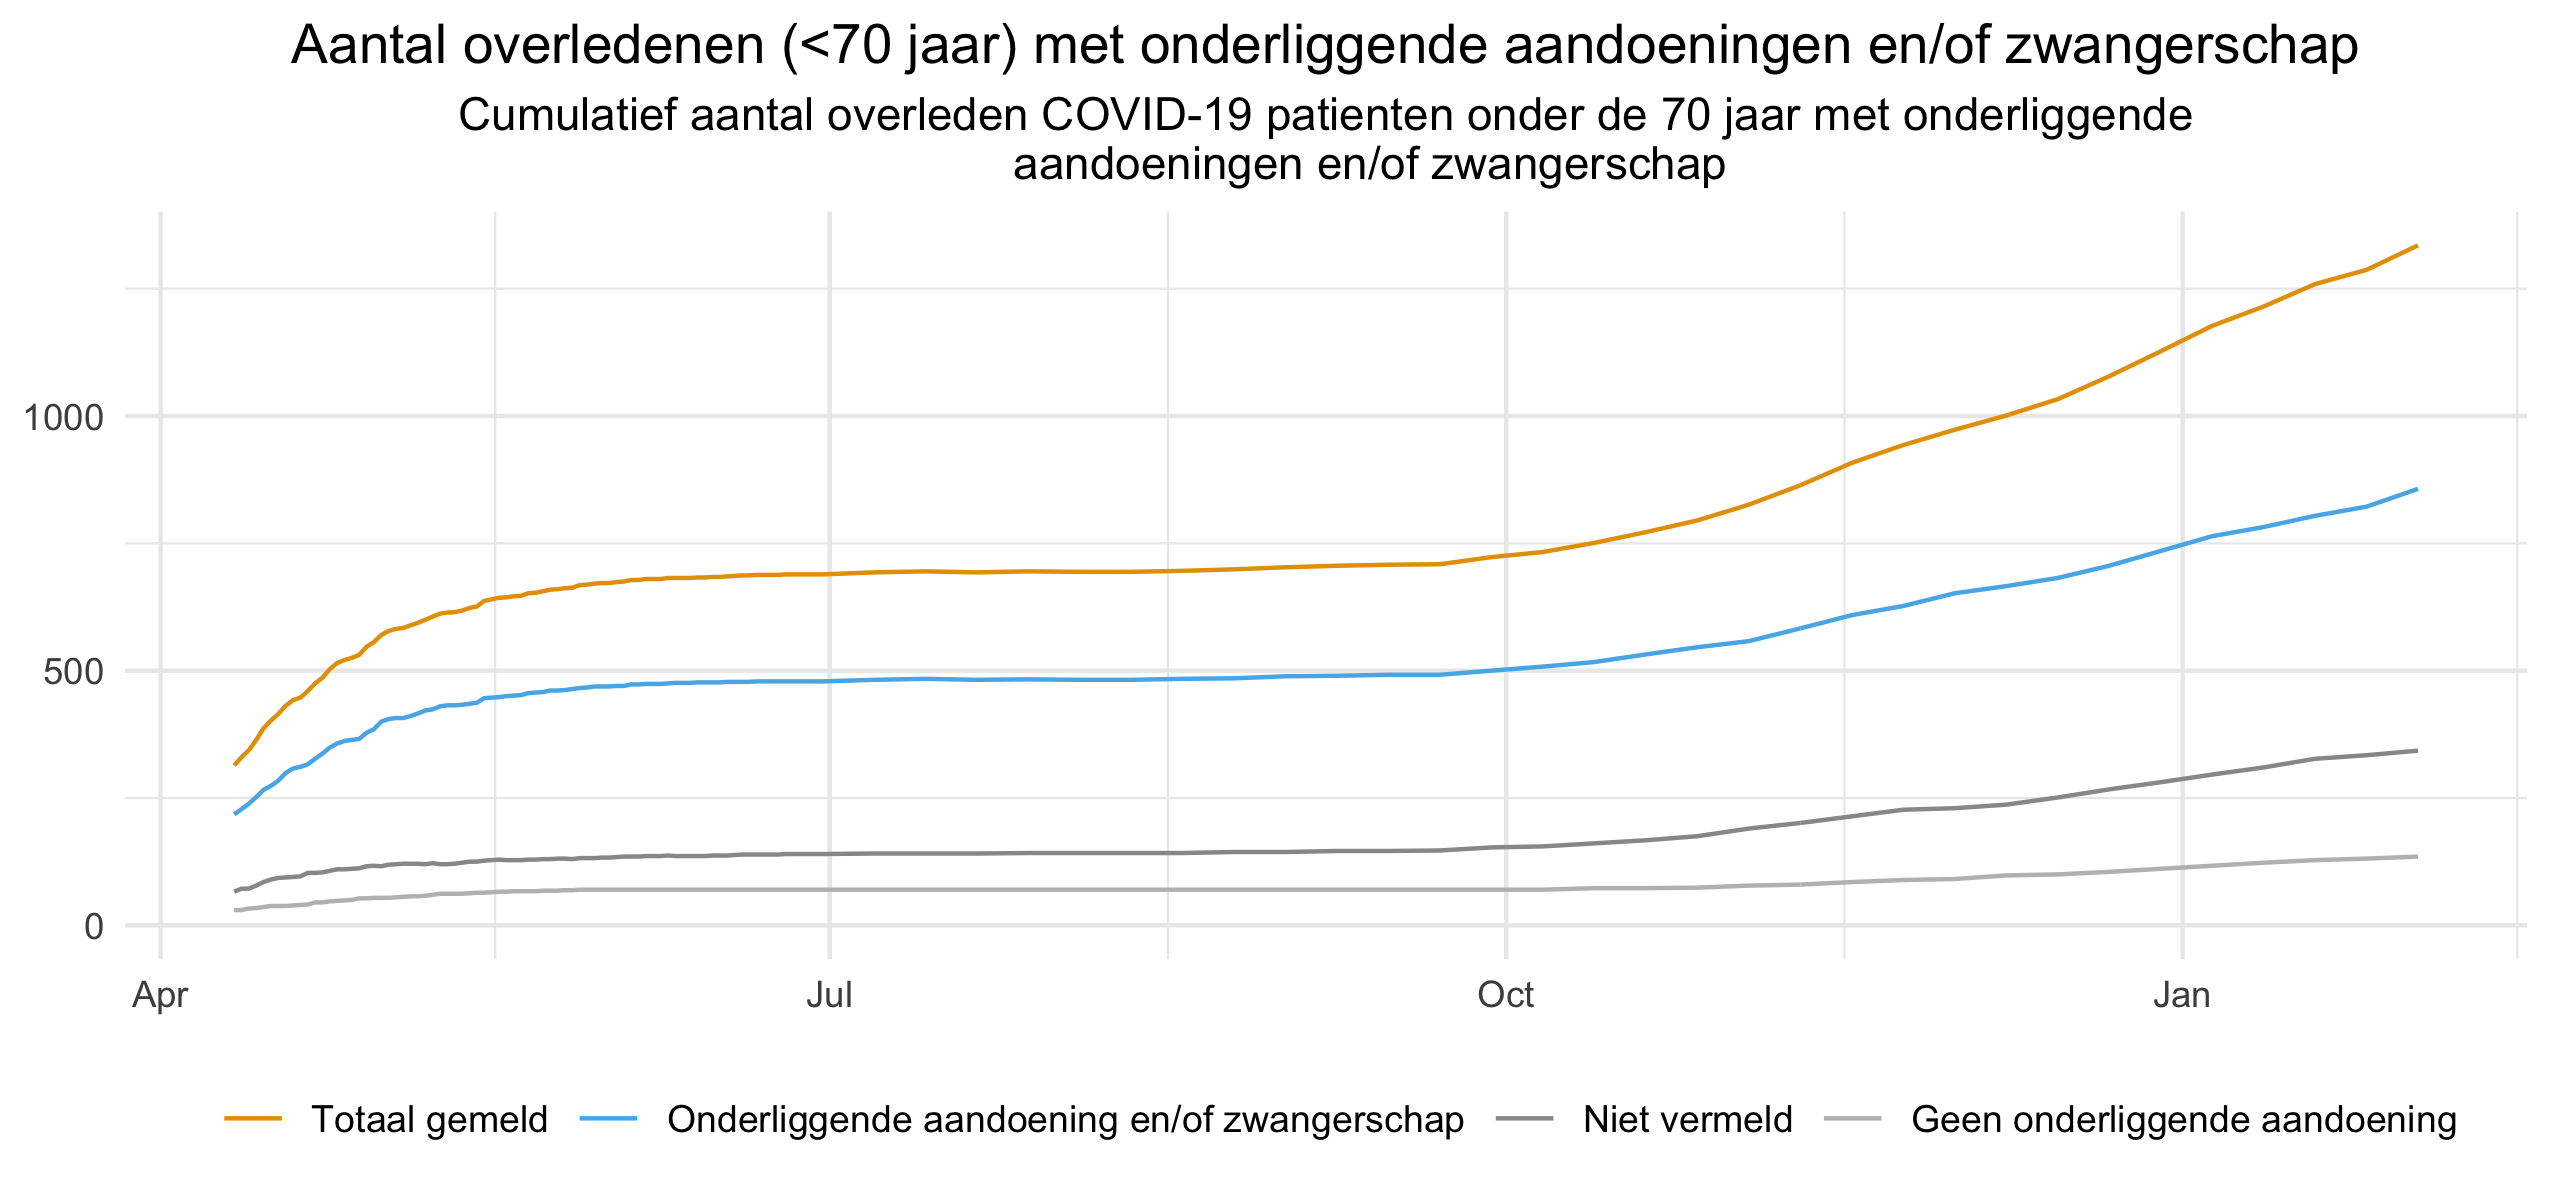
Below, the cumulative number of deceased COVID-19 cases younger than 70 with and without underlying conditions and/or pregnancy are displayed per notification date.
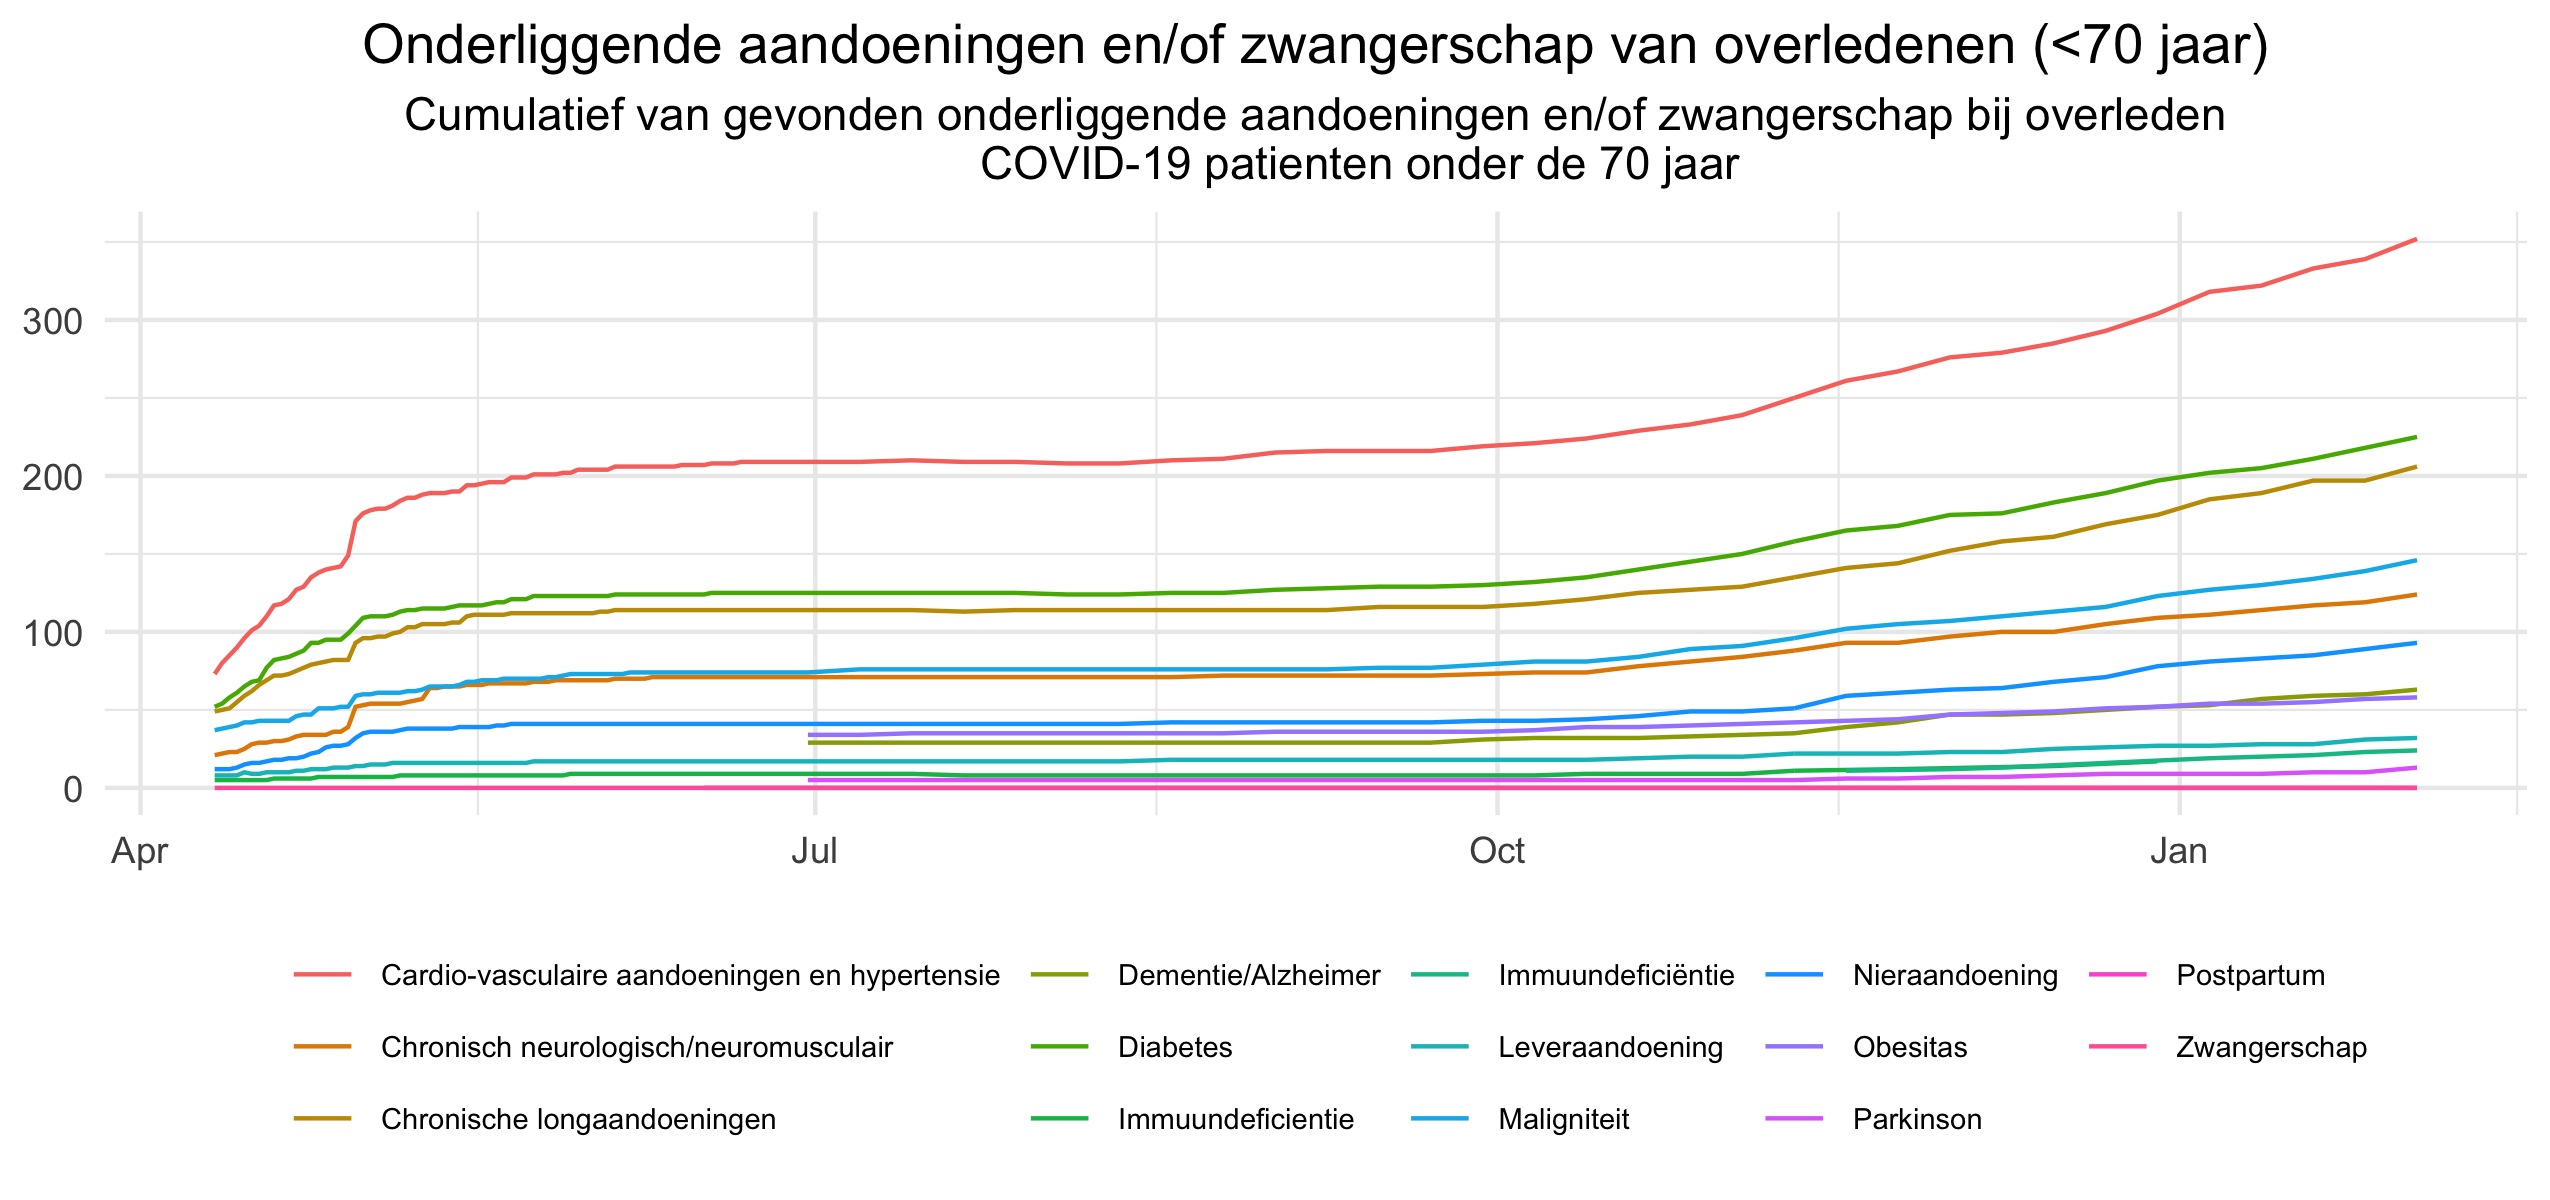
The cumulative number of specific conditions found in these deceased COVID-19 cases are shown here.
Inactive/deprecated datasets
Deprecated (pending)
The following datasets are awaiting deprecation. They are (being) replaced by new datasets.
| Dataset | Source | Variables | Alternative |
|---|---|---|---|
| COVID-19 disease case counts in NL | RIVM | Date, Number of positive COVID-19 disease cases in NL | COVID-19 case counts in NL |
| COVID-19 fatalities in NL | RIVM | Date, Number of COVID-19 fatalities in NL | COVID-19 case counts in NL |
| COVID-19 hospitalizations in NL | RIVM | Date, Number of COVID-19 hospitalized patients in NL | COVID-19 case counts in NL |
| Newly reported relative case counts by date in NL per municipality (PDF maps)* | RIVM | Date, Type, Number of positive COVID-19 disease cases, hospitalizations and fatalities per 100.000 people, Municipality, Province | Reported case counts by date in NL per municipality |
| COVID-19 age distribution | RIVM | Date, Type, Age, number of cases | data-desc#age |
| COVID-19 sex distribution | RIVM | Date, Type, Sex, number of cases | data-desc#sex |
* This dataset is extracted from the maps in the PDF's. The values are relative counts per 100.000 residents in the municipality.
Inactive
The following datasets are no longer appended with new data (because RIVM is no longer providing the data).
| Dataset | URL | Source | Variables | Expire date |
|---|---|---|---|---|
| COVID-19 disease case counts in NL* | [long format] [wide format] | RIVM | Date, Number of positive COVID-19 disease cases in NL, Municipality of residence, Municipality code (2019), Province | 2020-03-30 |
| Test count (before 2020-04-20) | Test count | RIVM | PublicatieDatum, Datum, Labs, Type, Aantal | 2020-04-20 |
* Nowadays, the data is published again. Please use dataset data-geo#municipal.
Raw data
CoronaWatchNL collects copies of the raw data such that data collection is verifiable. Copies of the collected data can be found in the folder raw_data. The data isn't standardised.
Data collection sources
The following sources are used for data collection.
| Source | Institute | Variables |
|---|---|---|
| https://www.rivm.nl/coronavirus-covid-19/actueel | RIVM | National cumulative numbers and press releases |
| https://www.rivm.nl/coronavirus-covid-19/grafieken | RIVM | Case counts per day |
| https://www.rivm.nl/coronavirus-covid-19/actueel/wekelijkse-update-epidemiologische-situatie-covid-19-in-nederland | RIVM | Epidemiological report |
| https://ggdghor.nl/actueel-bericht/ | GGD-GHOR | Test data |
| https://www.stichting-nice.nl/ | Stichting NICE | Intensive care numbers on COVID-19 patients |
| https://www.lcsp.nu/ | LCPS | Intensive care numbers on COVID-19 patients |
| https://coronadashboard.rijksoverheid.nl/ | National Dashboard | Various variables and estimations like Reproduction Index |
| https://covid-statistics.jrc.ec.europa.eu/ | European Commision Joint Research Centre | Governmental measures database |
| https://www.uwv.nl/overuwv/pers/documenten/2020/gegevens-ontvangers-now-1-0-regeling.aspx/ | Employee Insurance Agency | NOW registry |
License and academic use
The graphs and data are licensed CC0. The original data is copyright RIVM.
For academic use, use presistent data from ![]() . This is a persistent copy of the data. Version number refer to the date. Please cite:
. This is a persistent copy of the data. Version number refer to the date. Please cite:
De Bruin, J. (2020). Number of diagnoses with coronavirus disease (COVID-19) in The Netherlands (Version v2020.3.15) [Data set]. Zenodo. http://doi.org/10.5281/zenodo.3711575
CoronaWatchNL
CoronaWatchNL is collective of researchers and volunteers in The Netherlands. We aim to make the reported number on COVID-19 disease in The Netherlands FAIR. The project is initiated and maintained by Utrecht University Research Data Management Support and receives support from Utrecht University Applied Data Science.
Help on this project is appreciated. We are looking for new datasets, data updates, graphs and maps. Please report issues in the Issue Tracker. Want to contribute? Please check out the help wanted tag in the Issue Tracker. Do you wish to share an application based on these datasets? Have a look at the applications folder. For predictive models, check out the parallel repository CoronaWatchNL Extended.
Please send an email to [email protected] and/or [email protected]