jhuckaby / Cronicle
Programming Languages
Projects that are alternatives of or similar to Cronicle
Overview
Cronicle is a multi-server task scheduler and runner, with a web based front-end UI. It handles both scheduled, repeating and on-demand jobs, targeting any number of worker servers, with real-time stats and live log viewer. It's basically a fancy Cron replacement written in Node.js. You can give it simple shell commands, or write Plugins in virtually any language.
Features at a Glance
- Single or multi-server setup.
- Automated failover to backup servers.
- Auto-discovery of nearby servers.
- Real-time job status with live log viewer.
- Plugins can be written in any language.
- Schedule events in multiple timezones.
- Optionally queue up long-running events.
- Track CPU and memory usage for each job.
- Historical stats with performance graphs.
- Simple JSON messaging system for Plugins.
- Web hooks for external notification systems.
- Simple REST API for scheduling and running events.
- API Keys for authenticating remote apps.
Table of Contents
Table of Contents
- Installation
- Setup
-
Configuration
-
Basics
- base_app_url
- email_from
- smtp_hostname
- smtp_port
- mail_options
- secret_key
- log_dir
- log_filename
- log_columns
- log_archive_path
- copy_job_logs_to
- queue_dir
- pid_file
- debug_level
- maintenance
- list_row_max
- job_data_expire_days
- child_kill_timeout
- dead_job_timeout
- master_ping_freq
- master_ping_timeout
- udp_broadcast_port
- scheduler_startup_grace
- universal_web_hook
- web_hook_custom_data
- web_hook_custom_opts
- web_hook_text_templates
- ssl_cert_bypass
- job_memory_max
- job_memory_sustain
- job_cpu_max
- job_cpu_sustain
- job_log_max_size
- job_env
- server_comm_use_hostnames
- web_direct_connect
- web_socket_use_hostnames
- socket_io_transports
- Storage Configuration
- Web Server Configuration
- User Configuration
- Email Configuration
-
Basics
-
Web UI
- Home Tab
- Schedule Tab
- Completed Jobs Tab
- Job Details Tab
- My Account Tab
- Administration Tab
- Plugins
- Command Line
- Inner Workings
- API Reference
- Development
- Companies Using Cronicle
- Colophon
- License
Glossary
A quick introduction to some common terms used in Cronicle:
| Term | Description |
|---|---|
| Primary Server | The primary server which keeps time and runs the scheduler, assigning jobs to other servers, and/or itself. |
| Backup Server | A worker server which will automatically become primary and take over duties if the current primary dies. |
| Worker Server | A server which sits idle until it is assigned jobs by the primary server. |
| Server Group | A named group of servers which can be targeted by events, and tagged as "primary eligible", or "worker only". |
| API Key | A special key that can be used by external apps to send API requests into Cronicle. Remotely trigger jobs, etc. |
| User | A human user account, which has a username and a password. Passwords are salted and hashed with bcrypt. |
| Plugin | Any executable script in any language, which runs a job and reads/writes JSON to communicate with Cronicle. |
| Schedule | The list of events, which are scheduled to run at particular times, on particular servers. |
| Category | Events can be assigned to categories which define defaults and optionally a color highlight in the UI. |
| Event | An entry in the schedule, which may run once or many times at any interval. Each event points to a Plugin, and a server or group to run it. |
| Job | A running instance of an event. If an event is set to run hourly, then a new job will be created every hour. |
Installation
Please note that Cronicle currently only works on POSIX-compliant operating systems, which basically means Unix/Linux and OS X. You'll also need to have Node.js LTS pre-installed on your server. Please note that we only support the Active LTS versions of Node.js. Cronicle may not work on the "current" release channel. See Node.js Releases for details.
Once you have Node.js LTS installed, type this as root:
curl -s https://raw.githubusercontent.com/jhuckaby/Cronicle/master/bin/install.js | node
This will install the latest stable release of Cronicle and all of its dependencies under: /opt/cronicle/
If you'd rather install it manually (or something went wrong with the auto-installer), here are the raw commands:
mkdir -p /opt/cronicle
cd /opt/cronicle
curl -L https://github.com/jhuckaby/Cronicle/archive/v1.0.0.tar.gz | tar zxvf - --strip-components 1
npm install
node bin/build.js dist
Replace v1.0.0 with the desired Cronicle version from the release list, or master for the head revision (unstable).
Setup
If this is your first time installing, please read the Configuration section first. You'll likely want to customize a few configuration parameters in the /opt/cronicle/conf/config.json file before proceeding. At the very least, you should set these properties:
| Key | Description |
|---|---|
base_app_url |
A fully-qualified URL to Cronicle on your server, including the http_port if non-standard. This is used in e-mails to create self-referencing URLs. |
email_from |
The e-mail address to use as the "From" address when sending out notifications. |
smtp_hostname |
The hostname of your SMTP server, for sending mail. This can be 127.0.0.1 or localhost if you have sendmail running locally. |
secret_key |
For multi-server setups (see below) all your servers must share the same secret key. Any randomly generated string is fine. |
job_memory_max |
The default maximum memory limit for each job (can also be customized per event and per category). |
http_port |
The web server port number for the user interface. Defaults to 3012. |
Now then, the only other decision you have to make is what to use as a storage back-end. Cronicle can use local disk (easiest setup), Couchbase or Amazon S3. For single server installations, or even single primary with multiple workers, local disk is probably just fine, and this is the default setting. But if you want to run a true multi-server cluster with automatic primary failover, please see Multi-Server Cluster for details.
With that out of the way, run the following script to initialize the storage system. You only need to do this once, and only on the primary server. Do not run this on any worker servers:
/opt/cronicle/bin/control.sh setup
Among other things, this creates an administrator user account you can use to login right away. The username is admin and the password is admin. It is recommended you change the password as soon as possible, for security purposes (or just create your own administrator account and delete admin).
At this point you should be able to start the service and access the web UI. Enter this command:
/opt/cronicle/bin/control.sh start
Give it a minute to decide to become primary, then send your browser to the server on the correct port:
http://YOUR_SERVER_HOSTNAME:3012/
You only need to include the port number in the URL if you are using a non-standard HTTP port (see Web Server Configuration).
See the Web UI section below for instructions on using the Cronicle web interface.
Single Server
For a single server installation, there is nothing more you need to do. After installing the package, running the bin/control.sh setup script and starting the service, Cronicle should be 100% ready to go. You can always add more servers later (see below).
Single Primary with Workers
The easiest multi-server Cronicle setup is a single "primary" server with one or more workers. This means that one server is the scheduler, so it keeps track of time, and assigns jobs for execution. Jobs may be assigned to any number of worker servers, and even the primary itself. Worker servers simply sit idle and wait for jobs to be assigned by the primary server. Workers never take over primary scheduling duties, even if the primary server goes down.
This is the simplest multi-server setup because the primary server can use local disk for all its storage. Workers do not need access to the file storage. This is the default configuration, so you don't have to change anything at all. What it means is, all the scheduling data, event categories, user accounts, sessions, plugins, job logs and other data is stored as plain JSON files on local disk. Cronicle can also be configured to use a NoSQL database such as Couchbase or Amazon S3, but this is not required.
So by default, when you run the setup script above, the current server is placed into a "Primary Group", meaning it is the only server that is eligible to become primary. If you then install Cronicle on additional servers, they will become workers only. You can change all this from the UI, but please read the next section before running multiple primary backup servers.
When installing Cronicle onto worker servers, please do not run the bin/control.sh setup script. Instead, simply copy over your conf/config.json file, and then start the service.
Multi-Server Cluster
Cronicle also has the ability to run with one or more "backup" servers, which can become primary if need be. Failover is automatic, and the cluster negotiates who should be primary at any given time. But in order for this to work, all the primary eligible servers need access to the same storage data. This can be achieved in one of three ways:
See the Storage Configuration section below for details on these.
The other thing you'll need to do is make sure all your primary backup servers are in the appropriate server group. By default, a single "Primary Group" is created which only contains your primary primary server. Using the UI, you can simply change the hostname regular expression so it encompasses all your eligible servers, or you can just add additional groups that match each backup server. More details can be found in the Servers Tab section below.
Load Balancers
You can run Cronicle behind a load balancer, as long as you ensure that only the primary server and eligible backup servers are in the load balancer pool. Do not include any worker-only servers, as they typically do not have access to the back-end storage system, and cannot serve up the UI.
You can then set the base_app_url configuration parameter to point to the load balancer, instead of an individual server, and also use that hostname when loading the UI in your browser.
Note that Web UI needs to make API calls and open WebSocket connections to the primary server directly, so it needs to also be accessible directly via its hostname.
You must set the web_direct_connect configuration property to true. This ensures that the Web UI will make API and WebSocket connections directly to the primary server, rather than via the load balancer hostname.
Ops Notes
For teams setting up multi-server clusters, here are some operational concerns to keep in mind:
- All servers should have the same exact configuration file (
/opt/cronicle/conf/config.json). - All servers need to have correct clocks (timezones do not matter, clock sync does).
- Server auto-discovery happens via UDP broadcast on port 3014 (by default). This is not required.
- The primary server will also open TCP WebSocket connections to each worker on the web server port.
- Each server in the cluster needs to have a fully-qualified hostname that resolves in DNS.
- The server hostnames determine priority of which server becomes primary (alphabetical sort).
- All servers need to have unique hostnames (very bad things will happen otherwise).
- All servers need to have at least one active IPv4 interface.
- For the "live log" feature in the UI to work, the user needs a network route to the server running the job, via its hostname.
- If you have to change any server IP addresses, they'll have to be removed and re-added to the cluster.
- See the Cron Noncompliance section for differences in how Cronicle schedules events, versus the Unix Cron standard.
Configuration
The main Cronicle configuration file is in JSON format, and can be found here:
/opt/cronicle/conf/config.json
Please edit this file directly. It will not be touched by any upgrades. A pristine copy of the default configuration can always be found here: /opt/cronicle/sample_conf/config.json.
Basics
Here are descriptions of the top-level configuration parameters:
base_app_url
This should be set to a fully-qualified URL, pointing to your Cronicle server, including the HTTP port number if non-standard. Do not include a trailing slash. This is used in e-mails to create self-referencing URLs. Example:
http://local.cronicle.com:3012
If you are running Cronicle behind a load balancer, this should be set to the load balanced virtual hostname.
email_from
The e-mail address to use as the "From" address when sending out notifications. Most SMTP servers require this to be a valid address to accept mail.
smtp_hostname
The hostname of your SMTP server, for sending mail. This can be set to 127.0.0.1 or localhost if you have sendmail running locally.
smtp_port
The port number to use when communicating with the SMTP server. The default is 25.
mail_options
Set specific mailer options, such as SMTP SSL and authentication, passed directly to pixl-mail (and then to nodemailer). Example:
"mail_options": {
	"secure", true,
	"auth": { user: "fsmith", pass: "12345" },
	"connectionTimeout": 10000,
	"greetingTimeout": 10000,
	"socketTimeout": 10000
}
The connectionTimeout, greetingTimeout and socketTimeout properties are all expressed in milliseconds.
You can also use mail_options to use local sendmail, if you have that configured on your server. To do this, set the following properties, and tune as needed:
"mail_options": {
	"sendmail": true,
	"newline": "unix",
	"path": "/usr/sbin/sendmail"
}
You can omit smtp_hostname and smtp_port if you are using sendmail.
secret_key
For multi-server setups, all your Cronicle servers need to share the same secret key. Any randomly generated string is fine.
The install script will automatically set to this to a random string for you, but you are free to change it to anything you want. Just make sure all your servers have the same shared secret key. This is used to authenticate internal server-to-server API requests.
log_dir
The directory where logs will be written, before they are archived. This can be a partial path, relative to the Cronicle base directory (/opt/cronicle) or a full path to a custom location. It defaults to logs (i.e. /opt/cronicle/logs).
log_filename
The filename to use when writing logs. You have three options here: a single combined log file for all logs, multiple log files for each component, or multiple log files for each category (debug, transaction, error). See the Logs section below for details.
log_columns
This is an array of column IDs to log. You are free to reorder or remove some of these, but do not change the names. They are specific IDs that match up to log function calls in the code. See the Logs section below for details.
log_archive_path
Every night at midnight (local server time), the logs can be archived (gzipped) to a separate location. This parameter specifies the path, and the directory naming / filenaming convention of the archive files. It can utilize date placeholders including [yyyy], [mm] and [dd].
This can be a partial path, relative to the Cronicle base directory (/opt/cronicle) or a full path to a custom location. It defaults to logs/archives/[yyyy]/[mm]/[dd]/[filename]-[yyyy]-[mm]-[dd].log.gz.
copy_job_logs_to
Your job logs (i.e. the output from Plugins) are stored separately from the main Cronicle log files. They are actually written to the Cronicle storage system, and made available in the UI. This parameter allows you to copy them to a separate directory on disk, presumably for some kind of log processing system (such as Splunk) to then pick them up, index them, etc. It is optional, and defaults to disabled.
This can be a partial path, relative to the Cronicle base directory (/opt/cronicle) or a full path to a custom location.
queue_dir
The queue directory is used internally for misc. background tasks, such as handling detached jobs sending messages back to the daemon. You shouldn't ever have to deal with this directly, and the directory is auto-created on install.
This can be a partial path, relative to the Cronicle base directory (/opt/cronicle) or a full path to a custom location.
pid_file
The PID file is simply a text file containing the Process ID of the main Cronicle daemon. It is used by the control.sh script to stop the daemon, and detect if it is running. You should never have to deal with this file directly, and it defaults to living in the logs directory which is auto-created.
This can be a partial path, relative to the Cronicle base directory (/opt/cronicle) or a full path to a custom location. However, it should probably not be changed, as the control.sh script expects it to live in logs/cronicled.pid.
debug_level
The level of verbosity in the debug logs. It ranges from 1 (very quiet) to 10 (extremely loud). The default value is 9.
maintenance
Cronicle needs to run storage maintenance once per day, which generally involves deleting expired records and trimming lists which have grown too large. This only runs on the primary server, and typically only takes a few seconds, depending on the number of events you have. The application is still usable during this time, but UI performance may be slightly impacted.
By default the maintenance is set to run at 4:00 AM (local server time). Feel free to change this to a more convenient time for your server environment. The format of the parameter is HH:MM.
list_row_max
This parameter controls how many items are kept in historical lists such as the Activity Log, Completed Jobs, and Event History. When this limit is exceeded, the oldest entries are removed during the nightly maintenance run. The default limit is 10000 items.
This has no real effect on performance -- only space on disk (or Couchbase / S3).
job_data_expire_days
Completed job data is only kept around for this number of days. This includes job logs and the metadata for each completed job (stats, etc.). The default value is 180 days, but feel free to tune this for your own environment.
This has no real effect on performance -- only space on disk (or Couchbase / S3).
child_kill_timeout
This is the number of seconds to allow child processes to exit after sending a TERM signal (for aborted jobs, server shutdown, etc.). If they do not exit within the specified timeout, a KILL signal is sent. The default value is 10 seconds.
dead_job_timeout
When the primary server loses connectivity with a worker that had running jobs on it, they go into a "limbo" state for a period of time, before they are finally considered lost. The dead_job_timeout parameter specifies the amount of time before these wayward jobs are aborted (and possibly retried, depending on the event settings). The default value is 120 seconds.
This parameter exists because certain networks may have unreliable connections between servers, and it is possible a server may drop for a few seconds, then come right back. If a short hiccup like that occurs, you probably don't want to abort all the running jobs right away. Also, when you are upgrading Cronicle itself, you don't want detached jobs to be interrupted.
The worst case scenario is that a remote server with running jobs goes MIA for longer than the dead_job_timeout, the primary server aborts all the jobs, then the server reappears and finishes the jobs. This creates a bit of a mess, because the jobs are reported as both errors and successes. The latter success prevails in the end, but the errors stay in the logs and event history.
master_ping_freq
For multi-server clusters, this specifies how often the primary server should send out pings to worker servers, to let them know who is the boss. The default is 20 seconds.
master_ping_timeout
For multi-server clusters, this specifies how long to wait after receiving a ping, before a backup server considers the primary server to be dead. At this point a new primary server will be chosen. The default value is 60 seconds.
udp_broadcast_port
For auto-discovery of nearby servers, this specifies the UDP port to use for broadcasting. Do not worry if your network doesn't support UDP broadcast, as this is just an optional feature where nearby servers will show up in the UI. The default port is 3014.
scheduler_startup_grace
When the scheduler first starts up on the primary server, it waits for a few seconds before actually assigning jobs. This is to allow all the servers in the cluster to check in and register themselves with the primary server. The default value is 10 seconds, which should be plenty of time.
Once a server becomes primary, it should immediately attempt to connect to all remote servers right away. So in theory this grace period could be as short as 1 second or less, but a longer delay allows for any random network connectivity errors to work themselves out.
universal_web_hook
While you can specify a web hook in the UI per each category and/or per each event, this parameter allows you to define a universal one, which is always fired for every job regardless of UI settings. It should be a fully-qualified URL to an API endpoint that accepts an HTTP POST containing JSON data.
Web hooks are fired at the start and the end of each job (success or fail). A JSON record is sent in the HTTP POST body, which contains all the relevant information about the job, including an action property, which will be set to job_start at the start and job_complete at the end of the job. See the Web Hooks section below for more on the data format.
To include custom HTTP request headers with your web hook, append them onto the end of the URL using this format: [header: My-Header: My-Value]. Make sure to include a space before the opening bracket. Example URL:
https://myserver.com/api/chat.postMessage [header: My-Header: My-Value]
web_hook_custom_data
If you need to include custom JSON data with the web hook HTTP POST, you can do so by specifying a web_hook_custom_data property, and any keys/values will be merged in with the event data as it is sent to the web hook URL. Example:
"web_hook_custom_data": {
	"my_custom_key1": "My custom value 1",
	"my_custom_key2": "My custom value 2"
}
In this example my_custom_key1 and my_custom_key2 will be merged in with the event data that usually accompanies the web hook post data. See the Web Hooks section below for more on the data format.
web_hook_custom_opts
If you need to customize the low-level properties sent to the Node.js http.request method for making outbound web hook requests, use the web_hook_custom_opts property. Using this you can set things like a proxy host and port. Example use:
"web_hook_custom_opts": {
	"host": "my-corp-proxy.com",
	"port": 8080
}
See the http.request docs for all the possible properties you can set here.
web_hook_text_templates
The web hook JSON POST data includes a text property which is a simple summary of the action taking place, which is compatible with Slack Webhook Integrations. These text strings are generated based on the action, and use the following templates:
"web_hook_text_templates": {
	"job_start": "Job started on [hostname]: [event_title] [job_details_url]",
	"job_complete": "Job completed successfully on [hostname]: [event_title] [job_details_url]",
	"job_failure": "Job failed on [hostname]: [event_title]: Error [code]: [description] [job_details_url]",
	"job_launch_failure": "Failed to launch scheduled event: [event_title]: [description] [edit_event_url]"
}
You can customize these text strings by including a web_hook_text_templates object in your configuration, and setting each of the action properties within. Also, you can use this to disable any of the web hook actions, by simply removing certain action keys. For example, if you don't want to fire a web hook for starting a job, remove the job_start key. If you only want web hooks to fire for errors, remove both the job_start and job_complete keys.
The text string templates can use any data values from the web hook JSON data by inserting [square_bracket] placeholders. See the Web Hooks section below for more on the data format, and which values are available.
ssl_cert_bypass
If you are having trouble getting HTTPS web hooks or SSL SMTP e-mails to work, you might need to set ssl_cert_bypass to true. This causes Node.js to blindly accept all SSL connections, even when it cannot validate the SSL certificate. This effectively sets the following environment variable at startup:
process.env.NODE_TLS_REJECT_UNAUTHORIZED = "0";
Please only do this if you understand the security ramifications, and completely trust the host(s) you are connecting to, and the network you are on. Skipping the certificate validation step should really only be done in special circumstances, such as trying to hit one of your own internal servers with a self-signed cert.
For legacy compatibility, the old web_hook_ssl_cert_bypass property is still accepted, and has the same effect as ssl_cert_bypass.
job_memory_max
This parameter allows you to set a default memory usage limit for jobs, specified in bytes. This is measured as the total usage of the job process and any sub-processes spawned or forked by the main process. If the memory limit is exceeded, the job is aborted. The default value is 1073741824 (1 GB). To disable set it to 0.
Memory limits can also be customized in the UI per each category and/or per each event (see Event Resource Limits below). Doing either overrides the primary default.
job_memory_sustain
When using the job_memory_max feature, you can optionally specify how long a job is allowed exceed the maximum memory limit until it is aborted. For example, you may want to allow jobs to spike over 1 GB of RAM, but not use it sustained for more a certain amount of time. That is what the job_memory_sustain property allows, and it accepts a value in seconds. It defaults to 0 (abort instantly when exceeded).
Memory limits can also be customized in the UI per each category and/or per each event (see Event Resource Limits below). Doing either overrides the default.
job_cpu_max
This parameter allows you to set a default CPU usage limit for jobs, specified in percentage of one CPU core. This is measured as the total CPU usage of the job process and any sub-processes spawned or forked by the main process. If the CPU limit is exceeded, the job is aborted. The default value is 0 (disabled). For example, to allow jobs to use up to 2 CPU cores, specify 200 as the limit.
CPU limits can also be customized in the UI per each category and/or per each event (see Event Resource Limits below). Doing either overrides the default.
job_cpu_sustain
When using the job_cpu_max feature, you can optionally specify how long a job is allowed exceed the maximum CPU limit until it is aborted. For example, you may want to allow jobs to use up to 2 CPU cores, but not use them sustained for more a certain amount of time. That is what the job_cpu_sustain property allows, and it accepts a value in seconds. It defaults to 0 (abort instantly when exceeded).
CPU limits can also be customized in the UI per each category and/or per each event (see Event Resource Limits below). Doing either overrides the default.
job_log_max_size
This parameter allows you to set a default log file size limit for jobs, specified in bytes. If the file size limit is exceeded, the job is aborted. The default value is 0 (disabled).
Job log file size limits can also be customized in the UI per each category and/or per each event (see Event Resource Limits below). Doing either overrides the default.
job_env
Place any key/value pairs you want into the job_env object, and they will become environment variables passed to all job processes, as they are spawned. Note that these can be overridden by event parameters with the same names. The job_env can be thought of as a way to specify universal default environment variables for all your jobs. Example:
"job_env": {
	"TZ": "America/Los_Angeles",
	"LANG": "en_US.UTF-8"
},
server_comm_use_hostnames
Setting this parameter to true will force the Cronicle servers to connect to each other using hostnames rather than LAN IP addresses. This is mainly for special situations where your local server IP addresses may change, and you would prefer to rely on DNS instead. The default is false (disabled), meaning connect using IP addresses.
web_direct_connect
When this property is set to false (which is the default), the Cronicle Web UI will connect to whatever hostname/port is on the URL. It is expected that this hostname/port will always resolve to your primary server. This is useful for single server setups, situations when your users do not have direct access to your Cronicle servers via their IPs or hostnames, or if you are running behind some kind of reverse proxy.
If you set this parameter to true, then the Cronicle web application will connect directly to your individual Cronicle servers. This is more for multi-server configurations, especially when running behind a load balancer with multiple backup servers. The Web UI must always connect to the primary server, so if you have multiple backup servers, it needs a direct connection.
Note that the ability to watch live logs for active jobs requires a direct web socket connection to the server running the job. For that feature, this setting has no effect (it always attempts to connect directly).
web_socket_use_hostnames
Setting this parameter to true will force Cronicle's Web UI to connect to the back-end servers using their hostnames rather than IP addresses. This includes both AJAX API calls and Websocket streams. You should only need to enable this in special situations where your users cannot access your servers via their LAN IPs, and you need to proxy them through a hostname (DNS) instead. The default is false (disabled), meaning connect using IP addresses.
This property only takes effect if web_direct_connect is also set to true.
socket_io_transports
This is an advanced configuration property that you will probably never need to worry about. This allows you to customize the socket.io transports used to connect to the server for real-time updates. By default, this property is set internally to an array containing the websocket transport only, e.g.
"socket_io_transports": ["websocket"]
However, if you are trying to run Cronicle in an environment where WebSockets are not allowed (perhaps an ancient firewall or proxy), you can change this array to contain the polling transport first, e.g.
"socket_io_transports": ["polling", "websocket"]
However, please only do this if you know exactly what you are doing, and why.
Storage Configuration
The Storage object contains settings for the Cronicle storage system. This is built on the pixl-server-storage module, which can write everything to local disk (the default), Couchbase or Amazon S3.
To select a storage engine, place one of the following values into the engine property:
Filesystem
The default storage method is to use local disk (can also be an NFS mount, for multi-server setups with failover support). For this, set the engine property to Filesystem, and declare a sub-object with the same name, with a couple more properties:
{
	"Storage": {
		"engine": "Filesystem",
		"Filesystem": {
			"base_dir": "data",
			"key_namespaces": 1
		}
	}
}
The base_dir is the base directory to store everything under. It can be a fully-qualified filesystem path, or a relative path to the Cronicle base directory (e.g. /opt/cronicle). In this case it will be /opt/cronicle/data.
For more details on using the Filesystem as a backing store, please read the Local Filesystem section in the pixl-server-storage docs.
Couchbase
To use Couchbase as a backing store for Cronicle, please read the Couchbase section in the pixl-server-storage docs. It has complete details for how to setup the storage object. Example configuration:
{
	"Storage": {
		"engine": "Couchbase",
		"Couchbase": {
			"connectString": "couchbase://127.0.0.1",
			"bucket": "default",
			"username": "",
			"password": "",
			"serialize": false,
			"keyPrefix": "cronicle"
		}
	}
}
If you are sharing a bucket with other applications, use the keyPrefix property to keep the Cronicle data separate, in its own "directory". For example, set keyPrefix to "cronicle" to keep all the Cronicle-related records in a top-level "cronicle" directory in the bucket.
Note that for Couchbase Server v5.0+ (Couchbase Node SDK 2.5+), you will have to supply both a username and password for a valid user created in the Couchbase UI. Prior to v5+ you could omit the username and only specify a password, or no password at all if your bucket has no authentication.
You'll also need to install the npm couchbase module:
cd /opt/cronicle
npm install couchbase
After configuring Couchbase, you'll need to run the Cronicle setup script manually, to recreate all the base storage records needed to bootstrap the system:
/opt/cronicle/bin/control.sh setup
Amazon S3
To use Amazon S3 as a backing store for Cronicle, please read the Amazon S3 section in the pixl-server-storage docs. It has complete details for how to setup the storage object. Example configuration:
{
	"Storage": {
		"engine": "S3",
		"AWS": {
			"accessKeyId": "YOUR_AMAZON_ACCESS_KEY",
			"secretAccessKey": "YOUR_AMAZON_SECRET_KEY",
			"region": "us-west-1",
			"correctClockSkew": true,
			"maxRetries": 5,
			"httpOptions": {
				"connectTimeout": 5000,
				"timeout": 5000
			}
		},
		"S3": {
			"keyPrefix": "cronicle",
			"fileExtensions": true,
			"params": {
				"Bucket": "YOUR_S3_BUCKET_ID"
			}
		}
	}
}
If you are sharing a bucket with other applications, use the keyPrefix property to keep the Cronicle data separate, in its own "directory". For example, set keyPrefix to "cronicle" to keep all the Cronicle-related records in a top-level "cronicle" directory in the bucket. A trailing slash will be automatically added to the prefix if missing.
It is recommended that you always set the S3 fileExtensions property to true for new installs. This makes the Cronicle S3 records play nice with sync / copy tools such as Rclone. See Issue #60 for more details. Do not change this property on existing installs -- use the Storage Migration Tool.
To use S3 you'll also need to install the npm aws-sdk module:
cd /opt/cronicle
npm install aws-sdk
After configuring S3, you'll need to run the Cronicle setup script manually, to recreate all the base storage records needed to bootstrap the system:
/opt/cronicle/bin/control.sh setup
If you're worried about Amazon S3 costs, you probably needn't. With a typical setup running ~30 events per hour (about ~25,000 events per month), this translates to approximately 350,000 S3 PUTs plus 250,000 S3 GETs, or about $2 USD per month. Add in 100GB of data storage and it's another $3.
Web Server Configuration
Cronicle has an embedded web server which handles serving up the user interface, as well as some server-to-server communication that takes place between the primary and workers. This is configured in the WebServer object, and there are only a handful of parameters you should ever need to configure:
{
	"WebServer": {
		"http_port": 3012,

		"https": 0,
		"https_port": 3013,
		"https_cert_file": "conf/ssl.crt",
		"https_key_file": "conf/ssl.key"
	}
}
Changing the http_port is probably the most common thing you will want to customize. For example, if you don't have anything else running on port 80, you will probably want to change it to that, so you can access the UI without entering a port number.
This is also where you can enable HTTPS, if you want the UI to be SSL encrypted. Set the https property to 1 to enable, and configure the https_port as you see fit (the standard HTTPS port is 443). You will have to supply your own SSL certificate files (sample self-signed certs are provided for testing, but they will generate browser warnings).
For more details on the web server component, please see the pixl-server-web module documentation.
User Configuration
Cronicle has a simple user login and management system, which is built on the pixl-server-user module. It handles creating new users, assigning permissions, and login / session management. It is configured in the User object, and there are only a couple of parameters you should ever need to configure:
{
	"User": {
		"free_accounts": 0,

		"default_privileges": {
			"admin": 0,
			"create_events": 1,
			"edit_events": 1,
			"delete_events": 1,
			"run_events": 0,
			"abort_events": 0,
			"state_update": 0
		}
	}
}
The free_accounts property specifies whether guests visiting the UI can create their own accounts, or not. This defaults to 0 (disabled), but you can set it to 1 to enable. This feature should only be used when your install of Cronicle is running on a private network, and you trust all your employees.
The default_privileges object specifies which privileges new accounts will receive by default. Here is a list of all the possible privileges and what they mean:
| Privilege ID | Description |
|---|---|
admin |
User is a full administrator. This automatically grants ALL privileges, current and future. |
create_events |
User is allowed to create new events and add them to the schedule. |
edit_events |
User is allowed to edit and save events -- even those created by others. |
delete_events |
User is allowed to delete events -- event those created by others. |
run_events |
User is allowed to run events on-demand by clicking the "Run" button in the UI. |
abort_events |
User is allowed to abort jobs in progress, even those for events created by others. |
state_update |
User is allowed to enable or disable the primary scheduler. |
By default new users have the create_events, edit_events and delete_events privileges, and nothing else. Note that when an administrator creates new accounts via the UI, (s)he can customize the privileges at that point. The configuration only sets the defaults.
For more details on the user manager component, please see the pixl-server-user module documentation.
Email Configuration
Cronicle will send a number of different types of e-mails in response to certain events. These are mostly confirmations of actions, or just simple notifications. Most of these can be disabled in the UI if desired. The e-mail content is also configurable, including the From and Subject headers, and is based on plain text e-mail template files located on disk:
| Action | Email Template | Description |
|---|---|---|
| New User Account | conf/emails/welcome_new_user.txt |
Sent when a new user account is created. |
| Changed Password | conf/emails/changed_password.txt |
Sent when a user changes their password. |
| Recover Password | conf/emails/recover_password.txt |
Sent when a user requests password recovery. |
| Job Succeeded | conf/emails/job_success.txt |
Conditionally sent when a job completes successfully (depends on event configuration). |
| Job Failed | conf/emails/job_fail.txt |
Conditionally sent when a job fails (depends on event configuration). |
| Event Error | conf/emails/event_error.txt |
Sent when a job fails to launch (depends on event configuration). |
Feel free to edit these files to your liking. Note that any text in [/square_brackets] is a placeholder which gets swapped out with live data relevant to the event which fired off the e-mail.
Here is an example e-mail template file:
To: [/notify_success]
From: [/config/email_from]
Subject: Cronicle Job Completed Successfully: [/event_title]

Date/Time: [/nice_date_time]
Event Title: [/event_title]
Category: [/category_title]
Server Target: [/nice_target]
Plugin: [/plugin_title]

Job ID: [/id]
Hostname: [/hostname]
PID: [/pid]
Elapsed Time: [/nice_elapsed]
Performance Metrics: [/perf]
Avg. Memory Usage: [/nice_mem]
Avg. CPU Usage: [/nice_cpu]

Job Details:
[/job_details_url]

Job Debug Log ([/nice_log_size]):
[/job_log_url]

Edit Event:
[/edit_event_url]

Description:
[/description]

Event Notes:
[/notes]

Regards,
The Cronicle Team
The stock e-mail templates shipped with Cronicle are plain text, but you can provide your own rich HTML e-mail templates if you want. Simply start the e-mail body content (what comes after the Subject line) with an HTML open tag, e.g. <div>, and the e-mails will be sent as HTML instead of text.
You can include any property from the main conf/config.json file by using the syntax [/config/KEY]. Also, to include environment variables, use the syntax [/env/ENV_KEY], for example [/env/NODE_ENV].
Web UI
This section describes the Cronicle web user interface. It has been tested extensively in Safari, Chrome and Firefox. Recent versions of IE should also work (11 and Edge).
Home Tab
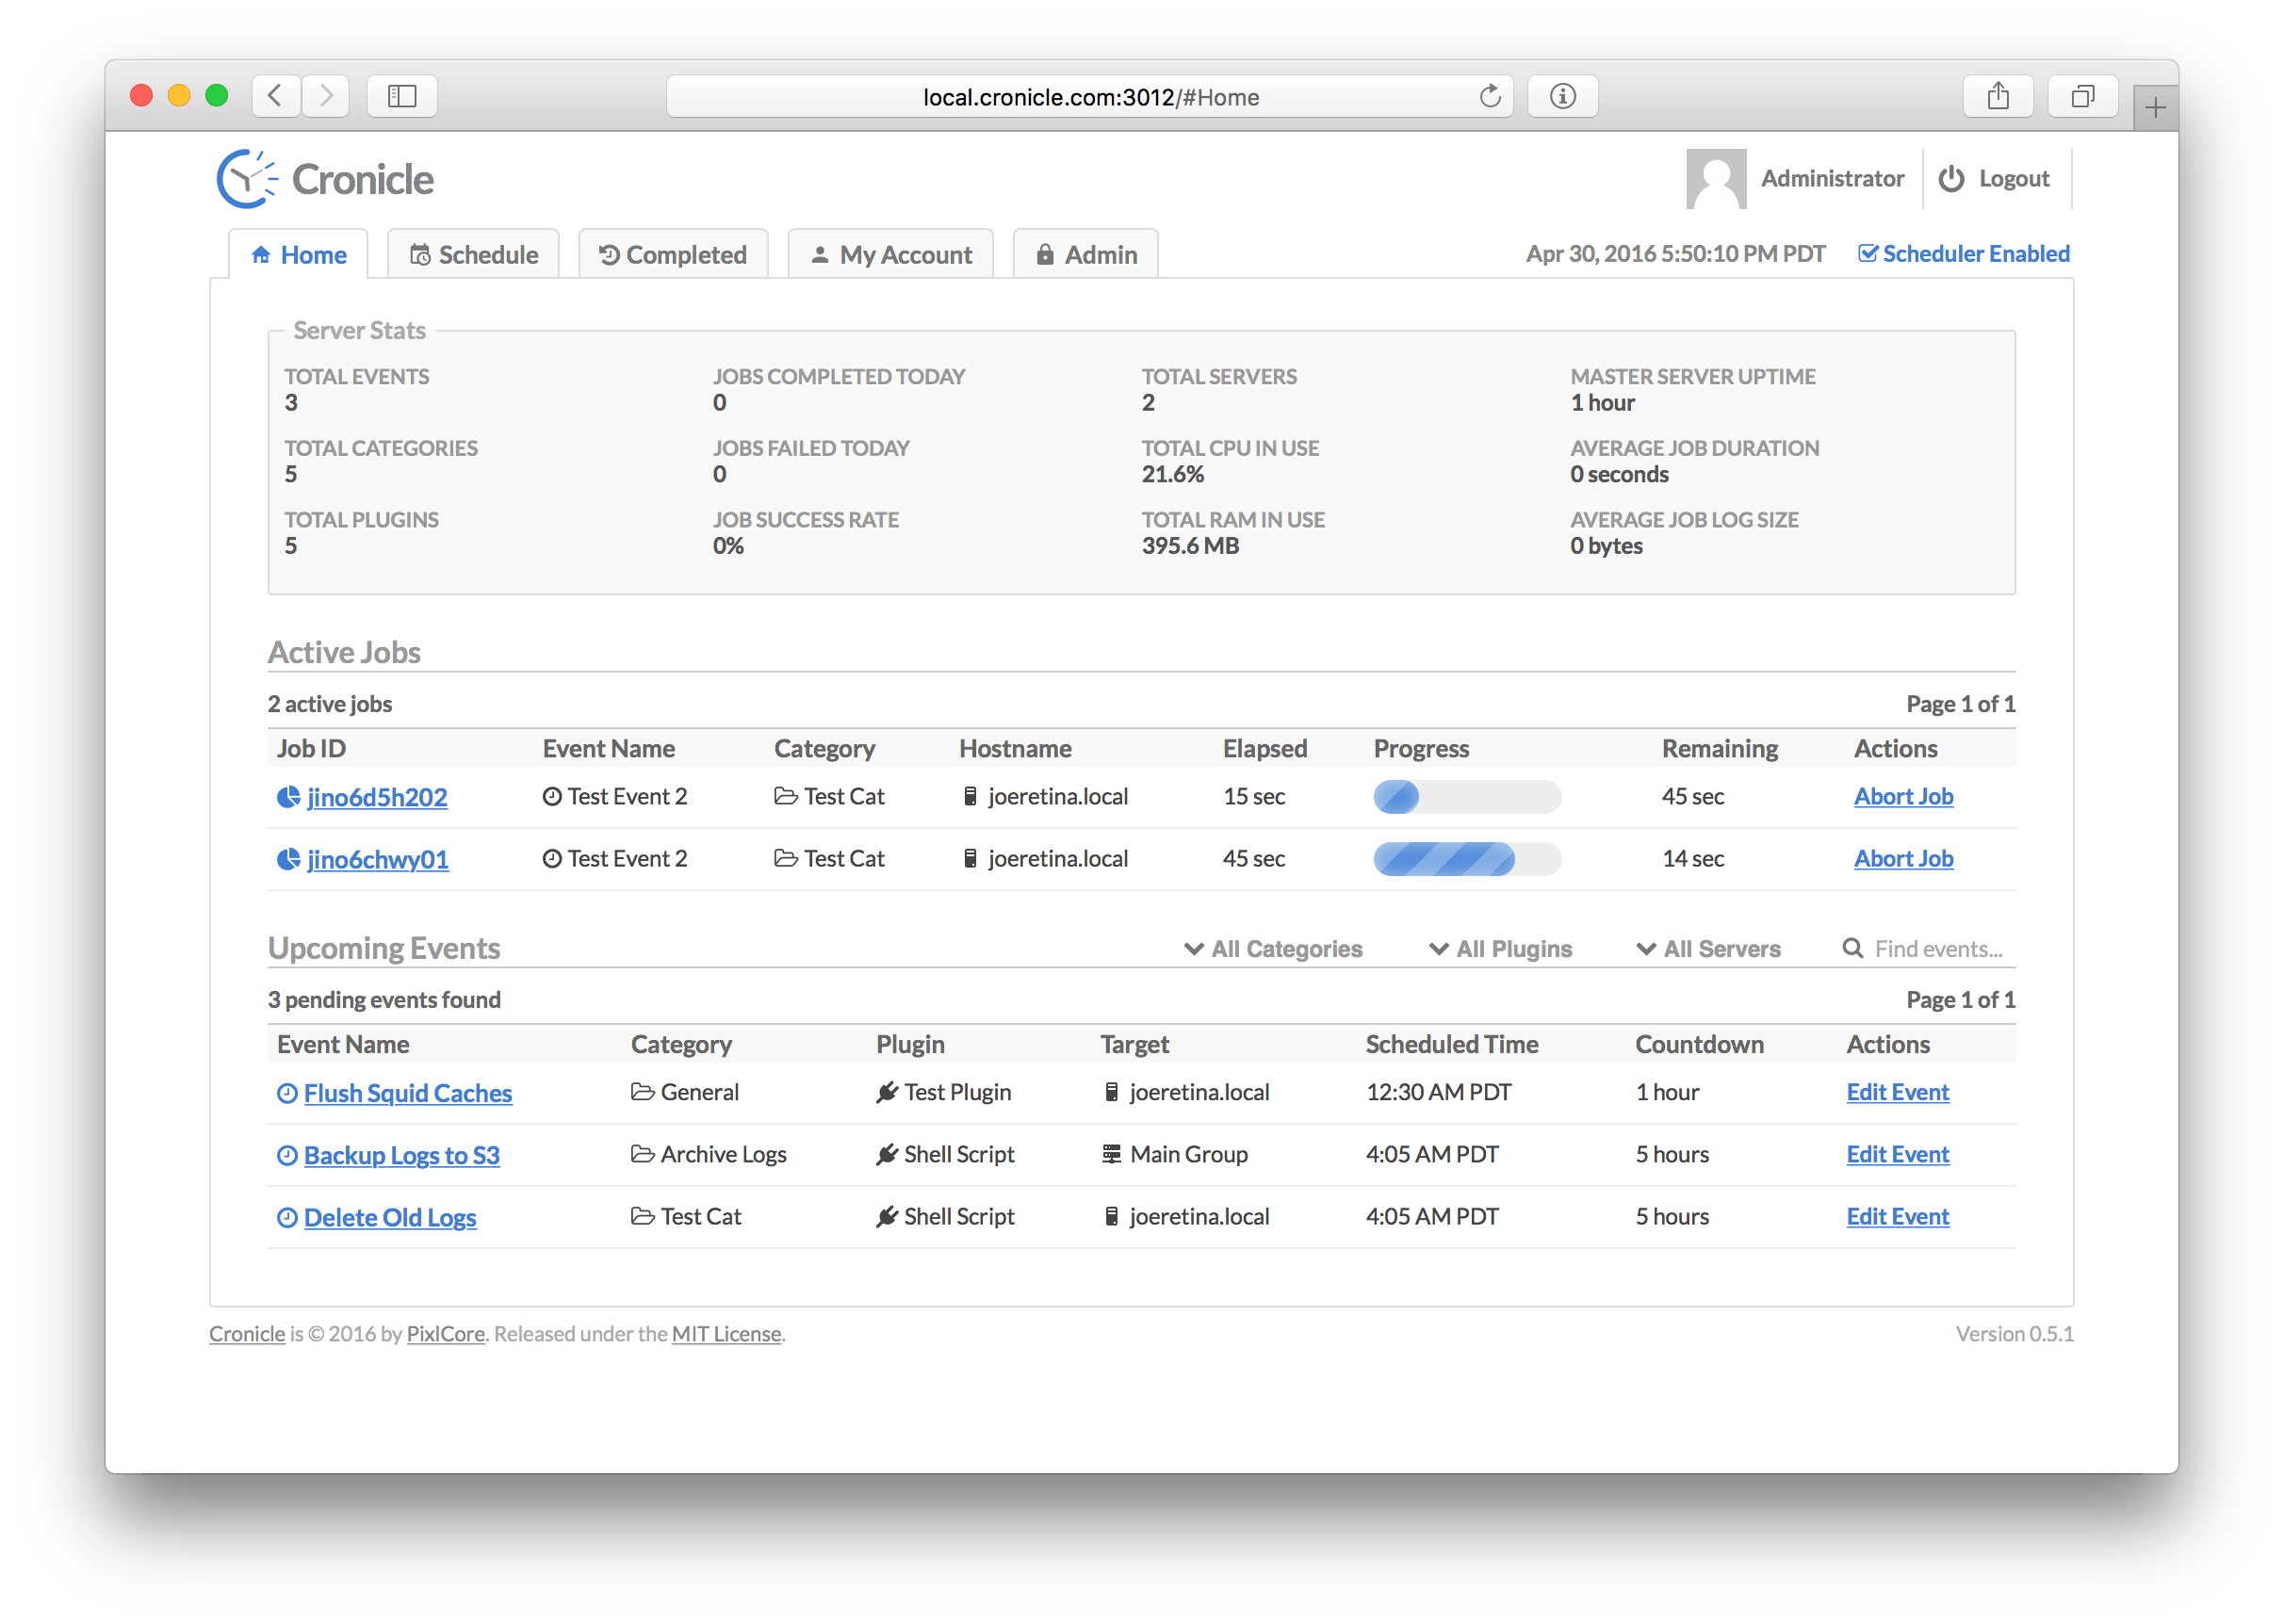
The Home tab, also known as the dashboard, is the default page shown after you log in. It displays basic information about the application, currently active (running) jobs, and a list of upcoming jobs in the next 24 hours. The page is split vertically into three main sections:
General Stats
This section contains a summary of various Cronicle stats. Some are current totals, and others are daily totals. Here is a list of everything that is displayed:
| Statistic | Description |
|---|---|
| Total Events | Current number of active events in the schedule. |
| Total Categories | Current number of event categories in the system. |
| Total Plugins | Current number of registered Plugins in the system. |
| Jobs Completed Today | Number of jobs completed today (resets at midnight, local server time). |
| Jobs Failed Today | Number of jobs that failed today (resets at midnight, local server time). |
| Job Success Rate | Percentage of completed jobs that succeeded today (resets at midnight, local server time). |
| Total Servers | Current total number of servers in the Cronicle cluster. |
| Total CPU in Use | Current total CPU in use (all servers, all jobs, all processes). |
| Total RAM in Use | Current total RAM in use (all servers, all jobs, all processes). |
| Primary Server Uptime | Elapsed time since Cronicle on the primary server was restarted. |
| Average Job Duration | The average elapsed time for all completed jobs today (resets at midnight, local server time). |
| Average Job Log Size | The average job log file size for all completed jobs today (resets at midnight, local server time). |
Active Jobs
This table lists all the currently active (running) jobs, and various information about them. The table columns are:
| Column | Description |
|---|---|
| Job ID | A unique ID assigned to the job. Click this to see live job progress (see Job Details Tab below). |
| Event Name | The name of the scheduled event which started the job. |
| Category | The category to which the event is assigned. |
| Hostname | The server hostname which is running the job. |
| Elapsed | The current elapsed time since the job started. |
| Progress | A visual representation of the job's progress, if available. |
| Remaining | The estimated remaining time, if available. |
| Actions | Click Abort to cancel the job. |
Upcoming Events
This table lists all the upcoming scheduled events in the next 24 hours, and various information about them. The table columns are:
| Column | Description |
|---|---|
| Event Name | The name of the scheduled event. Click this to edit the event (see Edit Event Tab below). |
| Category | The category to which the event is assigned. |
| Plugin | The Plugin which will be loaded to run the event. |
| Target | The server target (server group or individual server hostname) which will run the event. |
| Scheduled Time | When the event is scheduled to run (in your local timezone unless otherwise specified). |
| Countdown | How much time remains until the event runs. |
| Actions | Click Edit Event to edit the event (see Edit Event Tab below). |
Schedule Tab
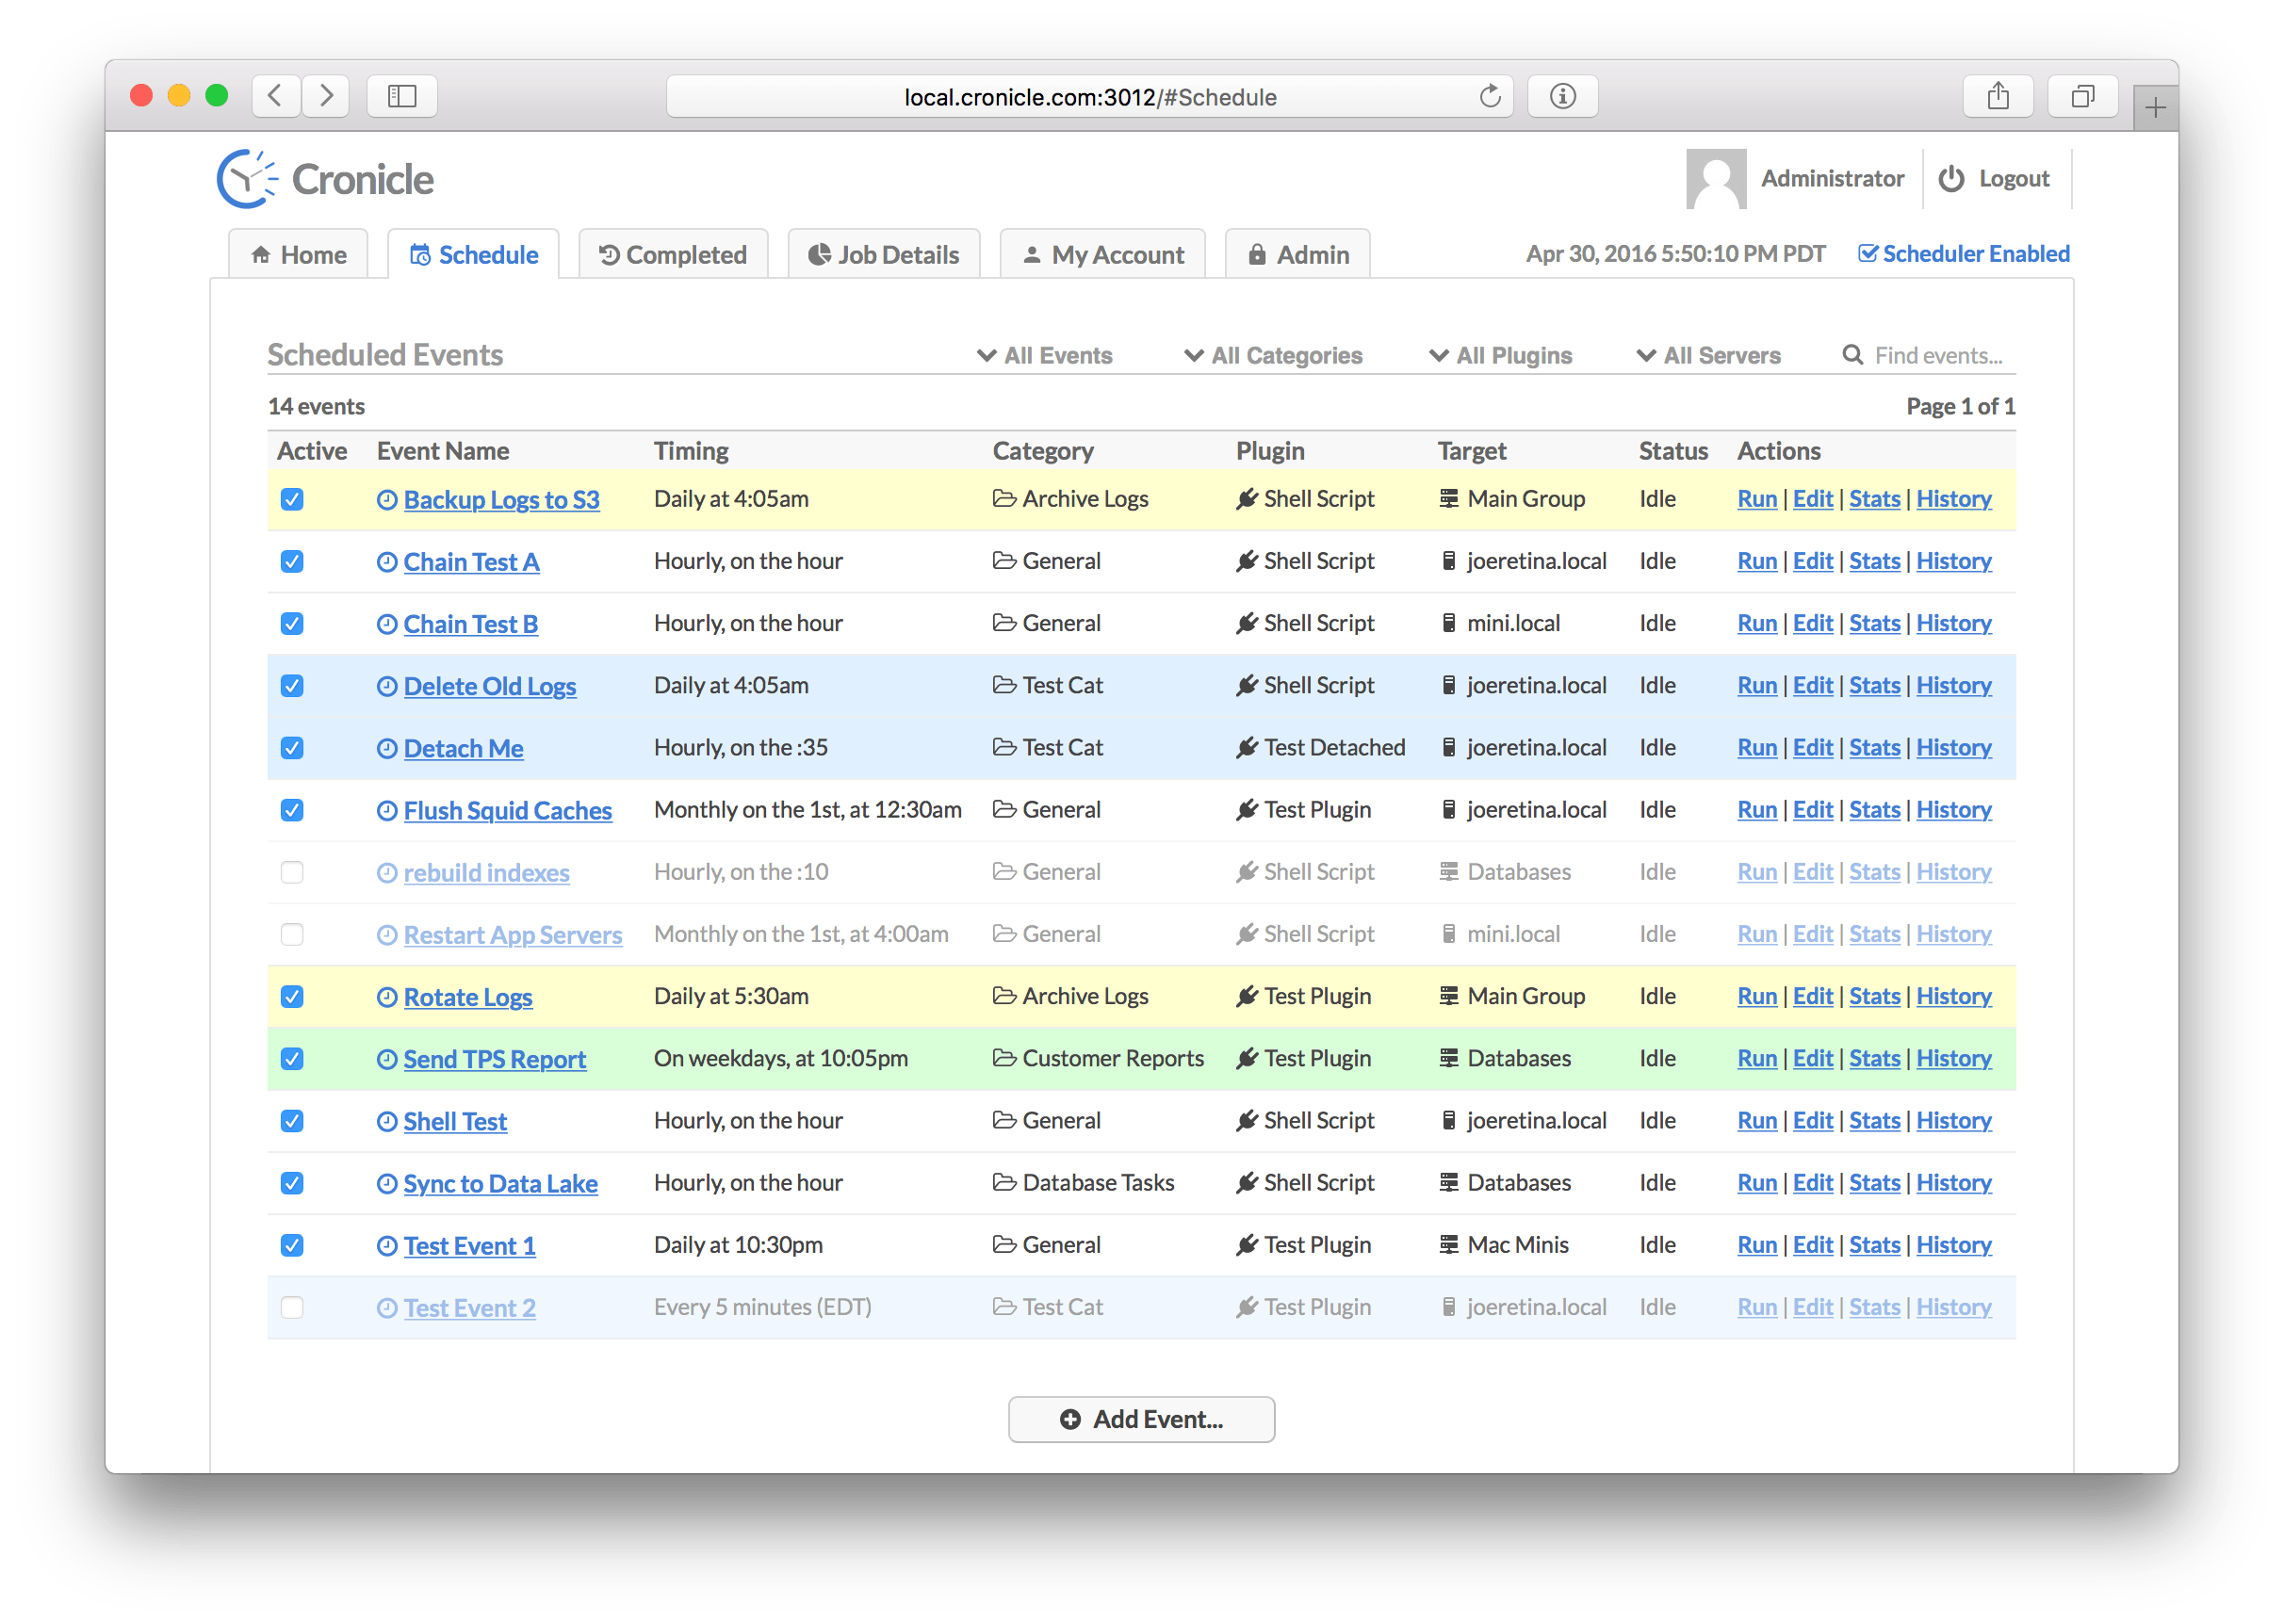
This tab displays the list of all events currently in the schedule, including both active and disabled events. From here you can add new events, edit existing events, run events on-demand, and jump to locations such as Event History and Event Stats. The schedule table has the following columns:
| Column | Description |
|---|---|
| Active | This checkbox indicates whether the event is active or disabled. Click it to toggle the state. |
| Event Name | The name of the scheduled event. Click this to edit the event (see Edit Event Tab below). |
| Timing | A summary of the event's timing settings (daily, hourly, etc.). |
| Category | The category to which the event is assigned. |
| Plugin | The Plugin which will be loaded to run the event. |
| Target | The server target (server group or individual server hostname) which will run the event. |
| Status | Current status of the event (idle or number of running jobs). |
| Actions | A list of actions to run on the event. See below. |
Here are the actions you can run on each event from the Schedule tab:
| Action | Description |
|---|---|
| Run | Immediately runs the event (starts an on-demand job), regardless of the event's timing settings. |
| Edit | This jumps over to the Edit Event Tab to edit the event. |
| Stats | This jumps over to the Event Stats Tab to see statistics about the event and past jobs. |
| History | This jumps over to the Event History Tab to see the event's history of completed jobs. |
Edit Event Tab
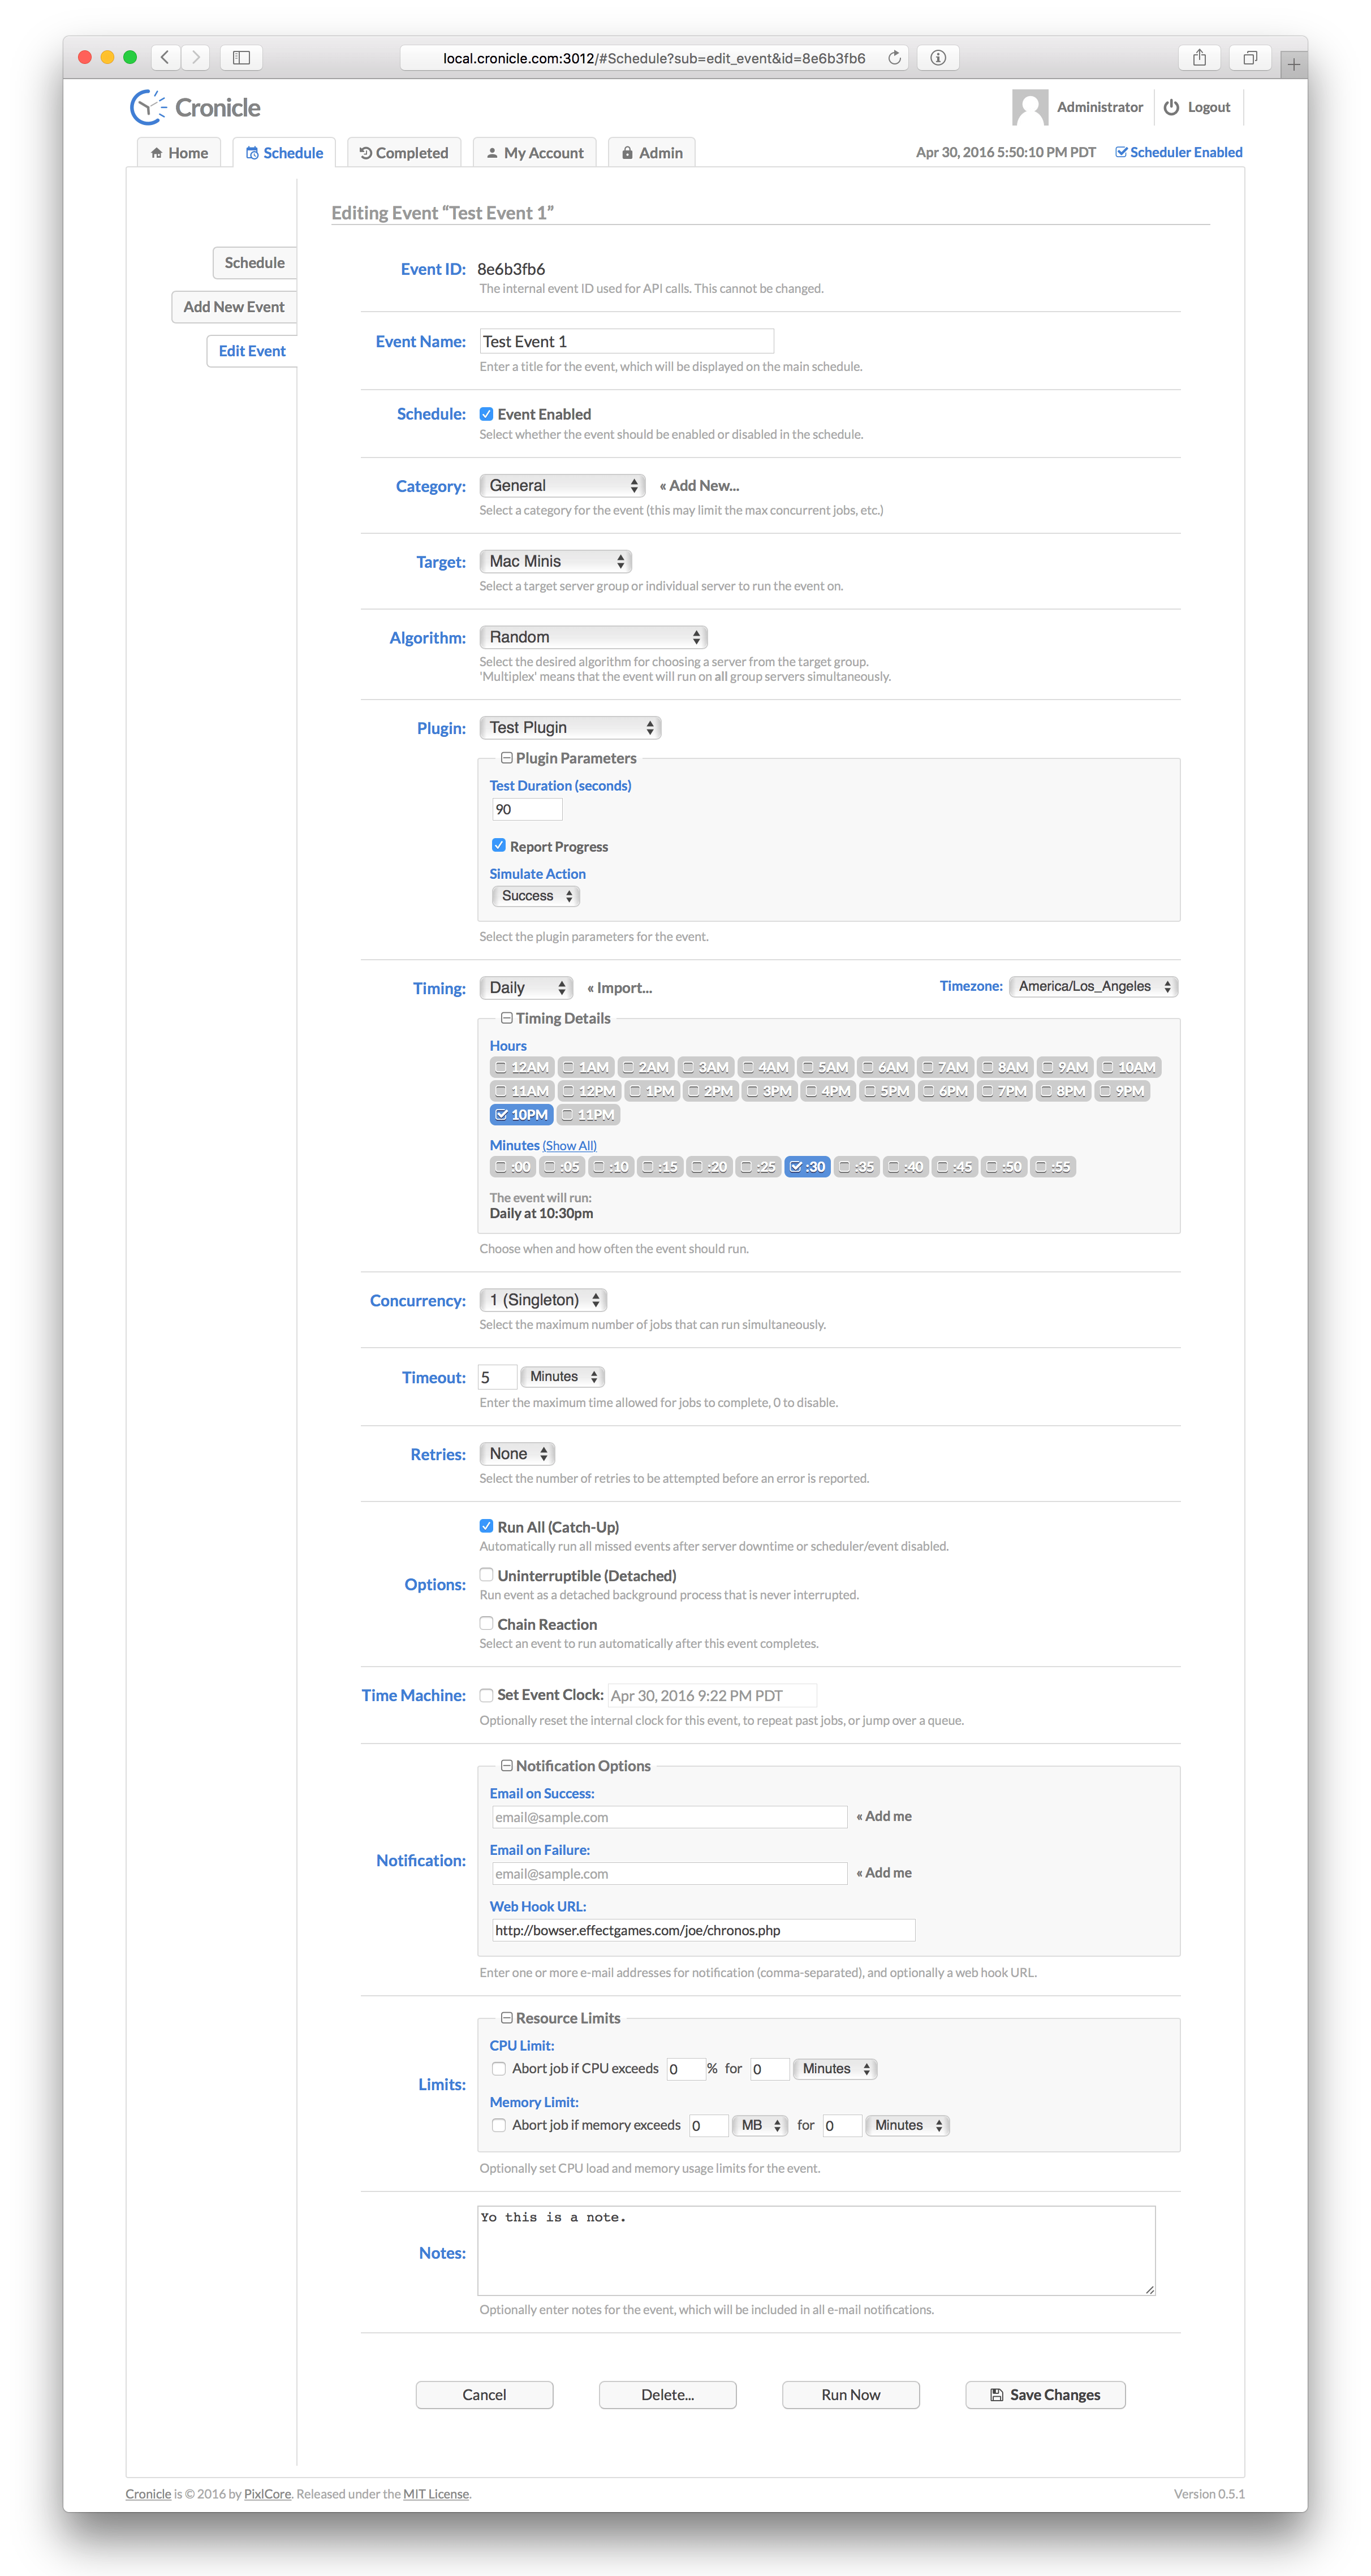
The Edit Event Tab displays a form for editing scheduled events, and creating new ones. Here are all the form fields and what they mean:
Event ID
Each event has a unique ID which is used when making API calls, and can be ignored otherwise. This is only displayed when editing events.
Event Name
Each event has a name, which can be anything you like. It is displayed on the Schedule tab, and in reports, e-mails, etc.
Event Enabled
This checkbox specifies whether the event is enabled (active) in the scheduler, and will fire off jobs according to the Event Timing, or disabled. If disabled, you can still run on-demand jobs by clicking the "Run Now" button.
Event Category
All events are assigned to a particular category. If you don't want to create categories, just assign your events to the provided "General" category. Categories can define limits such as max concurrent jobs, max RAM per job and max CPU per job. See the Categories Tab below for more details on creating categories.
Event Target
In a multi-server cluster, events can be targeted to run on individual servers, or server groups. Both are listed in the drop-down menu. If a server group is targeted, one of the group's servers is chosen each time the event runs a job. You can decide which algorithm to use for picking servers from the group (see below). Also, see the Servers Tab for more details on creating server groups.
Algorithm
When you target a server group for your event, a supplementary menu appears to select an "algorithm". This is simply the method by which Cronicle picks a server in the group to run your job. The default is "Random" (i.e. select a random server from the group for each job), but there are several others as well:
| Algorithm ID | Algorithm Name | Description |
|---|---|---|
random |
Random | Pick a random server from the group. |
round_robin |
Round Robin | Pick each server in sequence (alphabetically sorted). |
least_cpu |
Least CPU Usage | Pick the server with the least amount of CPU usage in the group. |
least_mem |
Least Memory Usage | Pick the server with the least amount of memory usage in the group. |
prefer_first |
Prefer First | Prefer the first server in the group (alphabetically sorted), only picking alternatives if the first server is unavailable. |
prefer_last |
Prefer Last | Prefer the last server in the group (alphabetically sorted), only picking alternatives if the last server is unavailable. |
multiplex |
Multiplex | Run the event on all servers in the group simultaneously (see below). |
Multiplexing
If the event targets a server group, you have the option of "multiplexing" it. That is, the event will run jobs on all the servers in the group at once, rather than picking one server at random.
When this feature is enabled, an optional "Stagger" text field will appear. This allows you to stagger (progressively delay) the launch of jobs across the servers, so they don't all start at the same exact time.
Event Plugin
Whenever Cronicle runs an event, a "Plugin" is loaded to handle the job. This is basically a shell command which runs as its own process, reads JSON from STDIN to receive metadata about the job, and writes JSON to STDOUT to report progress and completion. Plugins can be written in virtually any language. See the Plugins section below for more details.
If the Plugin defines any custom parameters, they are editable per event. This feature allows the Plugin to define a set of UI elements (text fields, checkboxes, drop-down menus, etc.) which the event editor can provide values for. Then, when jobs are started, the Plugin is provided a JSON document containing all the custom keys and values set by the UI for the event.
Event Timing
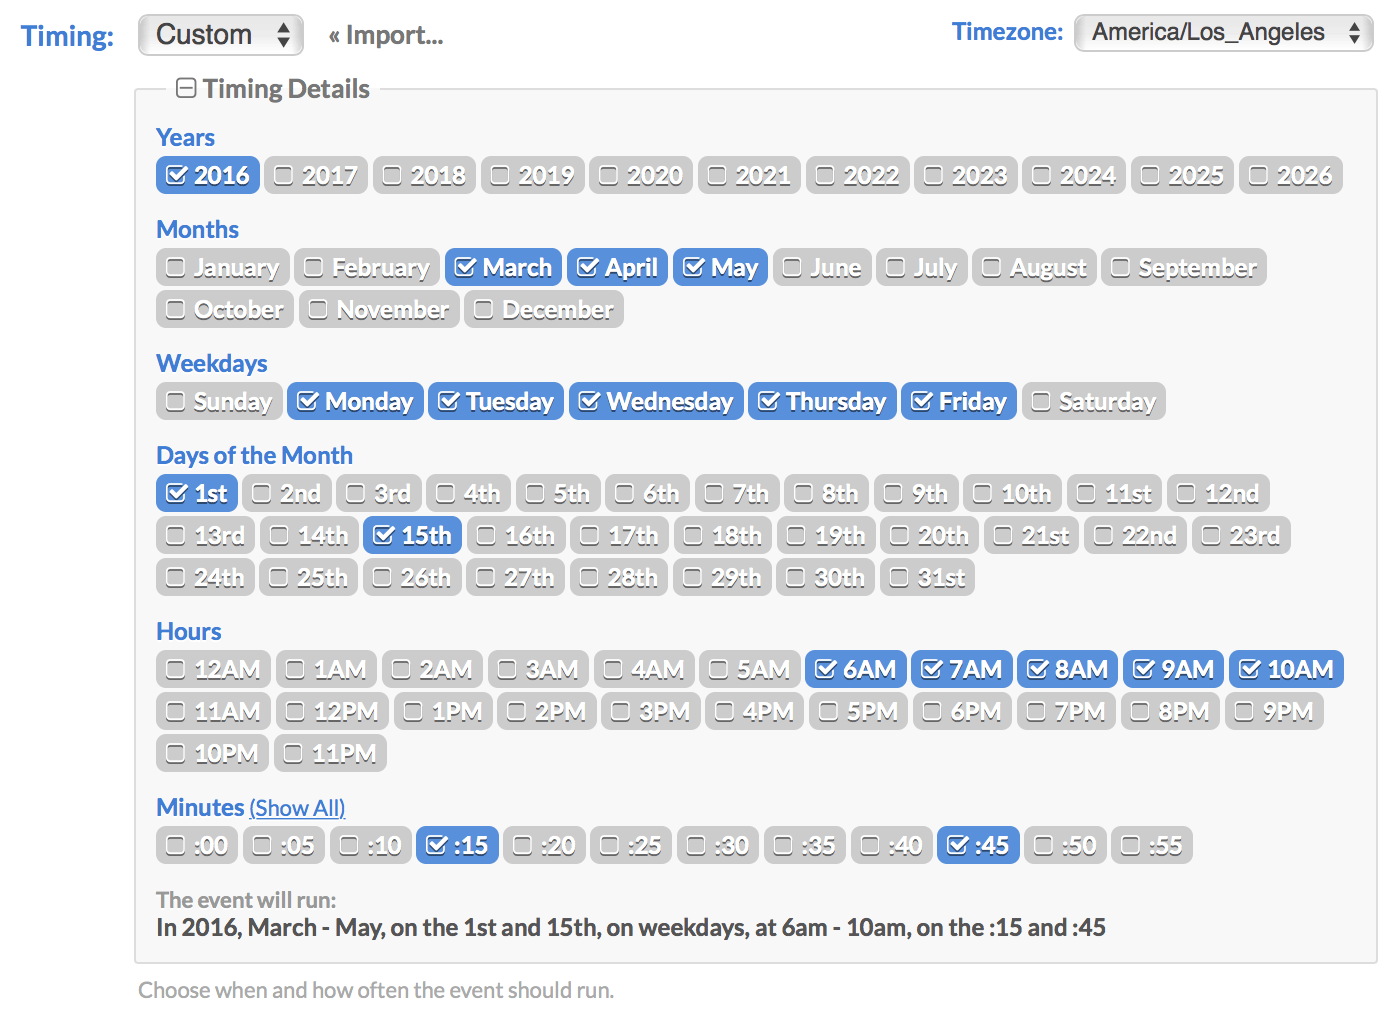
Events are scheduled to run at various dates and times using a visual multi-selector widget, as shown above. This allows you to multi-select any combination of years, months, days, weekdays, hours and/or minutes, for an event to run on. It will also repeat on a recurring basis, each time the server clock matches your selections. This is very similar to the Unix Cron format, but with a more visual user interface.
If you leave all the boxes unchecked in a particular time scale, it means the same as "all" (similar to the Cron asterisk * operator). So if you leave everything blank in all the categories and select only the ":00" minute, it means: every year, every month, every day, every weekday, and every hour on the ":00" minute. Or in other words, hourly.
If you click the "Import..." link, you can import date/time settings from a Crontab, i.e. the famous * * * * * syntax. This saves you the hassle of having to translate your existing Crontabs over to the Cronicle UI by hand.
By default, events are scheduled in your current local timezone, but you can customize this using the menu at the top-right. The menu is pre-populated with all the IANA standard timezones. Also, the timezone selection is saved with each event, so Cronicle always knows exactly when the they should all run, regardless of the server timezone.
The Cronicle scheduling system is versatile, but it can't do everything. For example, you cannot schedule an event to run at two different times on two different days, such as 2:30 PM on Monday and 8:30 AM on Tuesday. For that, you'd have to create separate events.
Event Concurrency
The Event Concurrency selector allows you to specify how many simultaneous jobs are allowed to run for the event. For example, multiple jobs may need to run if your event is scheduled to run hourly, but it takes longer than a hour to complete a job. Or, a job may be already running and someone clicks the "Run Now" link on the Schedule tab. This selector specifies the maximum allowed jobs to run concurrently for each event.
If an event cannot start a job due to the concurrency limit, an error is logged (see the Activity Log Tab below). What happens next depends on the Event Options. If the event has Run All (Catch-Up) mode enabled, then the scheduler will keep trying to run every scheduled job indefinitely. Otherwise, it will simply wait until the next scheduled run.
Event Timeout
You can optionally specify an event timeout, which is a maximum run time for event jobs. If a job takes longer than the specified timeout period, it is aborted, and logged as a failed job. To disable the timeout and allow jobs to run indefinitely, set this field to 0.
Event Retries
If a job throws an internal error (meaning, it returns a non-zero code in the JSON response, or a shell command exits with a non-zero exit code), you can have Cronicle automatically retry it up to 32 times. Aborting a job (either manually or by a timeout) does not trigger a retry.
If the retries is set to a non-zero amount, a "Retry Delay" text field will appear. This allows you to have Cronicle wait a certain amount of time between retries, if you want. The idea is to reduce bashing on services that may be overloaded.
Note that the Event Timeout applies to the total run time of the job, which includes all retries. For example, if you set the timeout to 10 minutes, and the job takes 9 minutes and fails, any retries will then only have 1 minute to complete the job. So please set the timeout accordingly.
Event Options
This section allows you to select options on how jobs are handled for the event:
Run All Mode
When Run All (Catch-Up) Mode mode is enabled on an event, the scheduler will do its best to ensure that every scheduled job will run, even if they have to run late. This is useful for time-sensitive events such as generating reports. So for example, if you have an event scheduled to run hourly, but something prevents it from starting or completing (see below), the scheduler will keep trying indefinitely until each separate hourly job runs. If the event cannot run for multiple hours, the jobs will simply queue up, and the scheduler will run them all in order, as quickly as its rules allow.
If any of the following situations occur, and the event has Run All (Catch-Up) mode enabled, the scheduler will queue up and re-run all missed jobs:
- Job could not run due to concurrency limits.
- Job could not run due to the target server being unavailable.
- Job could not run due to the event category or Plugin being disabled.
- Server running the job was shut down.
- Server running the job crashed.
- Job was aborted due to exceeding a timeout limit.
- Job was aborted due to exceeding a resource limit (RAM or CPU).
The only time a Catch-Up job is not re-run is when one of the following actions occur:
- Job is manually aborted via the Web UI or API.
- Job fails due to error thrown from inside the Plugin (user code generated error).
You can see all queued jobs on the Home Tab. They will be listed in the Upcoming Events table, and have their "Countdown" column set to "Now". To jump over the queue and reset an event that has fallen behind, use the Event Time Machine feature.
When Run All (Catch-Up) mode is disabled, and a job cannot run or fails due to any of the reasons listed above, the scheduler simply logs an error, and resumes normal operations. The event will not run until the next scheduled time, if any. This is more suitable for events that are not time-sensitive, such as log rotation.
Detached Mode
When Uninterruptible (Detached) mode is enabled on an event, jobs are spawned as standalone background processes, which are not interrupted for things like the Cronicle daemon restarting. This is designed mainly for critical operations that cannot be stopped in the middle for whatever reason.
Please use this mode with caution, and only when truly needed, as there are downsides. First of all, since the process runs detached and standalone, there are no real-time updates. Meaning, the progress bar and time remaining displays are delayed by up to a minute. Also, when your job completes, there is a delay of up to a minute before Cronicle realizes and marks the job as complete.
It is much better to design your jobs to be interrupted, if at all possible. Note that Cronicle will re-run interrupted jobs if they have Run All Mode set. So Detached Mode should only be needed in very special circumstances.
Allow Queued Jobs
By default, when jobs cannot run due to concurrency settings, or other issues like an unavailable target server, an error is generated. That is, unless you enable the event queue. With queuing enabled, jobs that can't run immediately are queued up, and executed on a first come, first serve basis, as quickly as conditions allow.
When the queue is enabled on an event, a new "Queue Limit" section will appear in the form, allowing you to set the maximum queue length per event. If this limit is reached, no additional jobs can be queued, and an error will be generated.
You can track the progress of your event queues on the Home Tab. Queued events and counts appear in a table between the Active Jobs and Upcoming Events sections. From there you can also "flush" an event queue (i.e. delete all queued jobs), in case one grows out of control.
Chain Reaction
Chain Reaction mode allows you to select an event which will be launched automatically each time the current event completes a job. You are essentially "chaining" two events together, so one always runs at the completion of the other. This chain can be any number of events long, and the events can all run on different servers.
You can optionally select different events to run if the current job succeeds or fails. For example, you may have a special error handling / notification event, which needs to run upon specific event failures.
You can have more control over this process by using the JSON API in your Plugins. See Chain Reaction Control below for details.
Event Time Machine
When editing an existing event that has Run All (Catch-Up) mode enabled, the Event Time Machine will appear. This is a way to reset the internal "clock" for an event, allowing you to re-run past jobs, or skip over a queue of stuck jobs.
For each event in the schedule, Cronicle keeps an internal clock called a "cursor". If you imagine time running along a straight line, the event cursors are points along that line. When the primary server ticks a new minute, it shifts all the event cursors forward up to the current minute, running any scheduled events along the way.
So for example, if you needed to re-run a daily 4 AM report event, you can just edit the cursor clock and set it back to 3:59 AM. The cursor will catch up to the current time as quickly as it can, stopping only to run any scheduled events along the way. You can also use this feature to "jump" over a queue, if jobs have stacked up for an event. Just set the cursor clock to the current time, and the scheduler will resume jobs from that point onward.
The event clock for the Time Machine is displayed and interpreted in the event's currently selected timezone.
Event Notification
Cronicle can optionally send out an e-mail notification to a custom list of recipients for each job's completion (for multiple, separate addresses by commas). You can also specify different e-mail addresses for when job succeeds, vs. when it fails. The e-mails will contain a plethora of information about the event, the job, and the error if applicable. Example email contents:
To: [email protected]
From: [email protected]
Subject: Cronicle Job Failed: Rebuild Indexes

Date/Time: 2015/10/24 19:47:50 (GMT-7)
Event Title: Rebuild Indexes
Category: Database
Server Target: db01.prod
Plugin: DB Indexer

Job ID: jig5wyx9801
Hostname: db01.prod
PID: 4796
Elapsed Time: 1 minute, 31 seconds
Performance Metrics: scale=1&total=30.333&db_query=1.699&db_connect=1.941&log_read=2.931&gzip_data=3.773
Memory Usage: 274.5 MB Avg, 275.1 MB Peak
CPU Usage: 31.85% Avg, 36.7% Peak
Error Code: 999

Error Description:
Failed to write to file: /backup/db/schema.sql: Out of disk space

Job Details:
http://local.syncronic.com:3012/#JobDetails?id=jig5wyx9801

Job Debug Log (18.2 K):
http://local.syncronic.com:3012/api/app/get_job_log?id=jig5wyx9801

Edit Event:
http://local.syncronic.com:3012/#Schedule?sub=edit_event&id=3c182051

Event Notes:
This event handles reindexing our primary databases nightly.
Contact Daniel in Ops for details.

Regards,
The Cronicle Team
You have control over much of the content of these e-mails. The Error Code and Description are entirely generated by your own Plugins, and can be as custom and verbose as you want. The Performance Metrics are also generated by your Plugins (if applicable), and the Event Notes are taken straight from the UI for the event (see Event Notes below). Finally, the entire e-mail template can be customized to including additional information or to fit your company's brand. HTML formatted e-mails are supported as well.
See the Email Configuration section for more details on customization.
Event Web Hook
Another optional notification method for events is a "web hook". This means Cronicle will send an HTTP POST to a custom URL that you specify, both at the start and the end of each job, and include full details in JSON format. Your own API endpoint will receive the JSON POST from Cronicle, and then your code can fire off its own custom notification.
You can determine if the request represents a start or the end of a job by looking at the action property. It will be set to job_start or job_complete respectively. Here is a list of all the JSON properties that will be included in the web hook, and what they mean:
| JSON Property | Description |
|---|---|
action |
Specifies whether the web hook signifies the start (job_start) or end (job_complete) of a job. |
base_app_url |
The base_app_url configuration property. |
category |
The Category ID to which the event is assigned. |
category_title |
The title of the Category to which the event is assigned. |
code |
The response code as specified by your Plugin (only applicable for job_complete hooks). |
cpu |
An object representing the min, max, average and latest CPU usage for the job (only applicable for job_complete hooks). |
description |
A custom text string populated by your Plugin, typically contains the error message on failure. |
edit_event_url |
A fully-qualified URL to edit the event in the Cronicle UI. |
elapsed |
The total elapsed time for the job, in seconds (only applicable for job_complete hooks). |
event |
The ID of the event which spawned the job. |
event_title |
The title of the event which spawned the job. |
hostname |
The hostname of the server which ran (or is about to run) the event. |
id |
An auto-assigned unique ID for the job, which can be used in API calls to query for status. |
job_details_url |
A fully-qualified URL to view the job details in the Cronicle UI. |
log_file_size |
The size of the job's log file in bytes (only applicable for job_complete hooks). |
mem |
An object representing the min, max, average and latest memory usage for the job (only applicable for job_complete hooks). |
nice_target |
Will be set to the title of the target server group, or exact server hostname, depending on how the event is configured. |
params |
An object containing all the UI selections for the Plugin custom parameters, from the event. |
perf |
An object or string containing performance metrics, as reported by your Plugin (only applicable for job_complete hooks). |
pid |
The Process ID (PID) of the main job process which ran your Plugin code (only applicable for job_complete hooks). |
plugin |
The ID of the Plugin assigned to the event. |
plugin_title |
The title of the Plugin assigned to the event. |
source |
A string describing who or what started the job (user or API). Will be blank if launched normally by the scheduler. |
text |
A simple text string describing the action that took place. Useful for Slack Webhook Integrations. |
time_end |
The Epoch timestamp of when the job ended (only applicable for job_complete hooks). |
time_start |
The Epoch timestamp of when the job started. |
Here is an example web hook JSON record (job_complete version shown):
{
	"action": "job_complete",
	"base_app_url": "http://localhost:3012",
	"category": "general",
	"category_title": "General",
	"code": 0,
	"cpu": {
		"min": 23.4,
		"max": 23.4,
		"total": 23.4,
		"count": 1,
		"current": 23.4
	},
	"description": "Success!",
	"edit_event_url": "http://localhost:3012/#Schedule?sub=edit_event&id=3c182051",
	"elapsed": 90.414,
	"event": "3c182051",
	"event_title": "Test Event 2",
	"hostname": "joeretina.local",
	"id": "jihuyalli01",
	"job_details_url": "http://localhost:3012/#JobDetails?id=jihuyalli01",
	"log_file_size": 25119,
	"mem": {
		"min": 190459904,
		"max": 190459904,
		"total": 190459904,
		"count": 1,
		"current": 190459904
	},
	"nice_target": "joeretina.local",
	"params": {
		"db_host": "idb01.mycompany.com",
		"verbose": 1,
		"cust": "Marketing"
	},
	"perf": "scale=1&total=90.103&db_query=0.237&db_connect=6.888&log_read=9.781&gzip_data=12.305&http_post=14.867",
	"pid": 72589,
	"plugin": "test",
	"plugin_title": "Test Plugin",
	"source": "Manual (admin)",
	"text": "Job completed successfully on joeretina.local: Test Event 2 http://localhost:3012/#JobDetails?id=jihuyalli01",
	"time_end": 1449431930.628,
	"time_start": 1449431840.214
}
In addition to job_start and job_complete, there is one other special hook action that may be sent, and that is job_launch_failure. This happens if a scheduled event completely fails to start a job, due to an unrecoverable error (such as an unavailable target server or group). In this case the code property will be non-zero, and the description property will contain a summary of the error.
Only a small subset of the properties shown above will be included with a job_launch_failure, as a job object was never successfully created, so there will be no hostname, pid, elapsed, log_file_size, etc.
To include custom HTTP request headers with your web hook, append them onto the end of the URL using this format: [header: My-Header: My-Value]. Make sure to include a space before the opening bracket. Example URL:
https://myserver.com/api/chat.postMessage [header: My-Header: My-Value]
Event Resource Limits
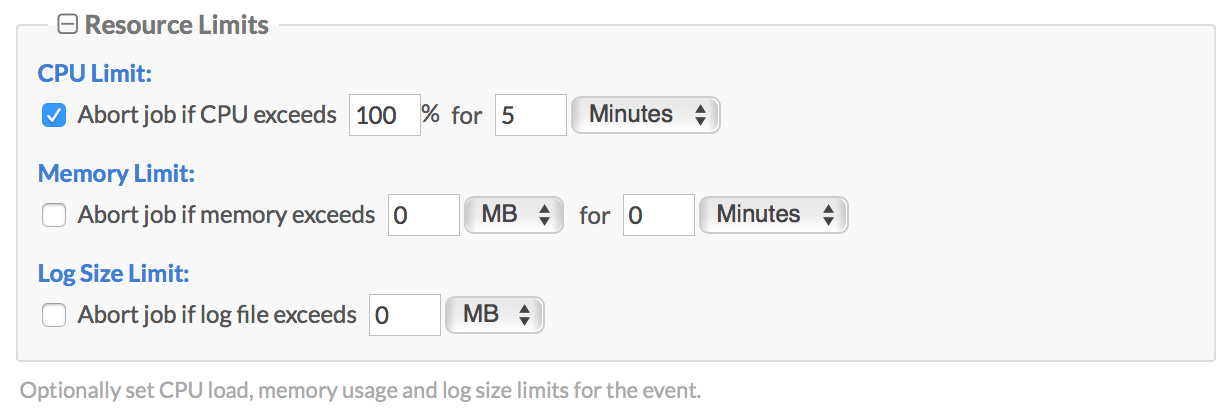
Cronicle can automatically limit the server resource consumption of your jobs, by monitoring their CPU, memory and/or log file size, and aborting them if your limits are exceeded. You can also specify "sustain" times for CPU and memory, so no action is taken until the limits are exceeded for a certain amount of time.
CPU and RAM usage are measured every 10 seconds, by looking at the process spawned for the job, and any child processes that may have also been spawned by your code. So if you fork your own child subprocess, or shell out to a command-line utility, all the memory is totaled up, and compared against the resource limits for the job.
Event Notes
Event notes are for your own internal use. They are displayed to users when editing an event, and in all e-mails regarding successful or failed jobs. For example, you could use this to describe the event to members of your team who may not be familiar, and possibly provide a link to other documentation. There is no character limit, so knock yourself out.
Run Now
To run an event immediately, click the Run Now button. This will run the current event regardless of its timing settings, and whether the event is enabled or disabled in the schedule. This is simply an on-demand job which is created and executed right away.
If you need to customize the internal clock for the job, hold Shift which clicking the Run Now button. This will bring up a dialog allowing you to set the date and time which the Plugin will see as the "current time", for your on-demand job only. It will not affect any other jobs or the event itself. This is useful for re-running past jobs with a Plugin that honors the now timestamp in the job data.
Completed Jobs Tab
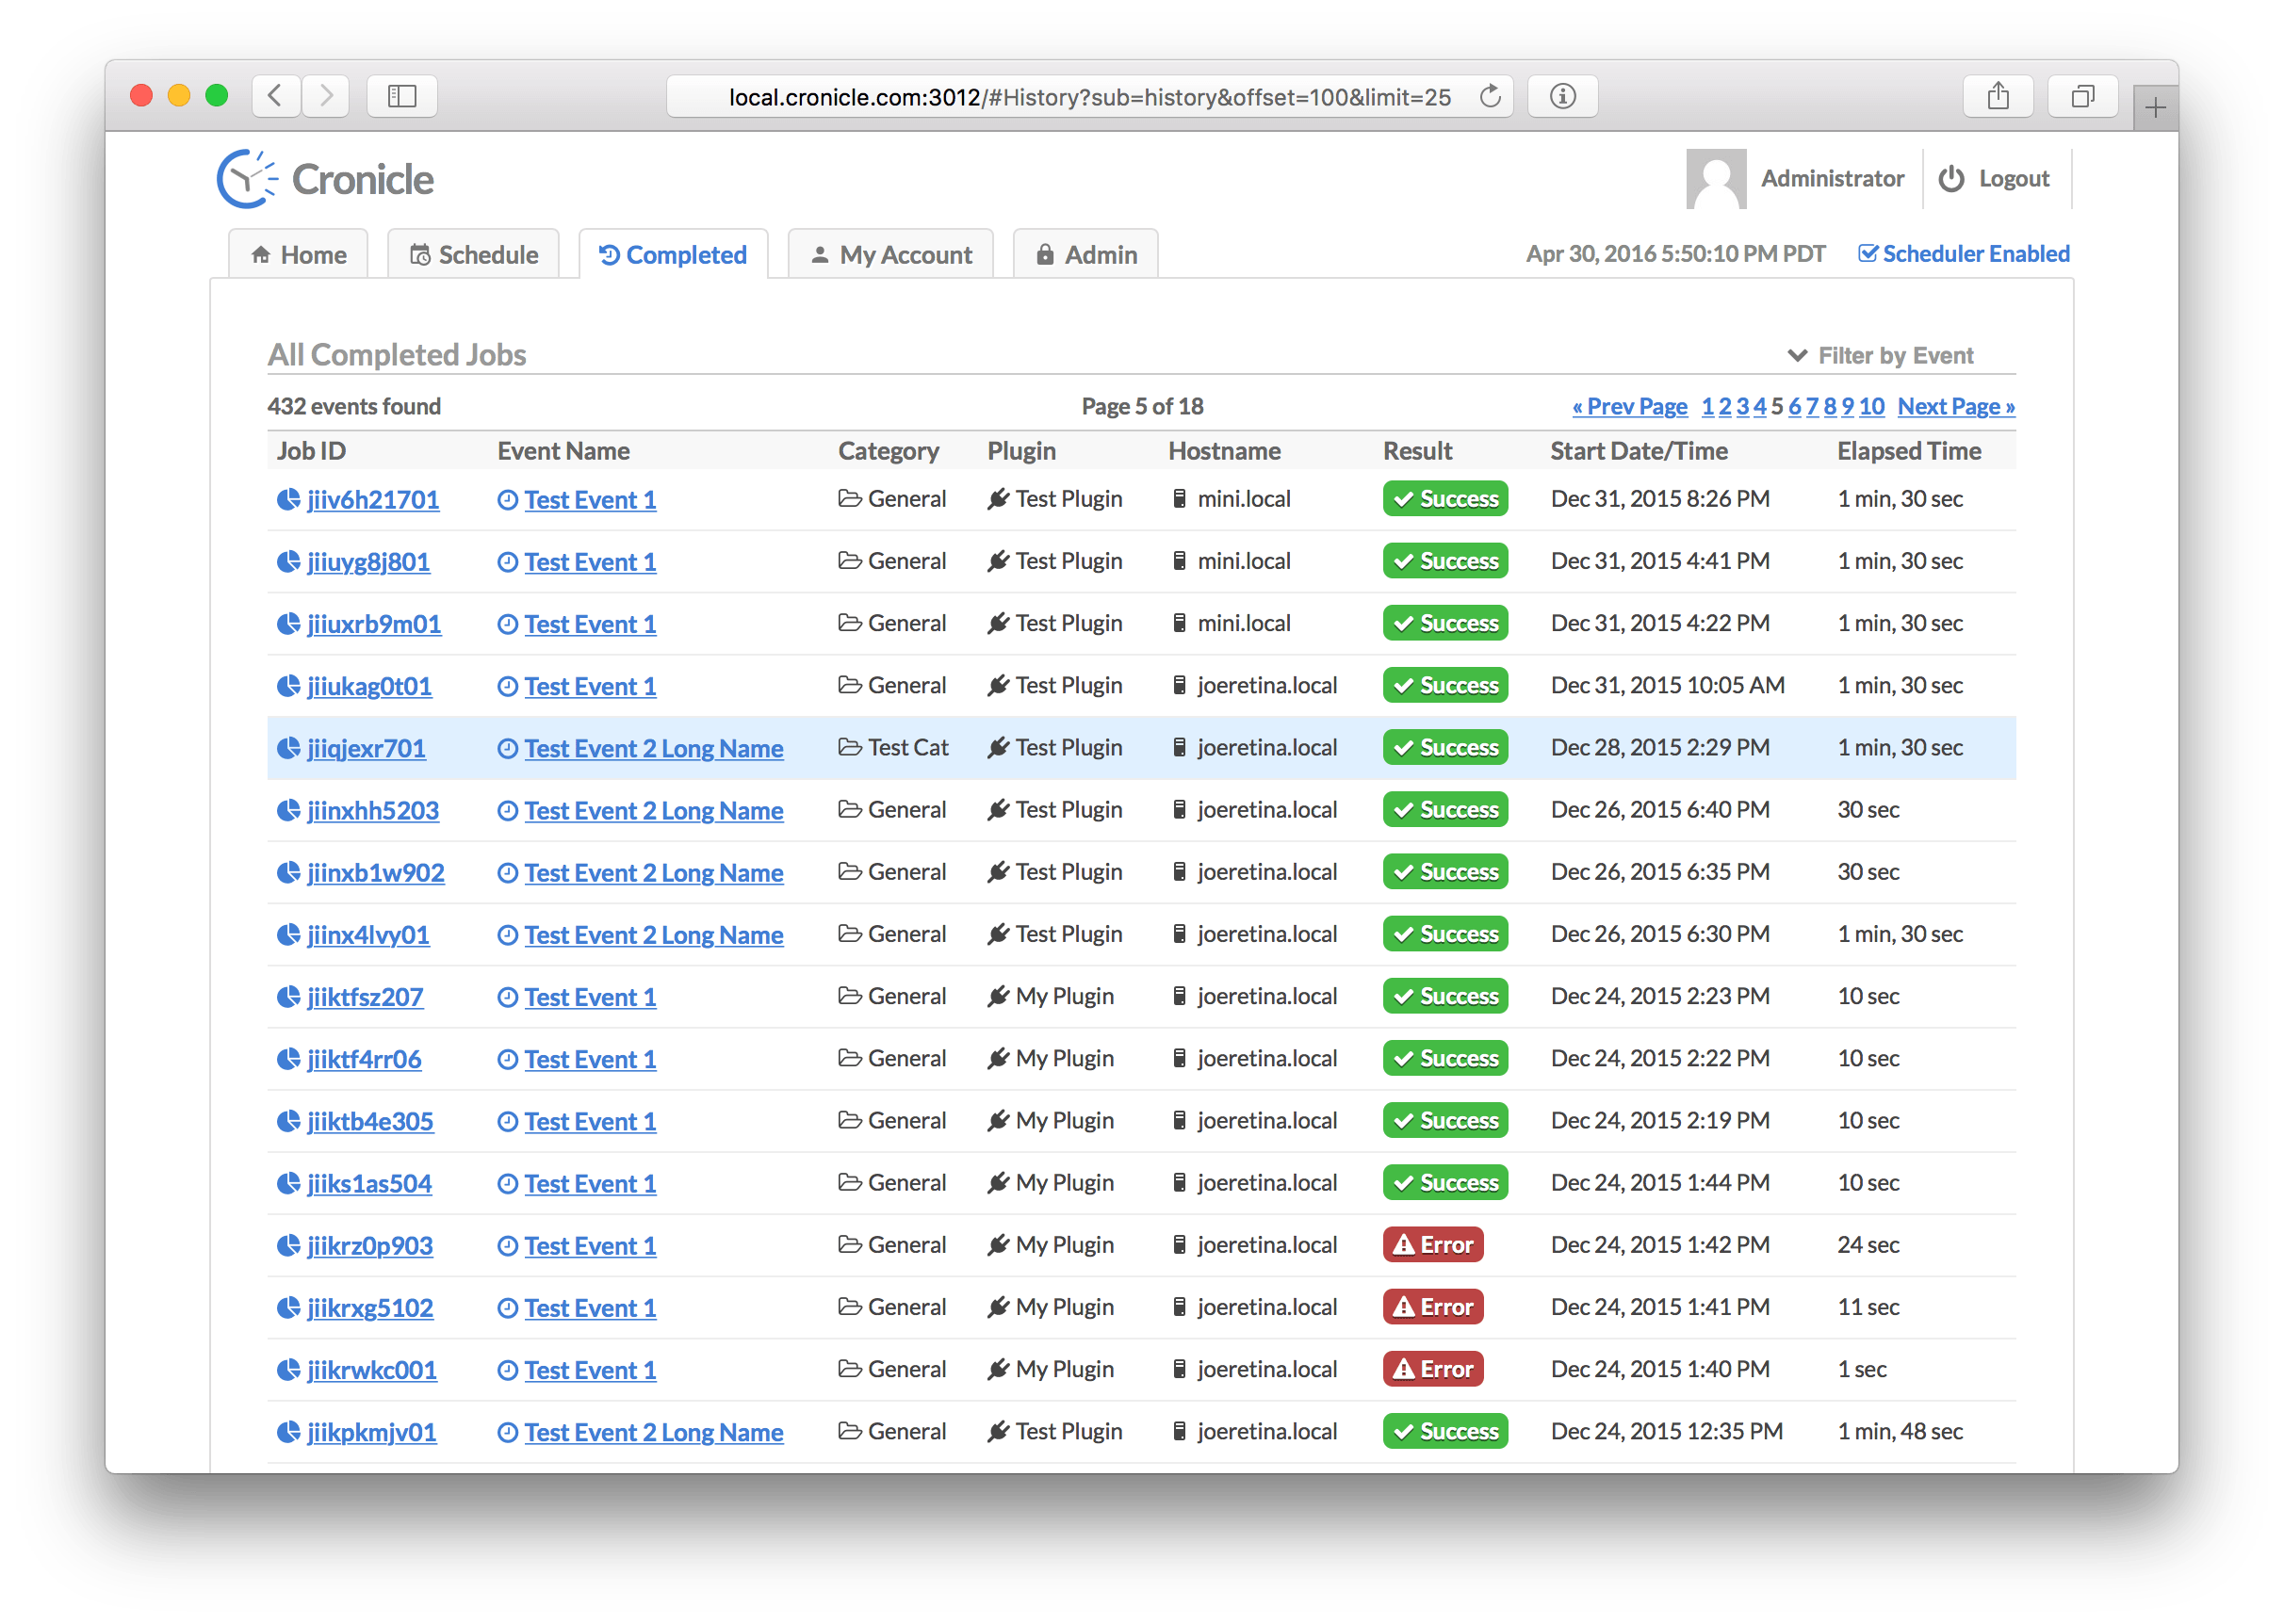
This tab shows you all recently completed jobs, for all events, and whether they succeeded or failed. Cronicle will keep up to list_row_max job completions in storage (default is 10,000). The jobs are sorted by completion date/time, with the latest at the top. Use the pagination controls on the top right to jump further back in time. The table columns are:
| Column | Description |
|---|---|
| Job ID | A unique ID assigned to the job. Click this to see details (see Job Details Tab below). |
| Event Name | The name of the scheduled event for the job. Click this to see the event history (see Event History Tab below). |
| Category | The category to which the event is assigned. |
| Plugin | The Plugin which was used to run the job. |
| Hostname | The hostname of the server which ran the job. |
| Result | This shows whether the job completed successfully, or returned an error. |
| Start Date/Time | The date/time when the job first started. |
| Elapsed Time | The total elapsed time of the job (including any retries). |
Event History Tab
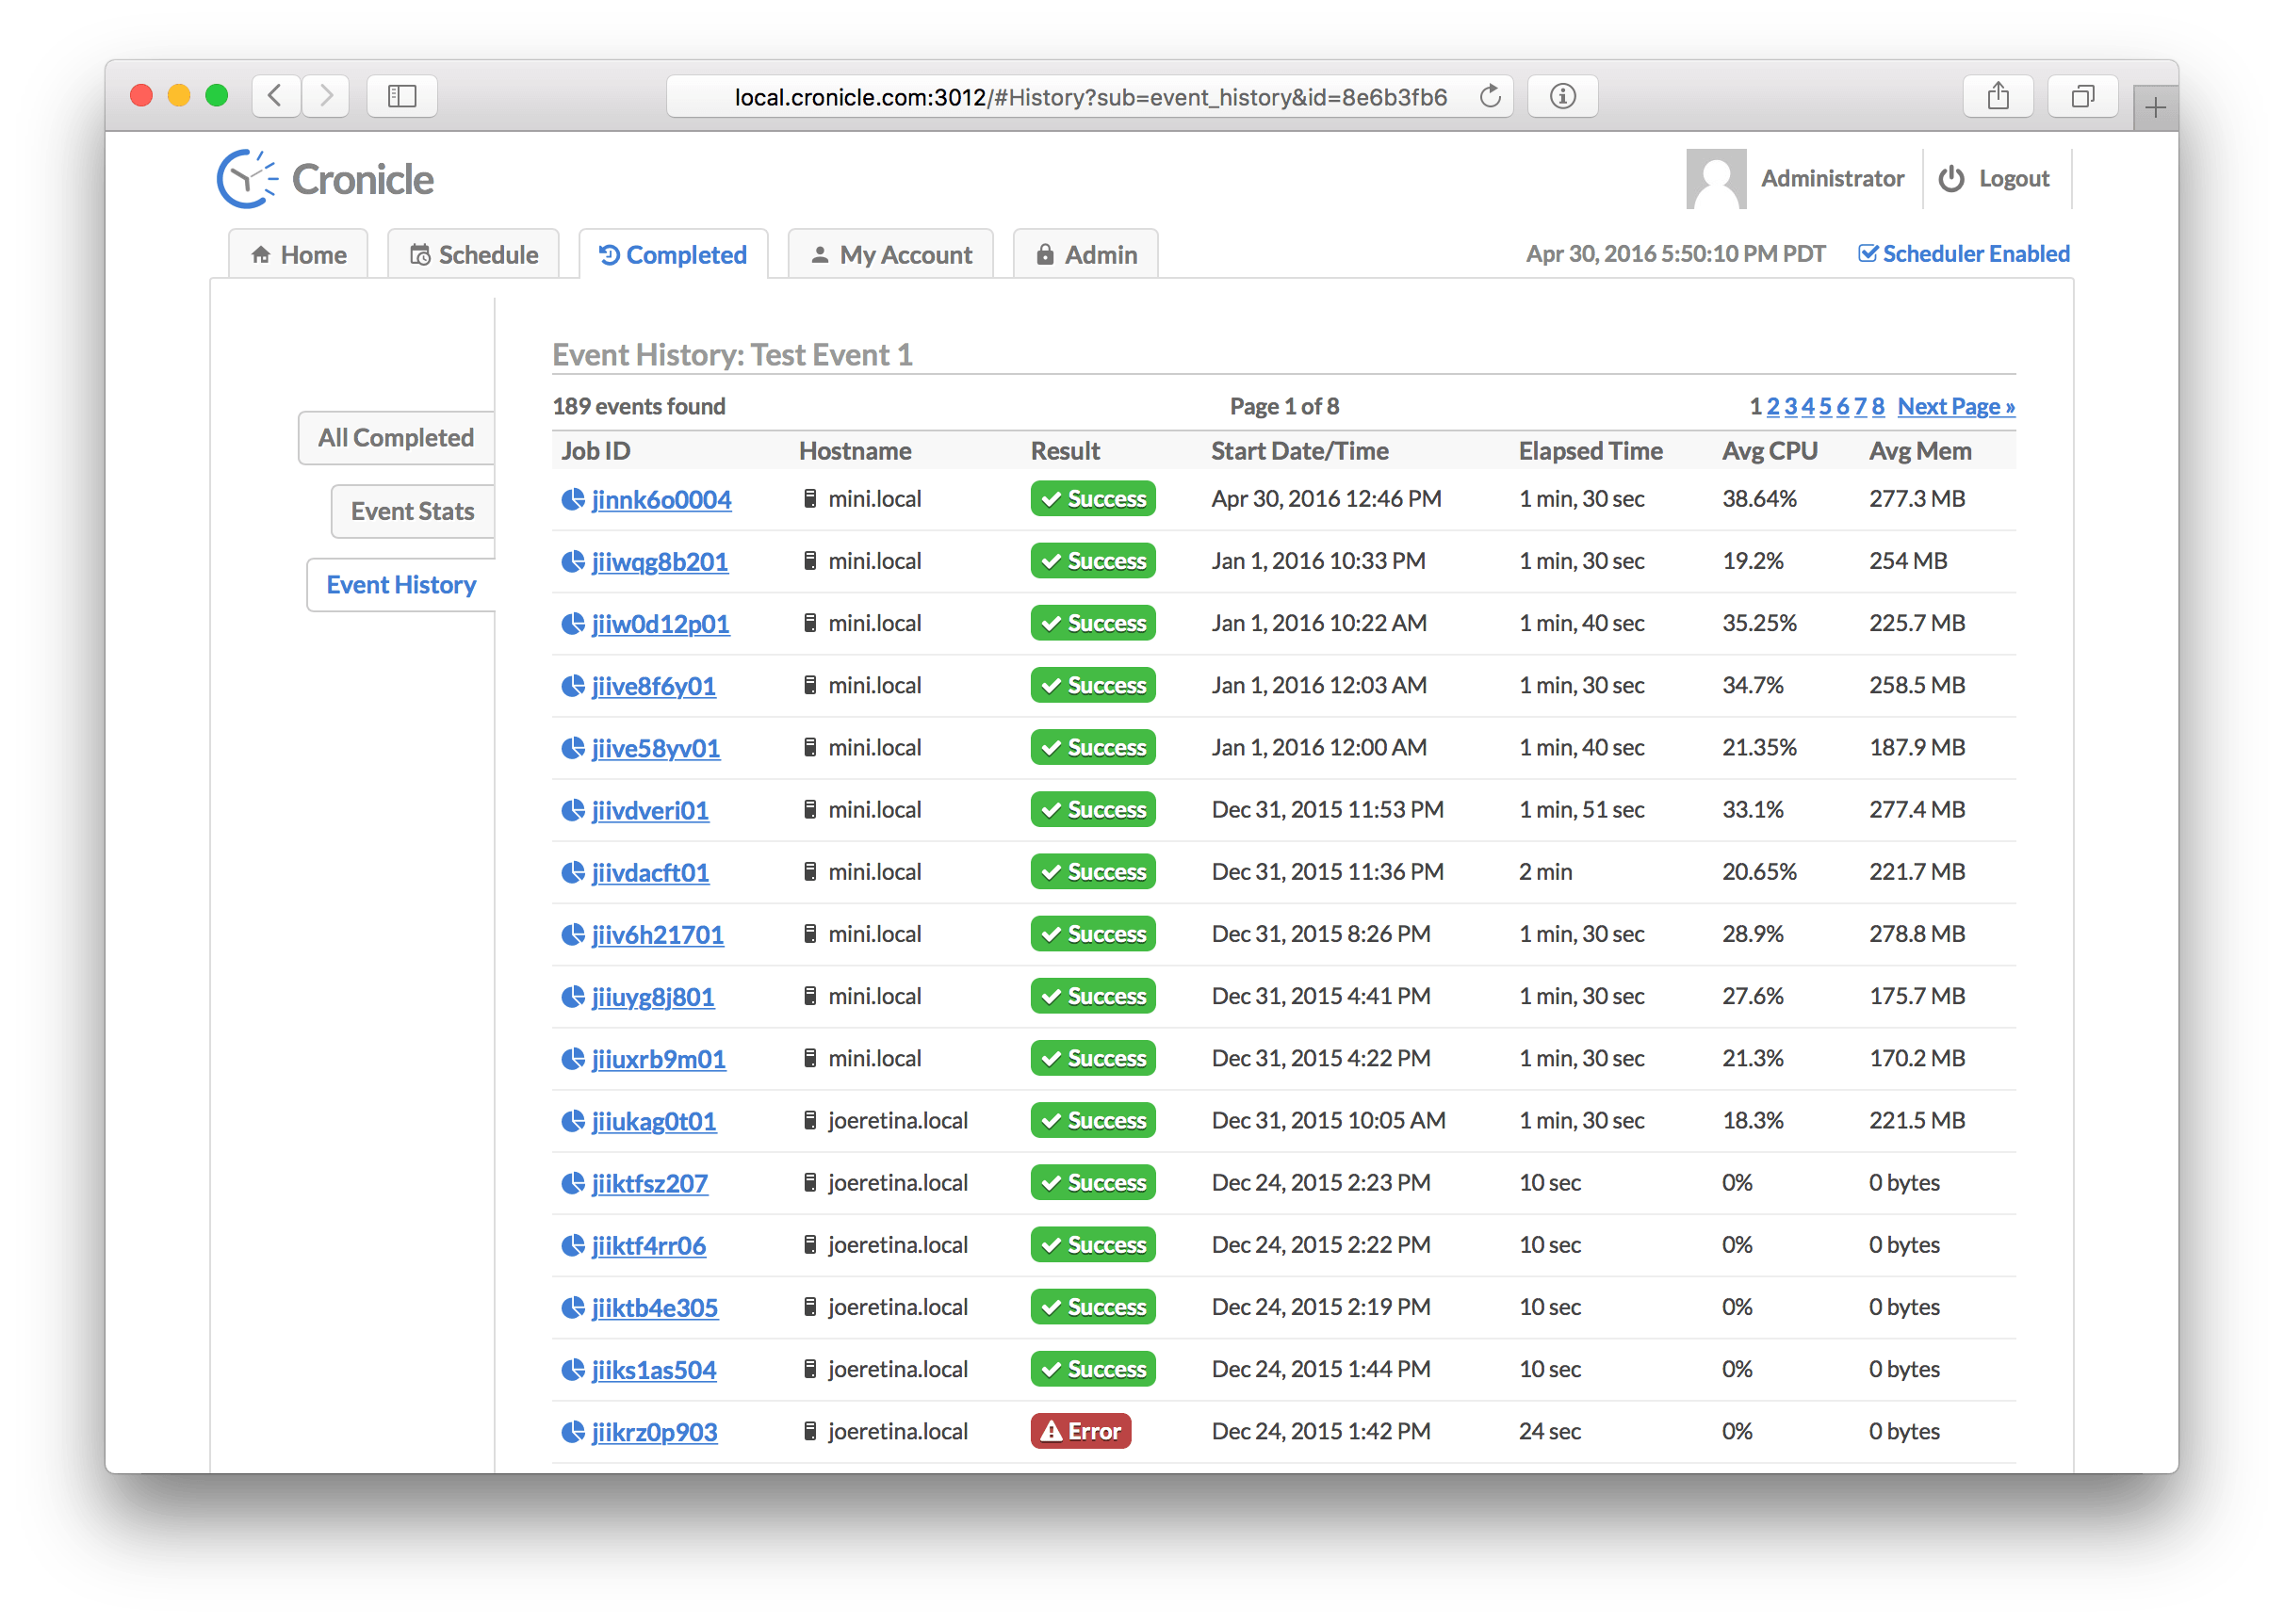
This tab shows you all recently completed jobs for one specific event. Cronicle will keep up to list_row_max job completions in storage (default is 10,000). The jobs are sorted by completion date/time, with the latest at the top. Use the pagination controls on the top right to jump further back in time. The table columns are:
| Column | Description |
|---|---|
| Job ID | A unique ID assigned to the job. Click this to see details (see Job Details Tab below). |
| Hostname | The hostname of the server which ran the job. |
| Result | This shows whether the job completed successfully, or returned an error. |
| Start Date/Time | The date/time when the job first started. |
| Elapsed Time | The total elapsed time of the job (including any retries). |
| Avg CPU | The average CPU percentage used by the job process (including any subprocesses), where 100% equals one CPU core. |
| Avg Mem | The average memory used by the job process (including any subprocesses). |
Event Stats Tab
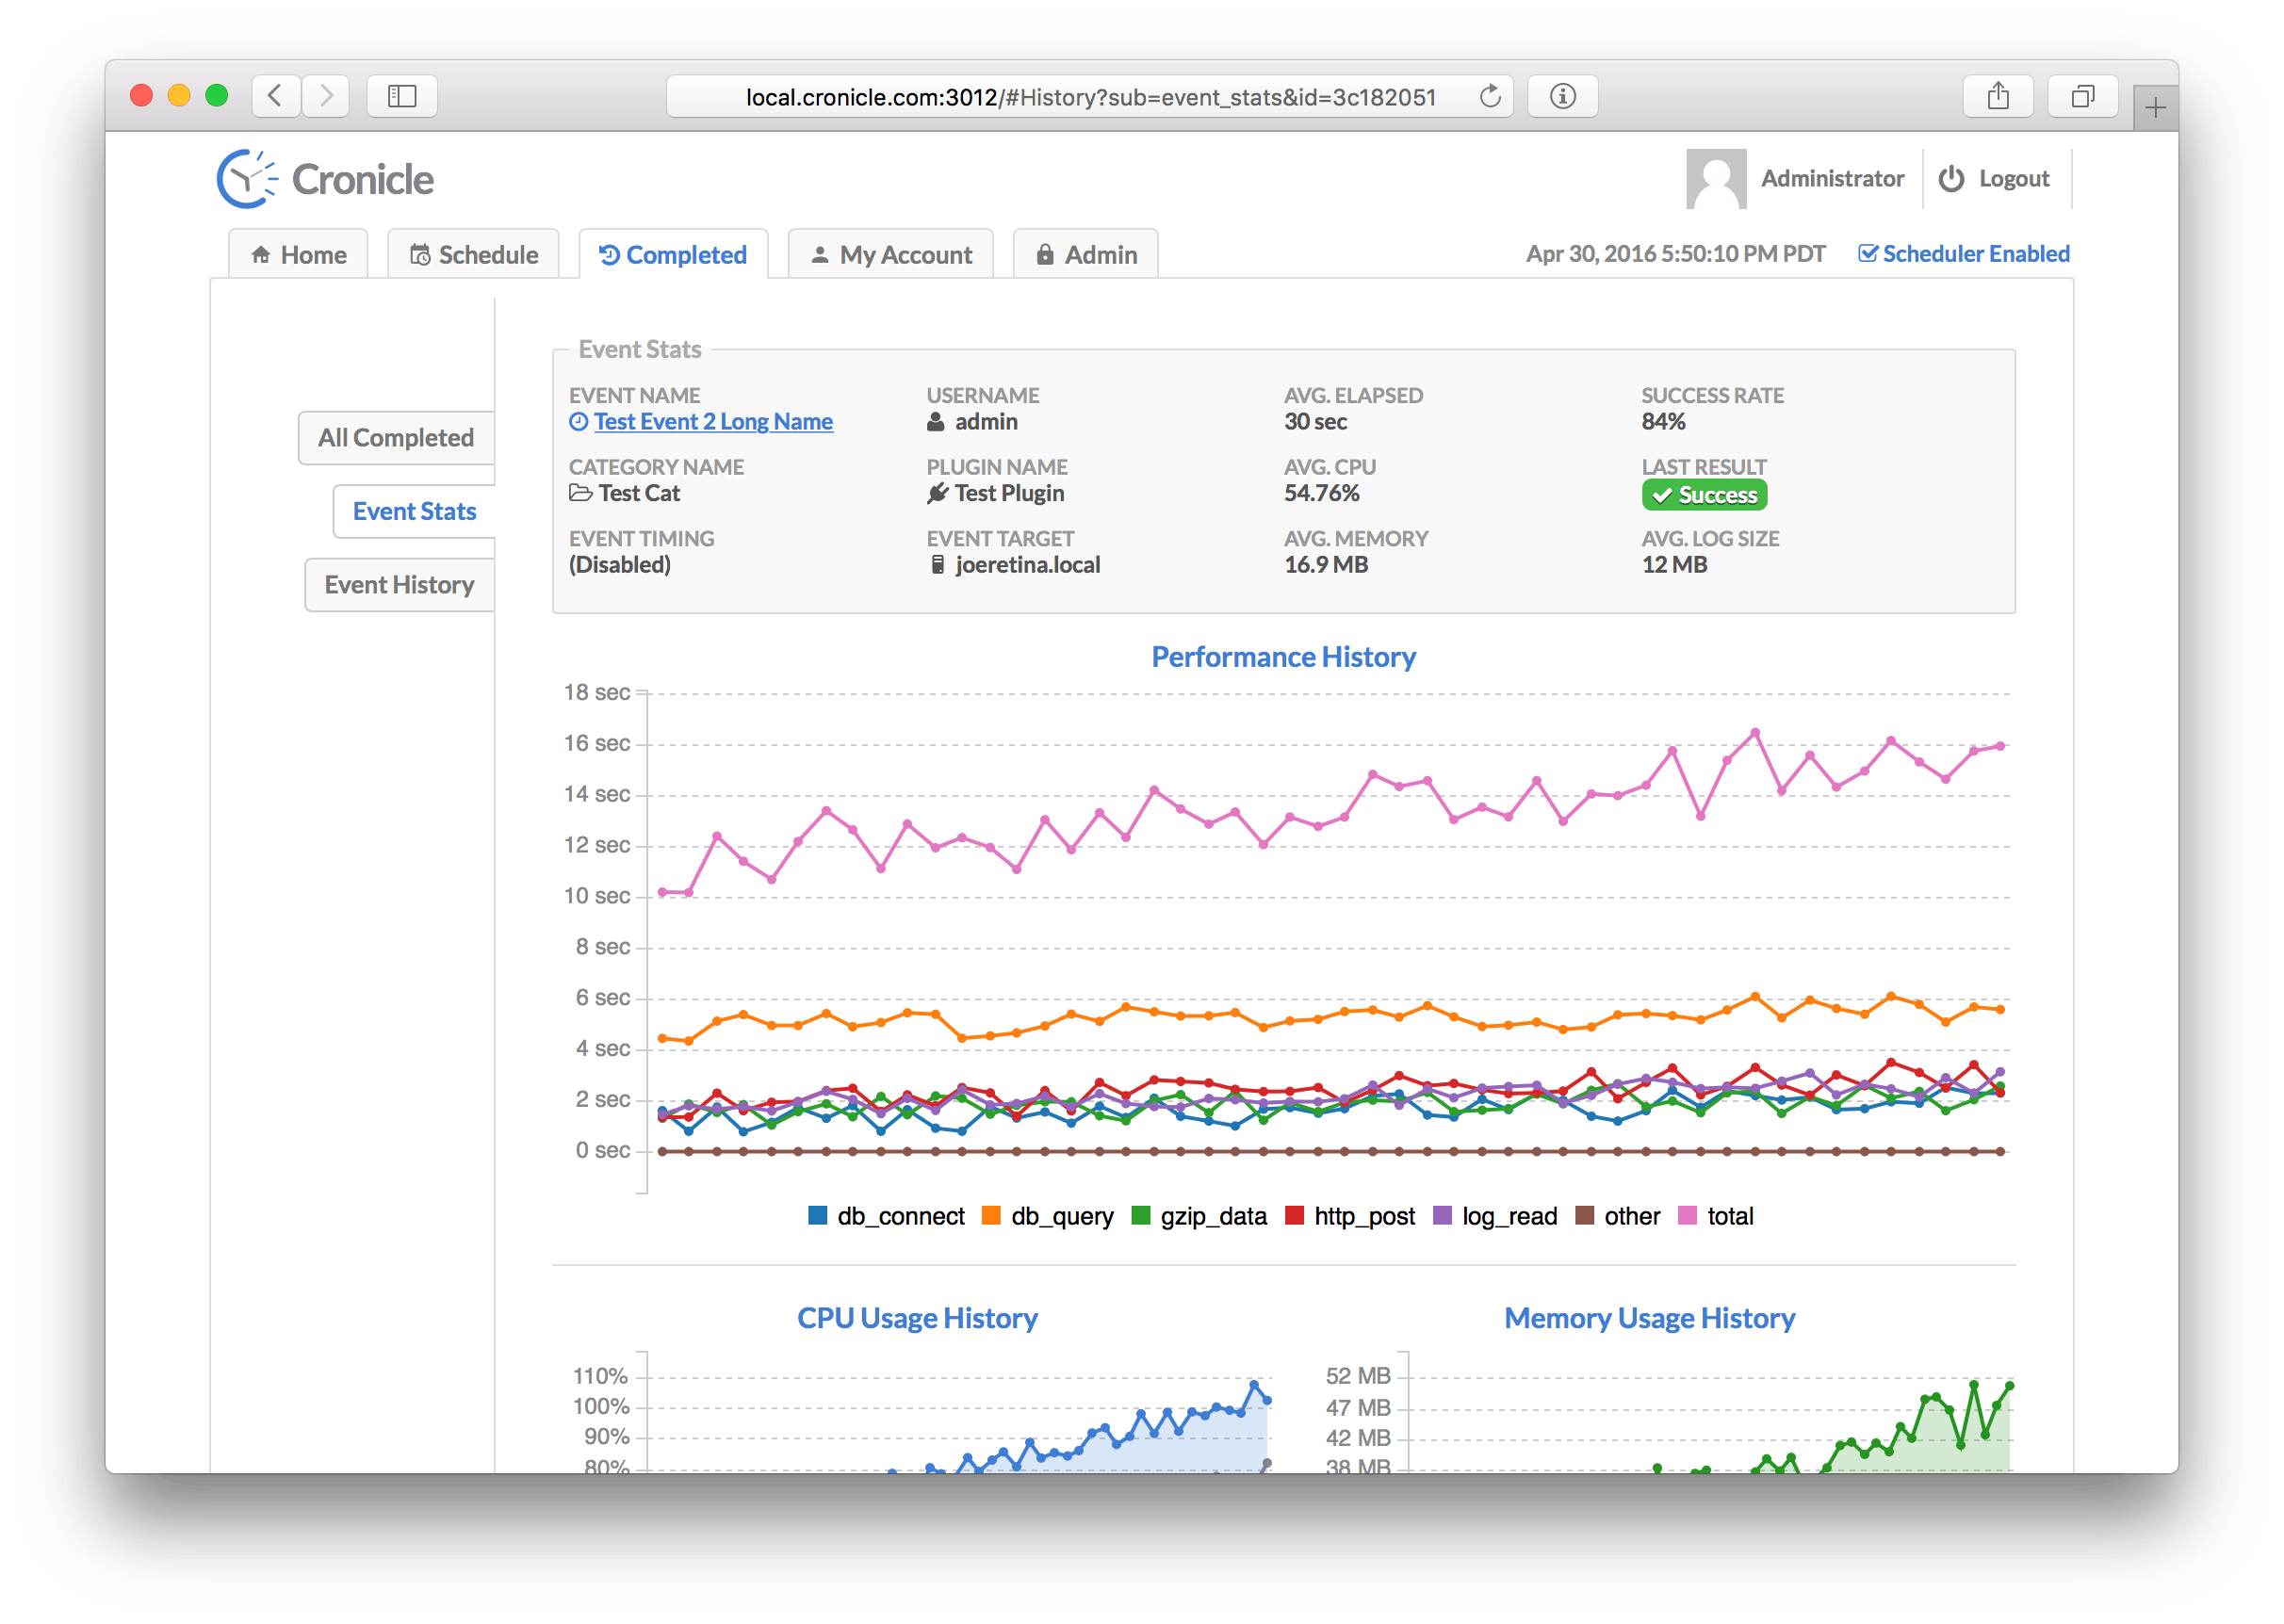
This tab contains statistics about a specific event, including basic information and performance graphs. The data is calculated from the last 50 completed jobs. Here is a list of all the stats that are displayed at the top of the screen:
| Statistic | Description |
|---|---|
| Event Name | The name of the event being displayed. |
| Category Name | The category to which the event is assigned. |
| Event Timing | The timing settings for the event (daily, hourly, etc.). |
| Username | The username of the user who first created the event. |
| Plugin Name | The Plugin selected to run jobs for the event. |
| Event Target | The server group or individual server selected to run jobs for the event. |
| Avg. Elapsed | The average elapsed time of jobs for the event. |
| Avg. CPU | The average CPU used by jobs for the event. |
| Avg. Memory | The average RAM used by jobs for the event. |
| Success Rate | The success percentage rate of jobs for the event. |
| Last Result | Shows the result of the latest job completion (success or fail). |
| Avg. Log Size | The average log file size of jobs for the event. |
Below the stats are a number of graphs:
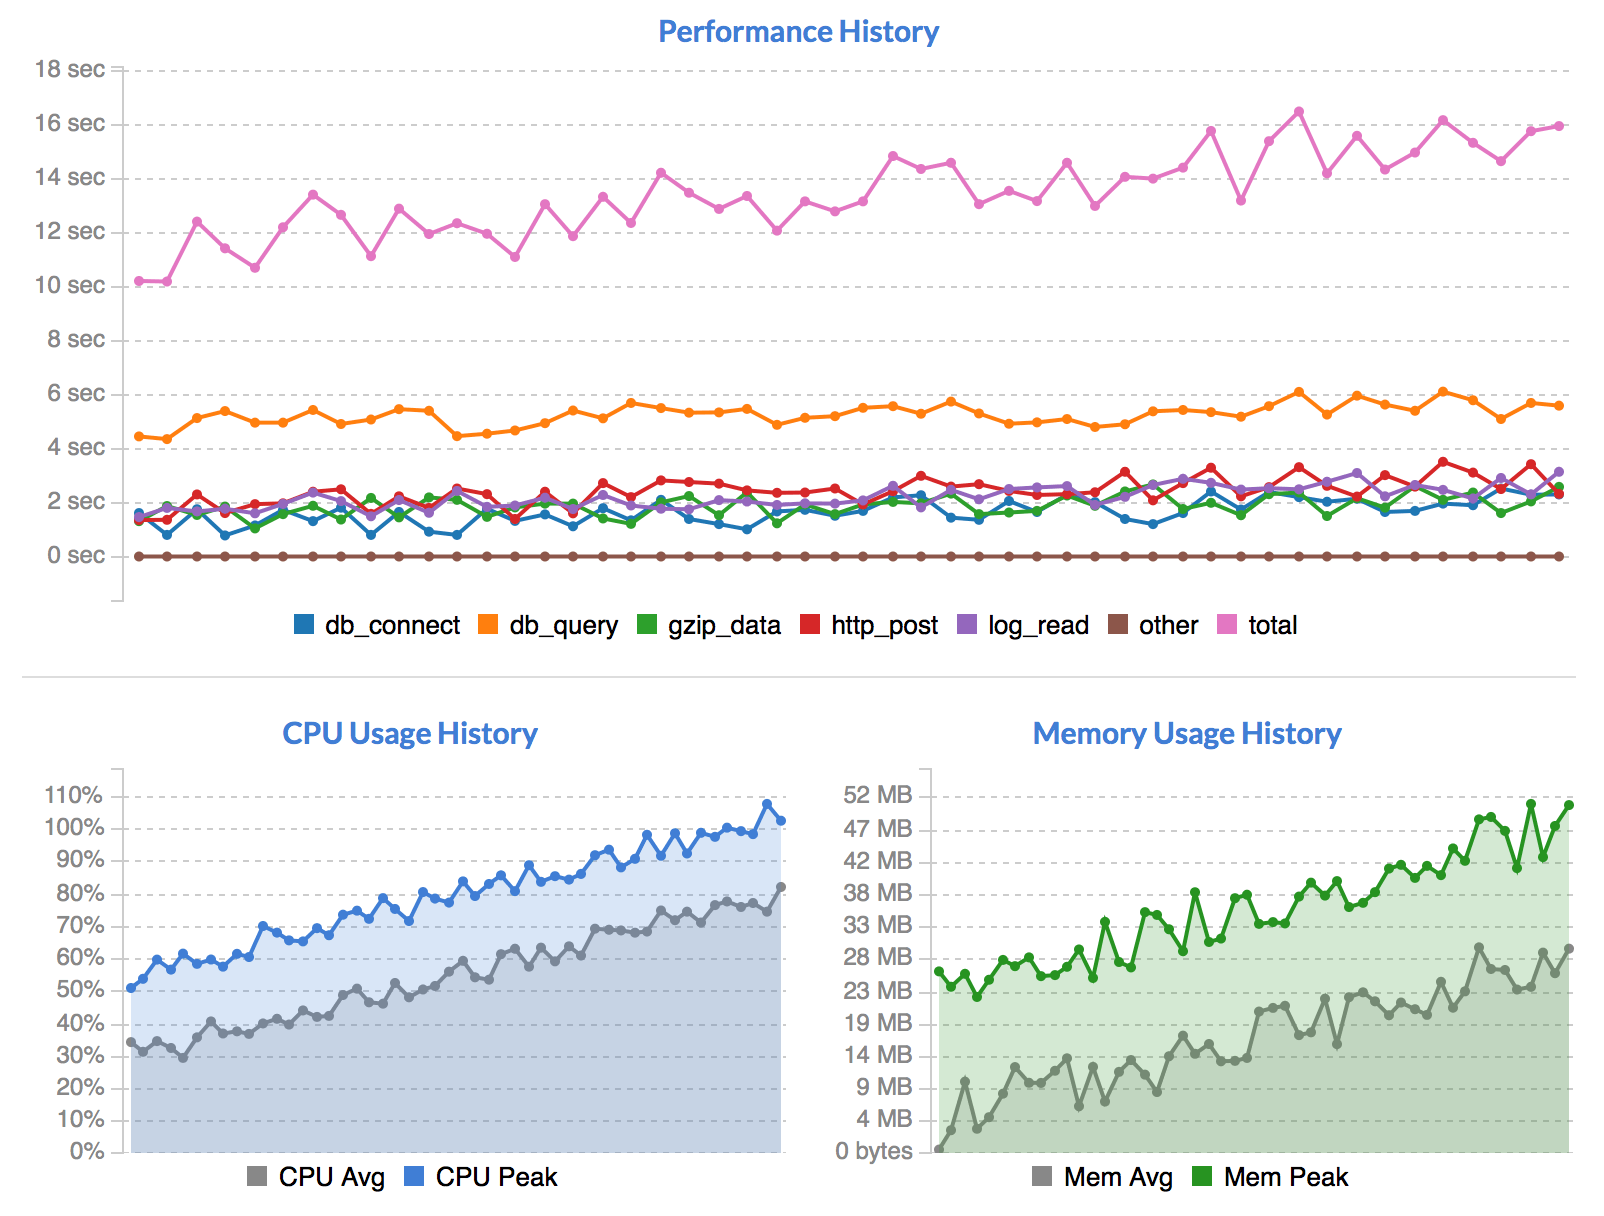
The first graph shows performance of your Plugin's metrics over time. The different categories shown are entirely driven by your custom code. You can choose to provide performance metrics or not, and add as many custom categories as you like. For details, see the Writing Plugins and Performance Metrics sections below.
Below the performance history graph are the CPU Usage History and Memory Usage History graphs. These display your event's server resource usage over time. Each dot on the graph is a particular job run, and the history goes back for 50 runs, if available.
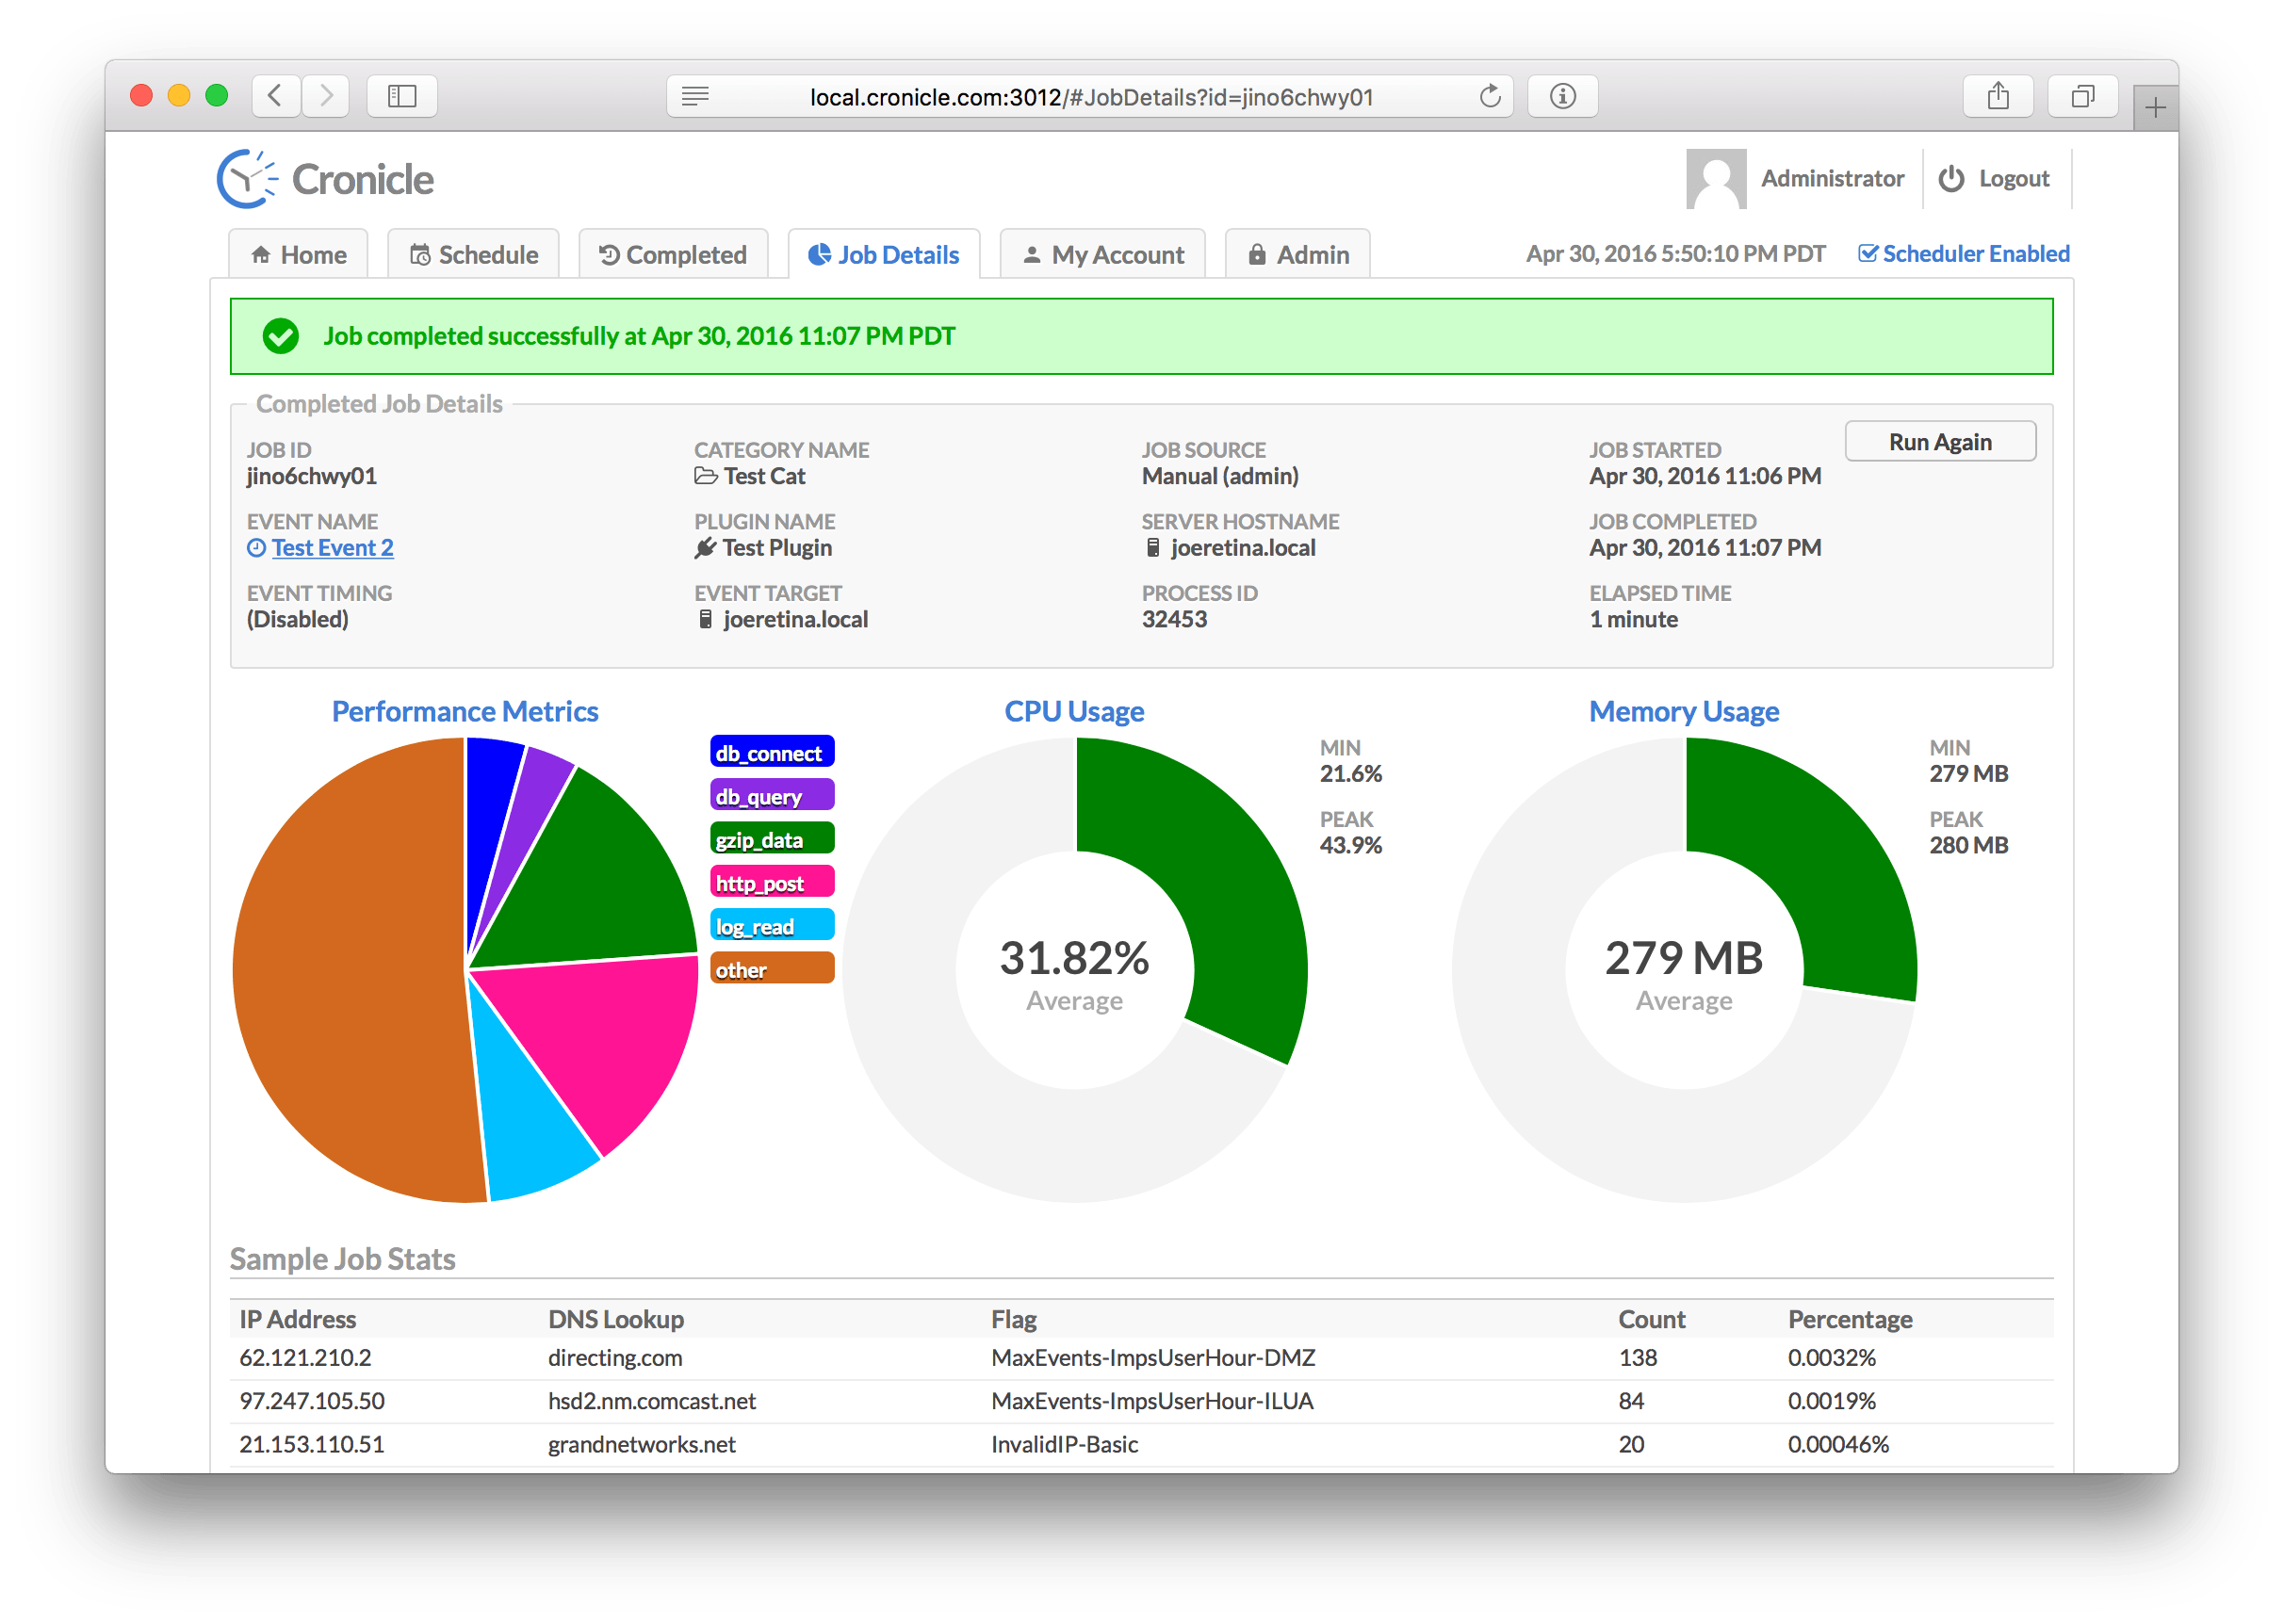
Job Details Tab
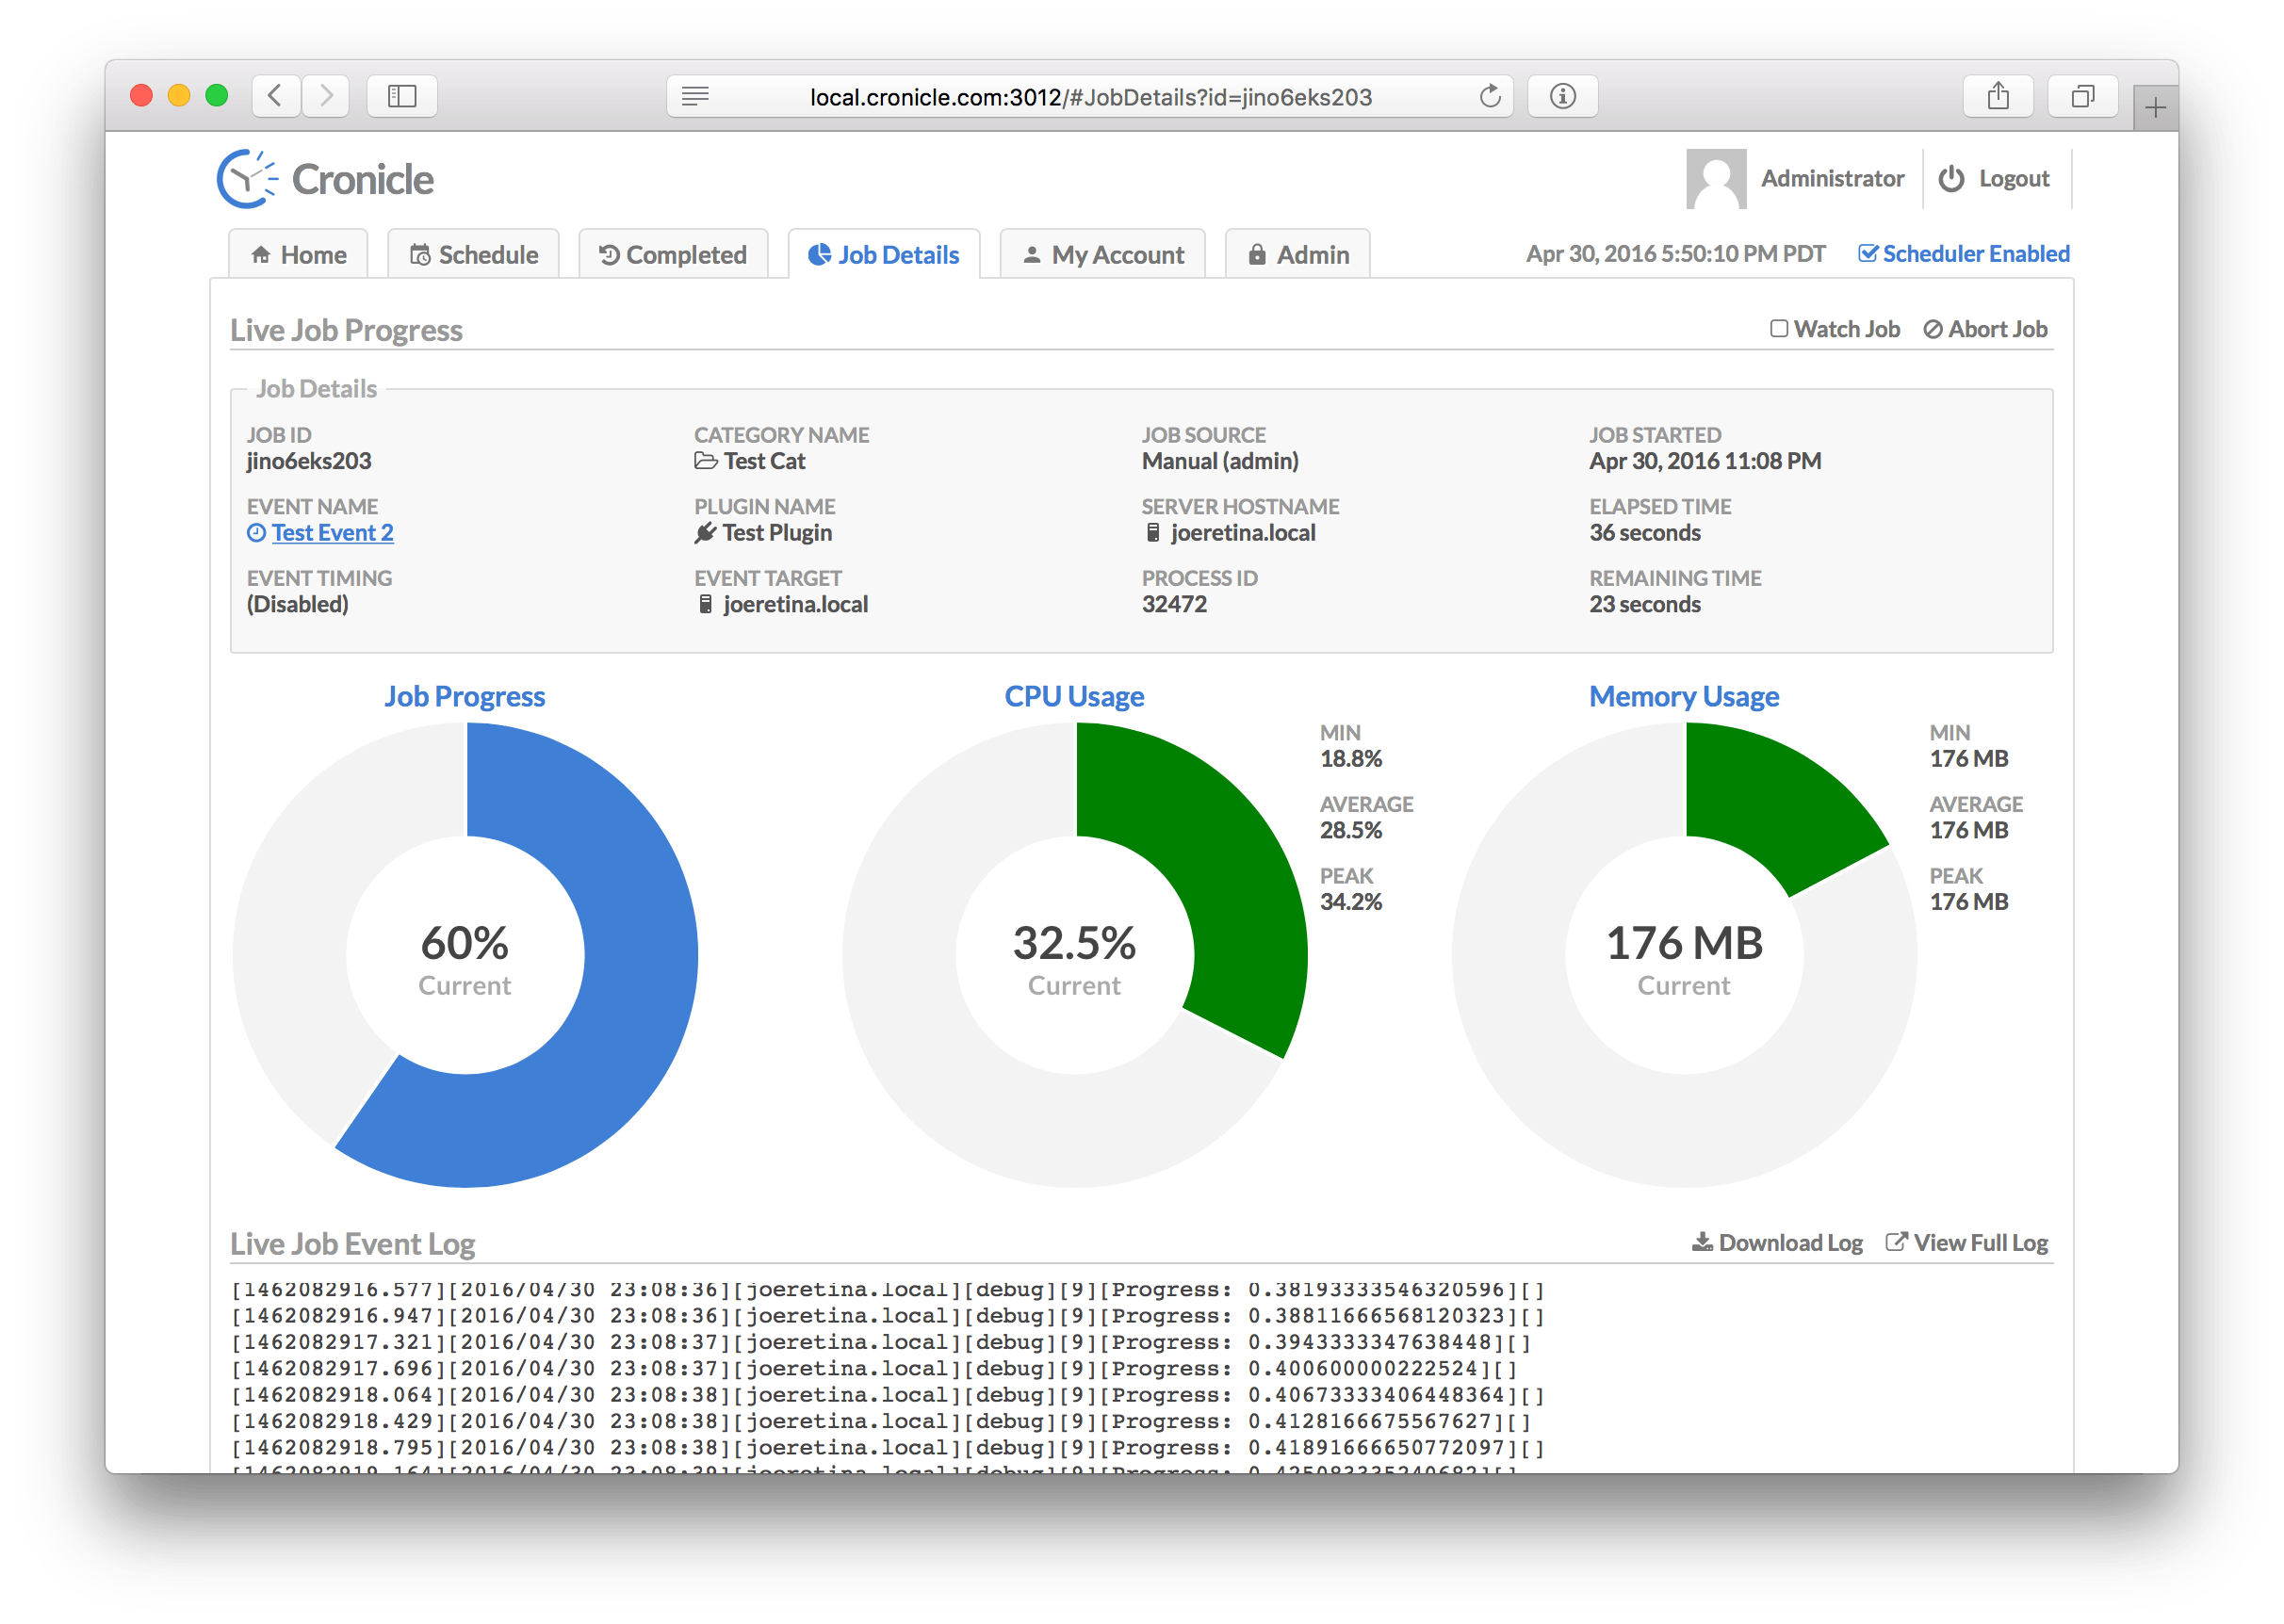
The Job Details Tab is used to view jobs currently in progress, and to see details about completed jobs. The display is slightly different for each case. For jobs in progress, you'll see some statistics about the job which are updated live (see below), and three large donut charts: The current job progress (if provided by the Plugin), and the current CPU and memory usage of the job. Below the donuts you'll find the live job log file, updated in real-time. The stats consist of:
| Statistic | Description |
|---|---|
| Job ID | A unique ID assigned to the job. |
| Event Name | The name of the event being displayed. |
| Event Timing | The timing settings for the event (daily, hourly, etc.). |
| Category Name | The category to which the event is assigned. |
| Plugin Name | The Plugin selected to run jobs for the event. |
| Event Target | The server group or individual server selected to run jobs for the event. |
| Job Source | The source of the job (who started it, the scheduler or manually by hand). |
| Server Hostname | The hostname of the server which is running the job. |
| Process ID | The ID of the process currently running the job. |
| Job Started | The date/time of when the job first started. |
| Elapsed Time | The current elapsed time of the job. |
| Remaining Time | The estimated remaining time (if available). |
The CPU donut chart visually indicates how close your job is to using a full CPU core. If it uses more than that (i.e. multiple threads or sub-processes), the chart simply shows "full" (solid color). The Memory donut visually indicates your job's memory vs. the "maximum" configured resource limit, or 1 GB if resource limits are not in effect for the job. The colors are green if the donut is under 50% filled, yellow if between 50% and 75%, and red if over 75%.
When the job completes, or when viewing details about a previously completed job, the display looks slightly different:
The only difference in the statistics table is that the right-hand column contains the Job Completed date/time instead of the remaining time. Below that, the left-hand donut graph now shows performance metrics from your Plugin (if provided). You can choose to provide performance metrics or not, and add as many custom categories as you like. For details, see the Writing Plugins and Performance Metrics sections below.
The CPU and Memory donut charts now show the average values over the course of your job run, rather than the "current" values while the job is still running. The same visual maximums and color rules apply (see above).
Here is how the Job Details tab looks when a job fails:
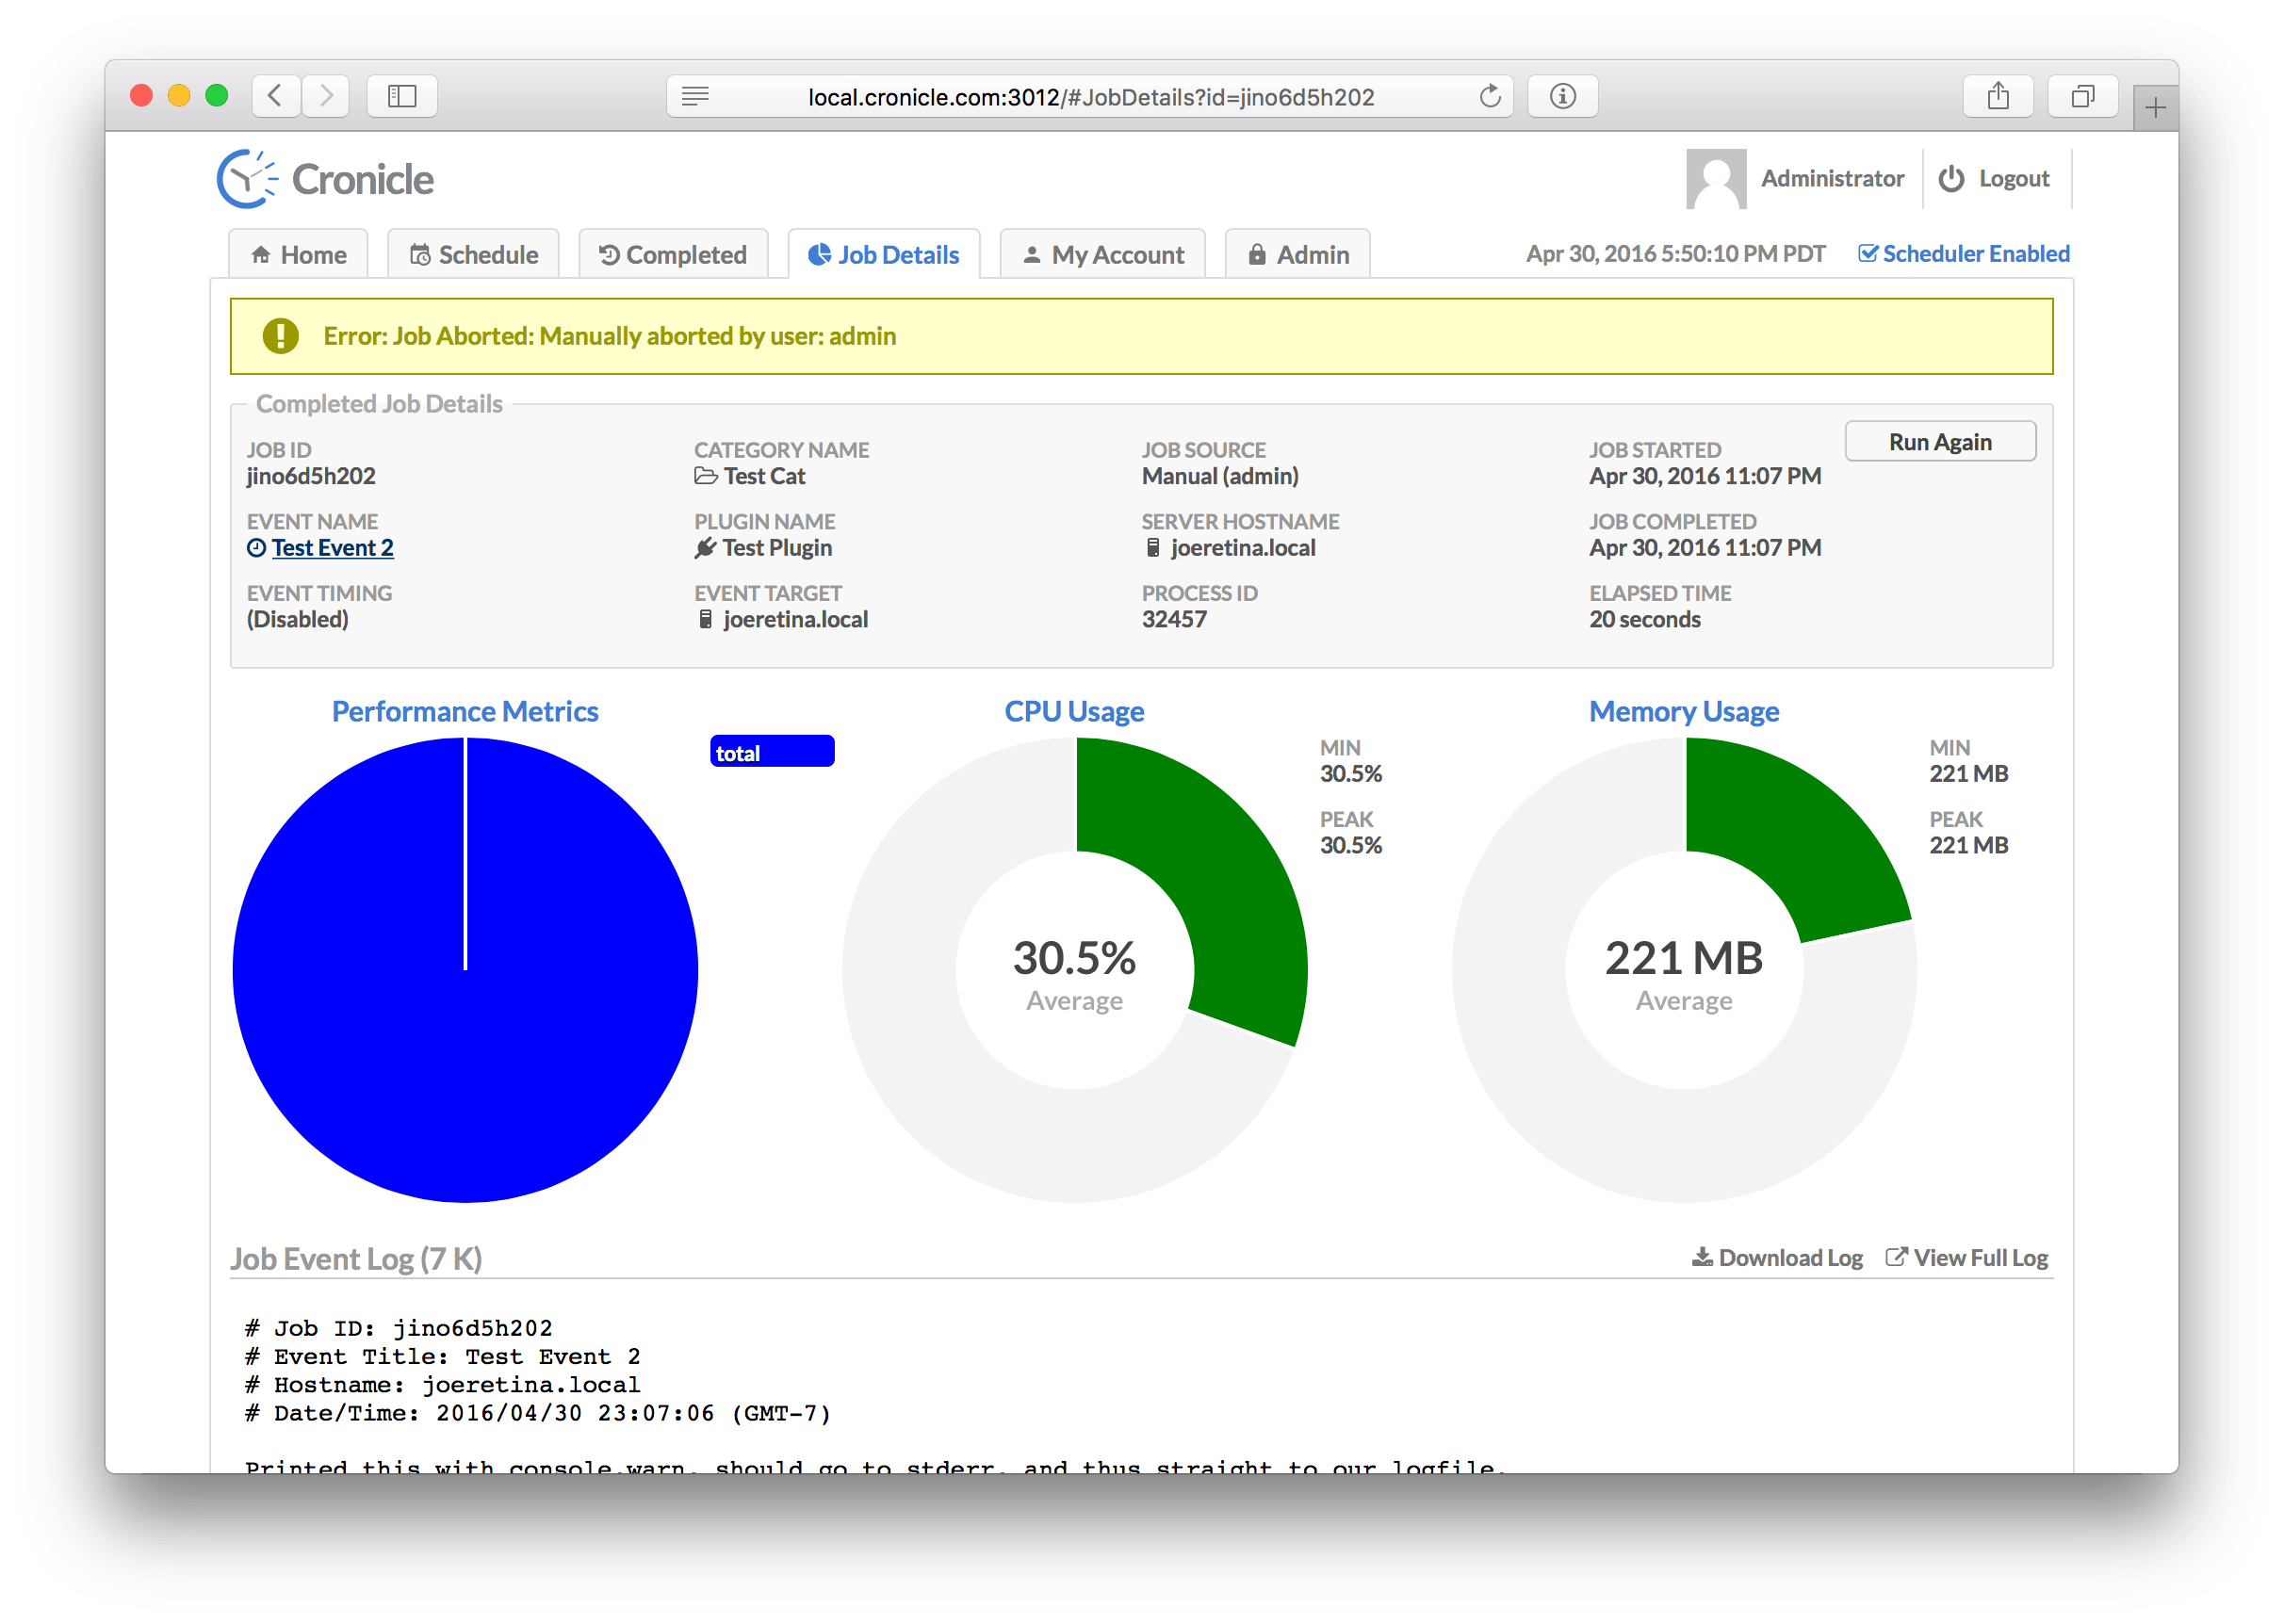
The error message is displayed in a banner along the top of the screen. The banner will be yellow if the job was aborted, or red if an error was returned from your Plugin.
In this case the job was aborted, so the Plugin had no chance to report performance metrics, hence the left-hand pie chart is blank.
My Account Tab
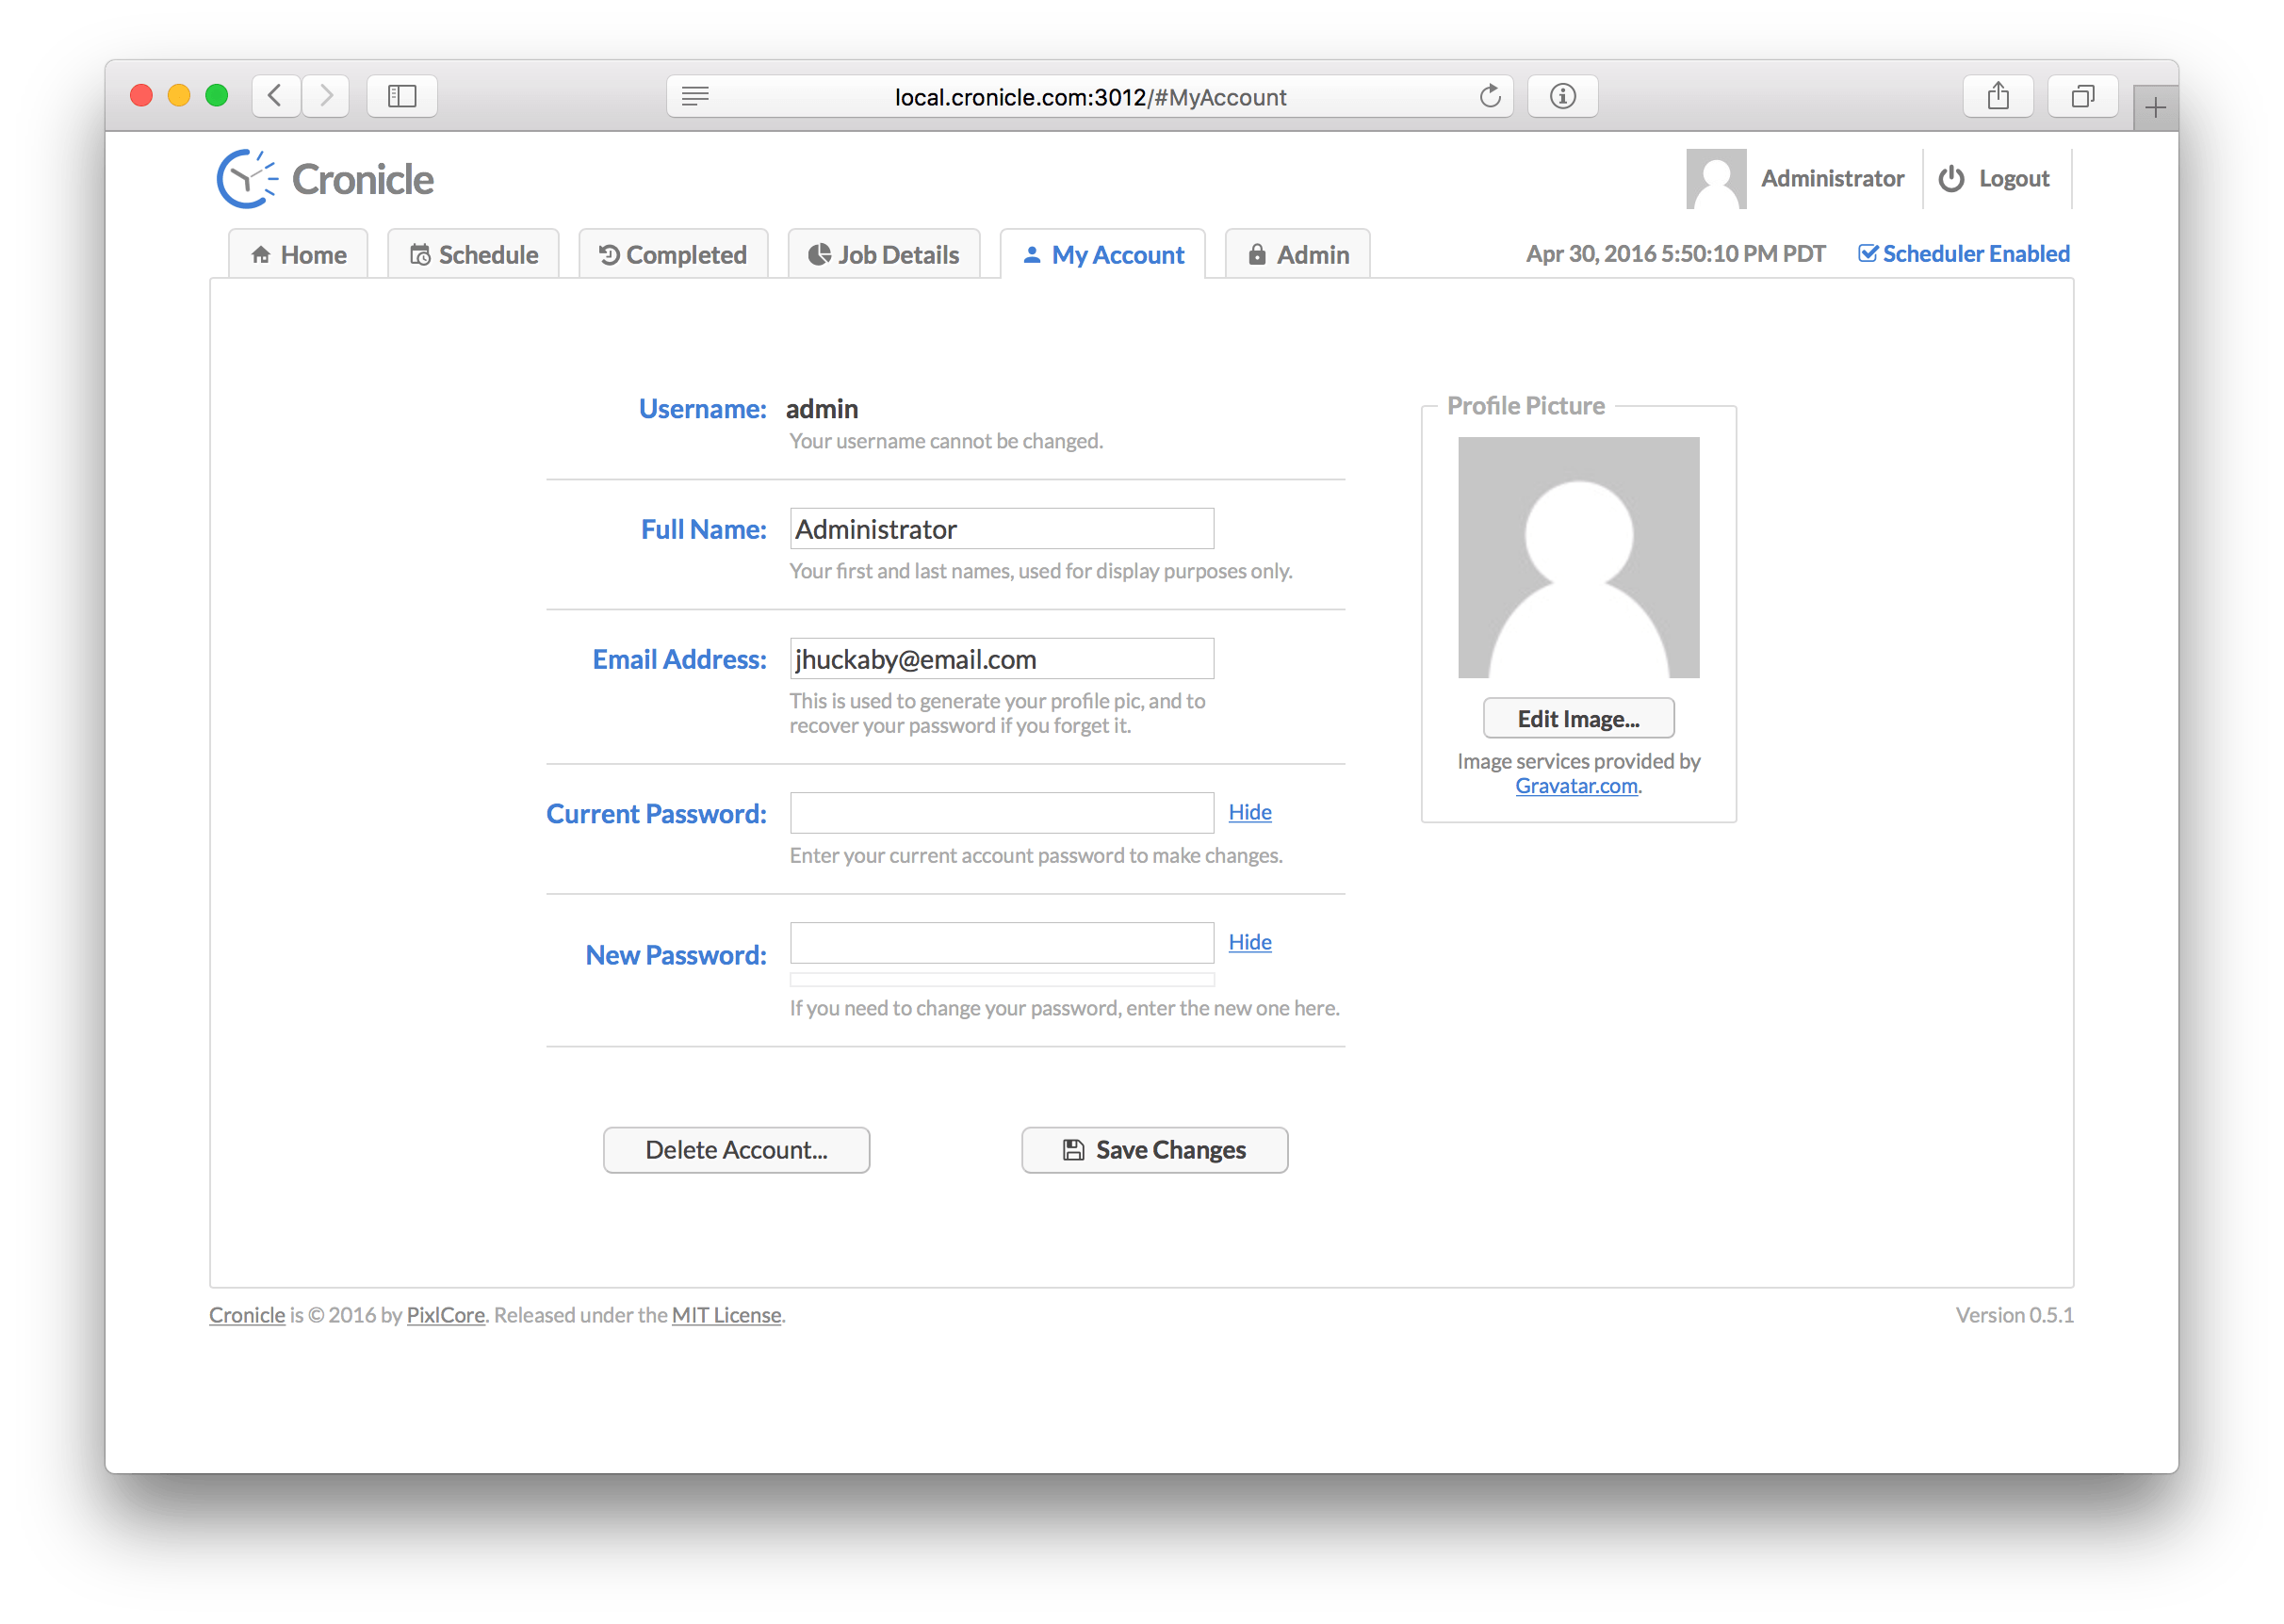
On this tab you can edit your own account profile, i.e. change your name, e-mail address, and/or password. You also have the option of completely deleting your account via the "Delete Account" button. For security purposes, in order to save any changes you must enter your existing account password.
Your user avatar image is automatically pulled from the free Gravatar.com service, using your e-mail address. To customize your image, please login or create a Gravatar account using the same e-mail address as the one in your Cronicle account.
Administration Tab
This tab is only visible and accessible to administrator level users. It allows you to view the global activity log, manage API keys, categories, Plugins, servers and users. To access all the various functions, use the tabs along the left side of the page.
Activity Log Tab
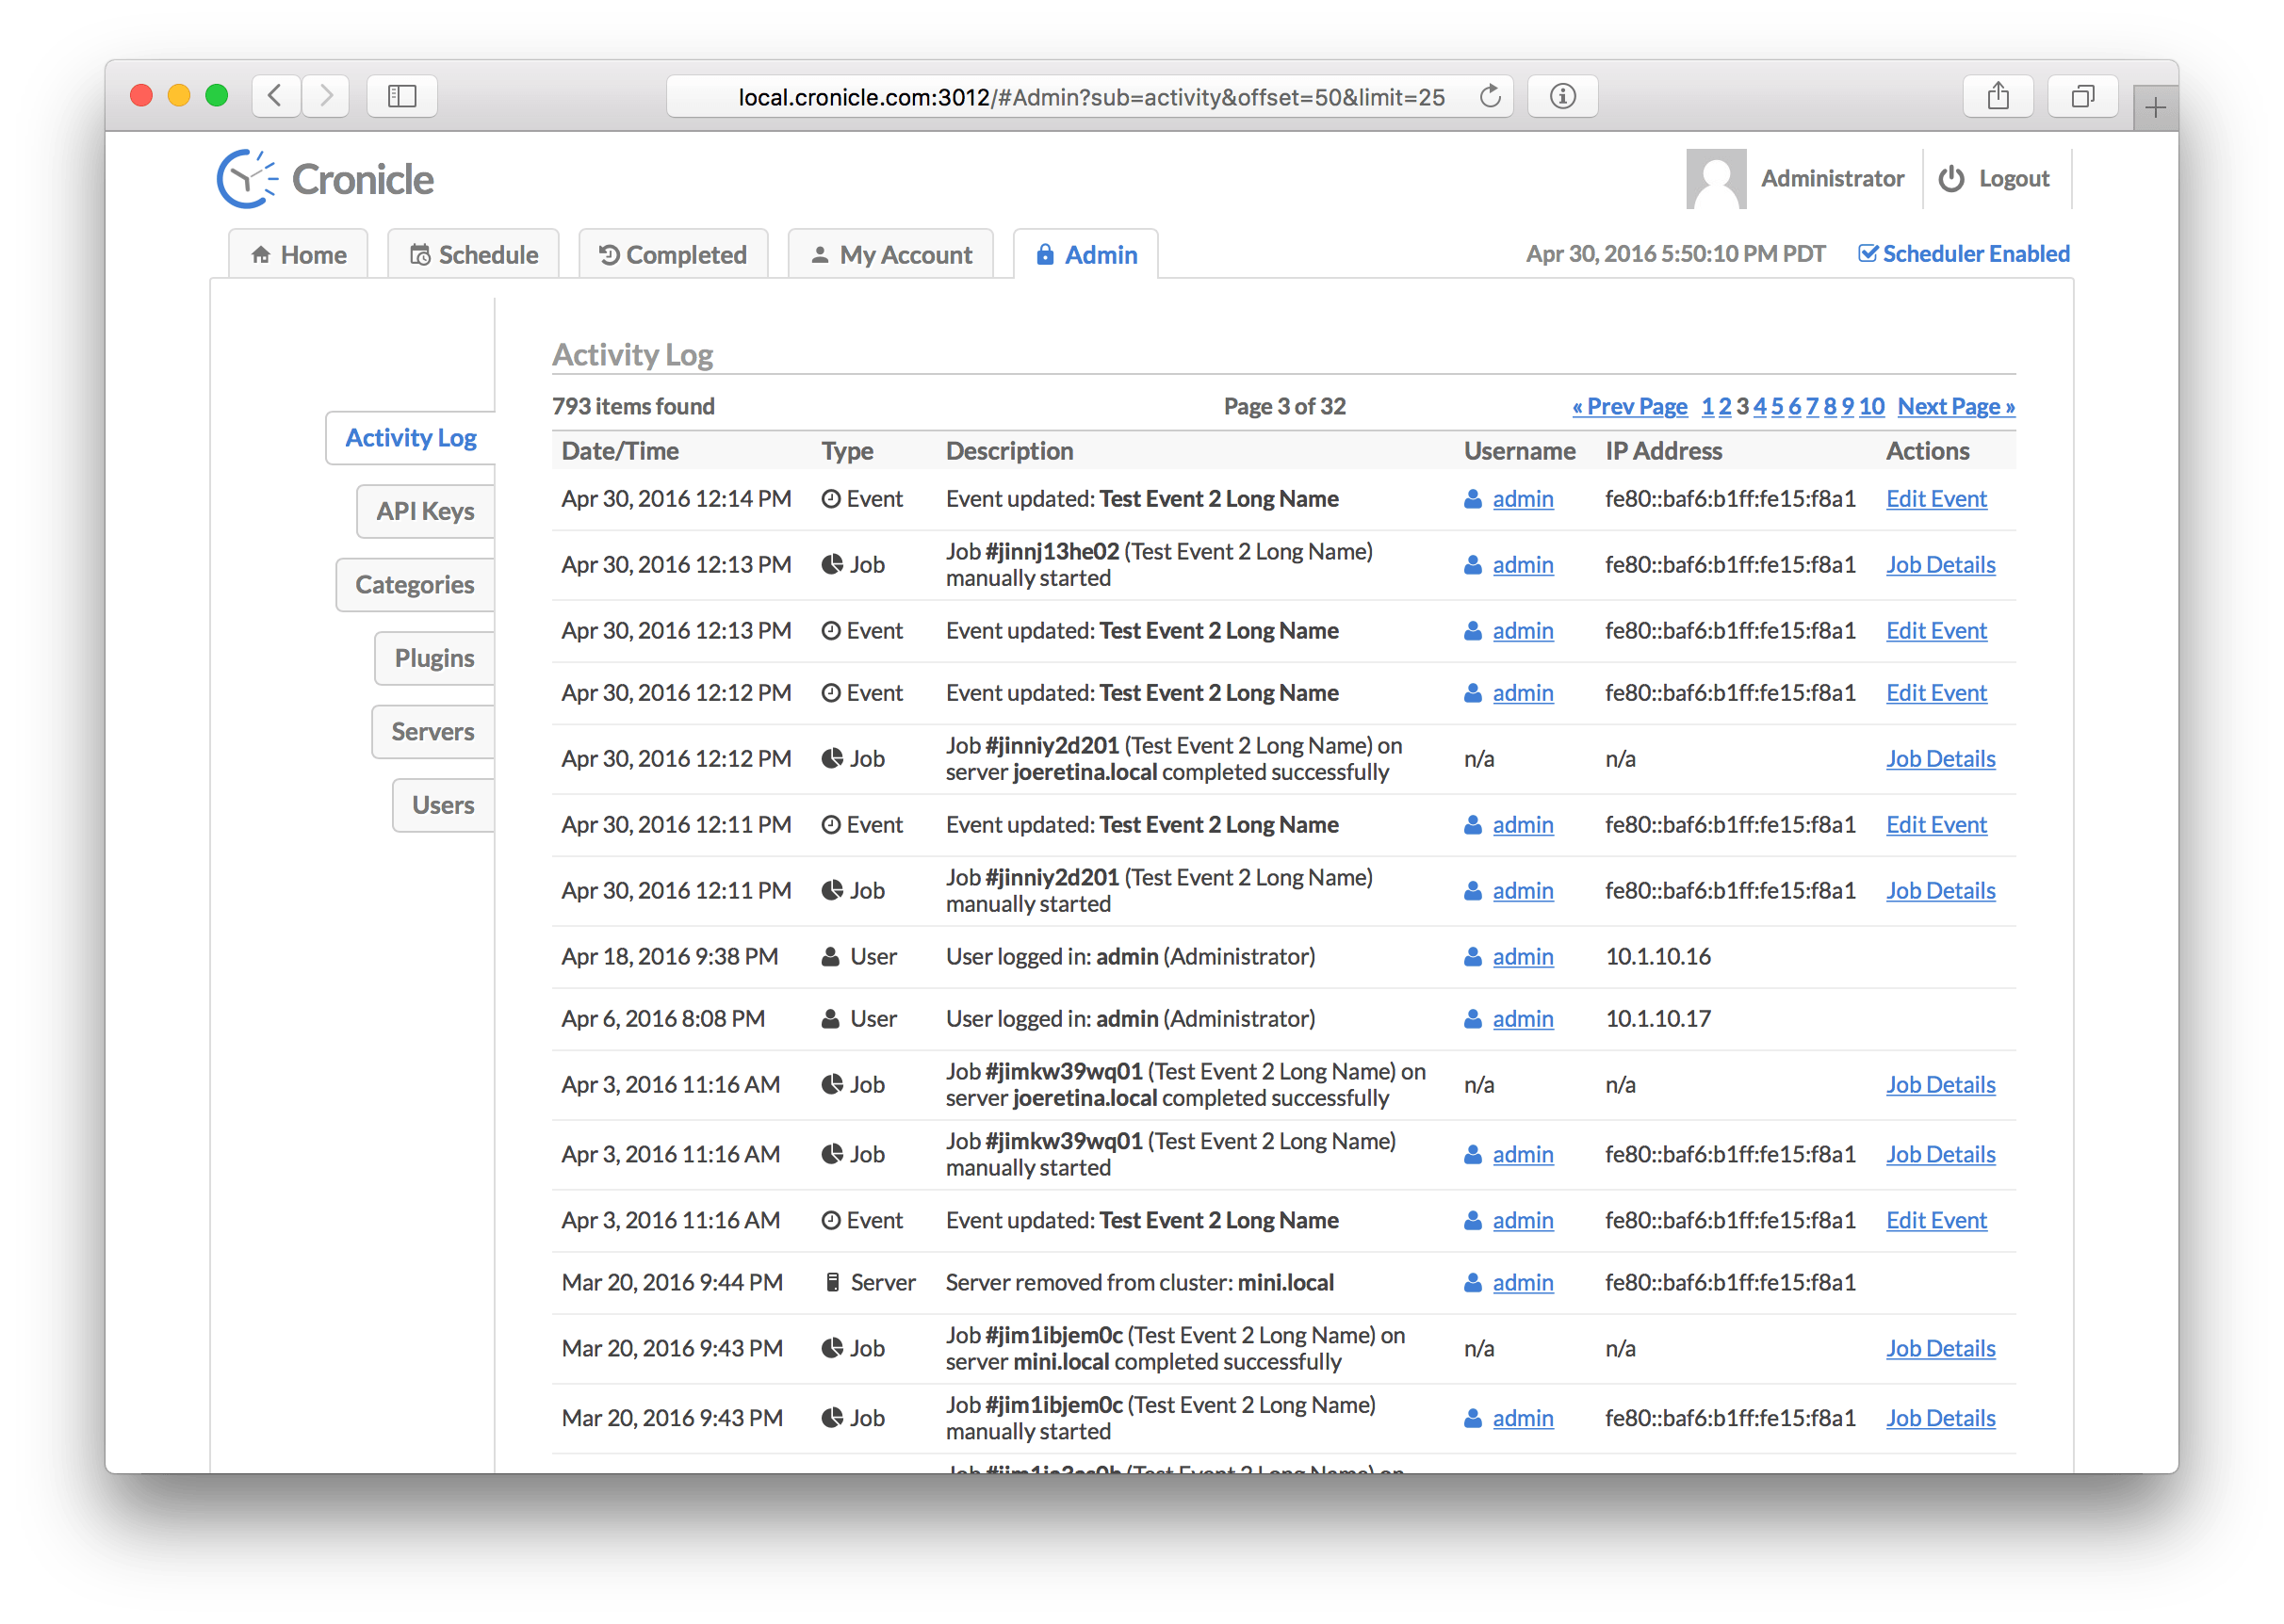
All activity in Cronicle is logged, and viewable on the Activity Log tab. The log is presented as a paginated table, sorted by descending date/time (newest activity at the top). Pagination controls are located in the top-right corner. The table columns are as follows:
| Column | Description |
|---|---|
| Date/Time | The date and time of the activity (adjusted for your local timezone). |
| Type | The type of activity (error, event, category, server, etc.). |
| Description | A description of the activity (varies based on the type). |
| Username | The username or API Key associated with the activity, if applicable. |
| IP Address | The IP address associated with the activity, if applicable. |
| Actions | A set of actions to take on the activity (usually links to more info). |
There are several different types of activity that can appear in the activity log:
| Activity Type | Description |
|---|---|
| Error | Error messages, such as failing to send e-mail or server clocks out of sync. |
| Warning | Warning messages, such as a failure to launch a scheduled event. |
| API Key | API Key related activity, such as a user creating, modifying or deleting keys. |
| Category | Category related activity, such as a user creating, modifying or deleting categories. |
| Event | Event related activity, such as a user creating, modifying or deleting events. |
| Group | Server Group related activity, such as a user creating, modifying or deleting groups. |
| Job | Job related activity, including every job completion (success or fail). |
| Plugin | Plugin related activity, such as a user creating, modifying or deleting Plugins. |
| Server | Multi-Server related activity, such as servers being added or removed from the cluster. |
| Scheduler | Scheduler related activity, such as the scheduler being enabled or disabled. |
| User | User related activity, such as a user being created, modified or deleted. |
Cronicle will keep the latest list_row_max activity log entries in storage (the default is 10,000).
API Keys Tab
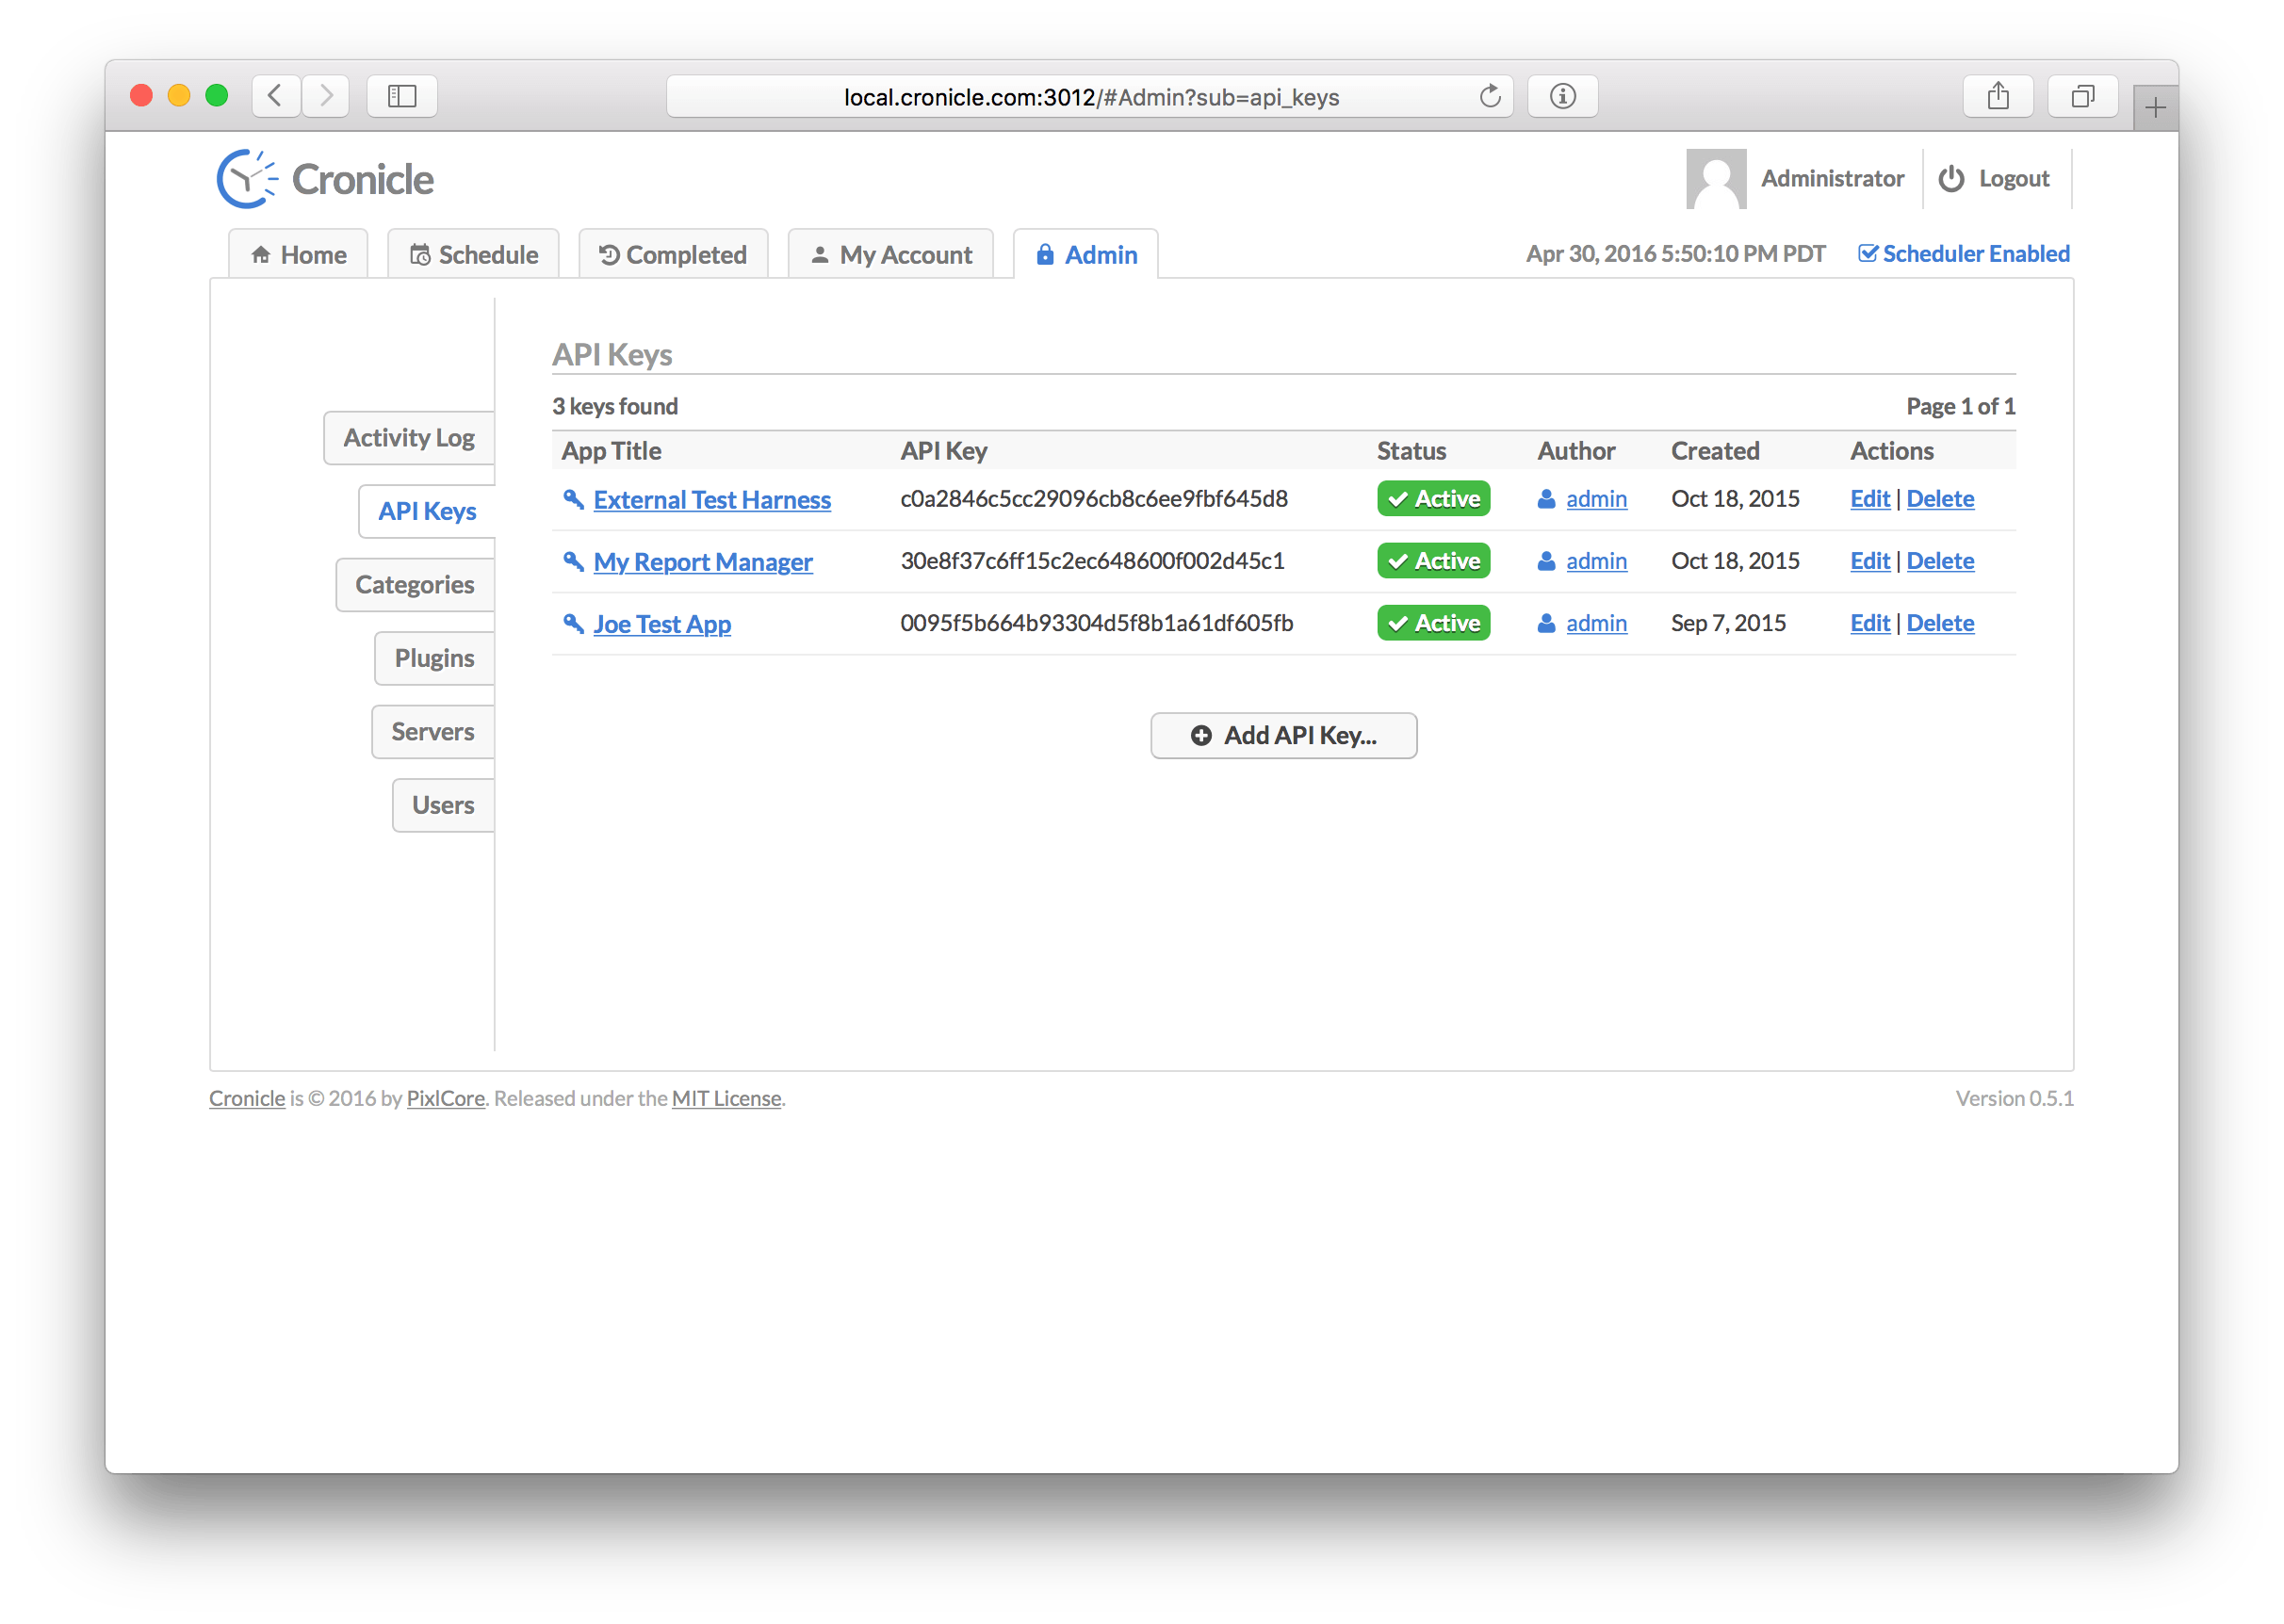
API Keys allow you to register external applications or services to use the REST API. This tab lists all the API Keys registered in the system, and allows you to edit, delete and add new keys. The table columns include:
| Column | Description |
|---|---|
| App Title | The application title associated with the key. |
| API Key | The API Key itself, which is a 32-character hexadecimal string. |
| Status | The status of the key, which can be active or disabled. |
| Author | The username who originally created the key. |
| Created | The date when the key was created. |
| Actions | A list of actions to take (edit and delete). |
When you create or edit a key, you will see this screen:
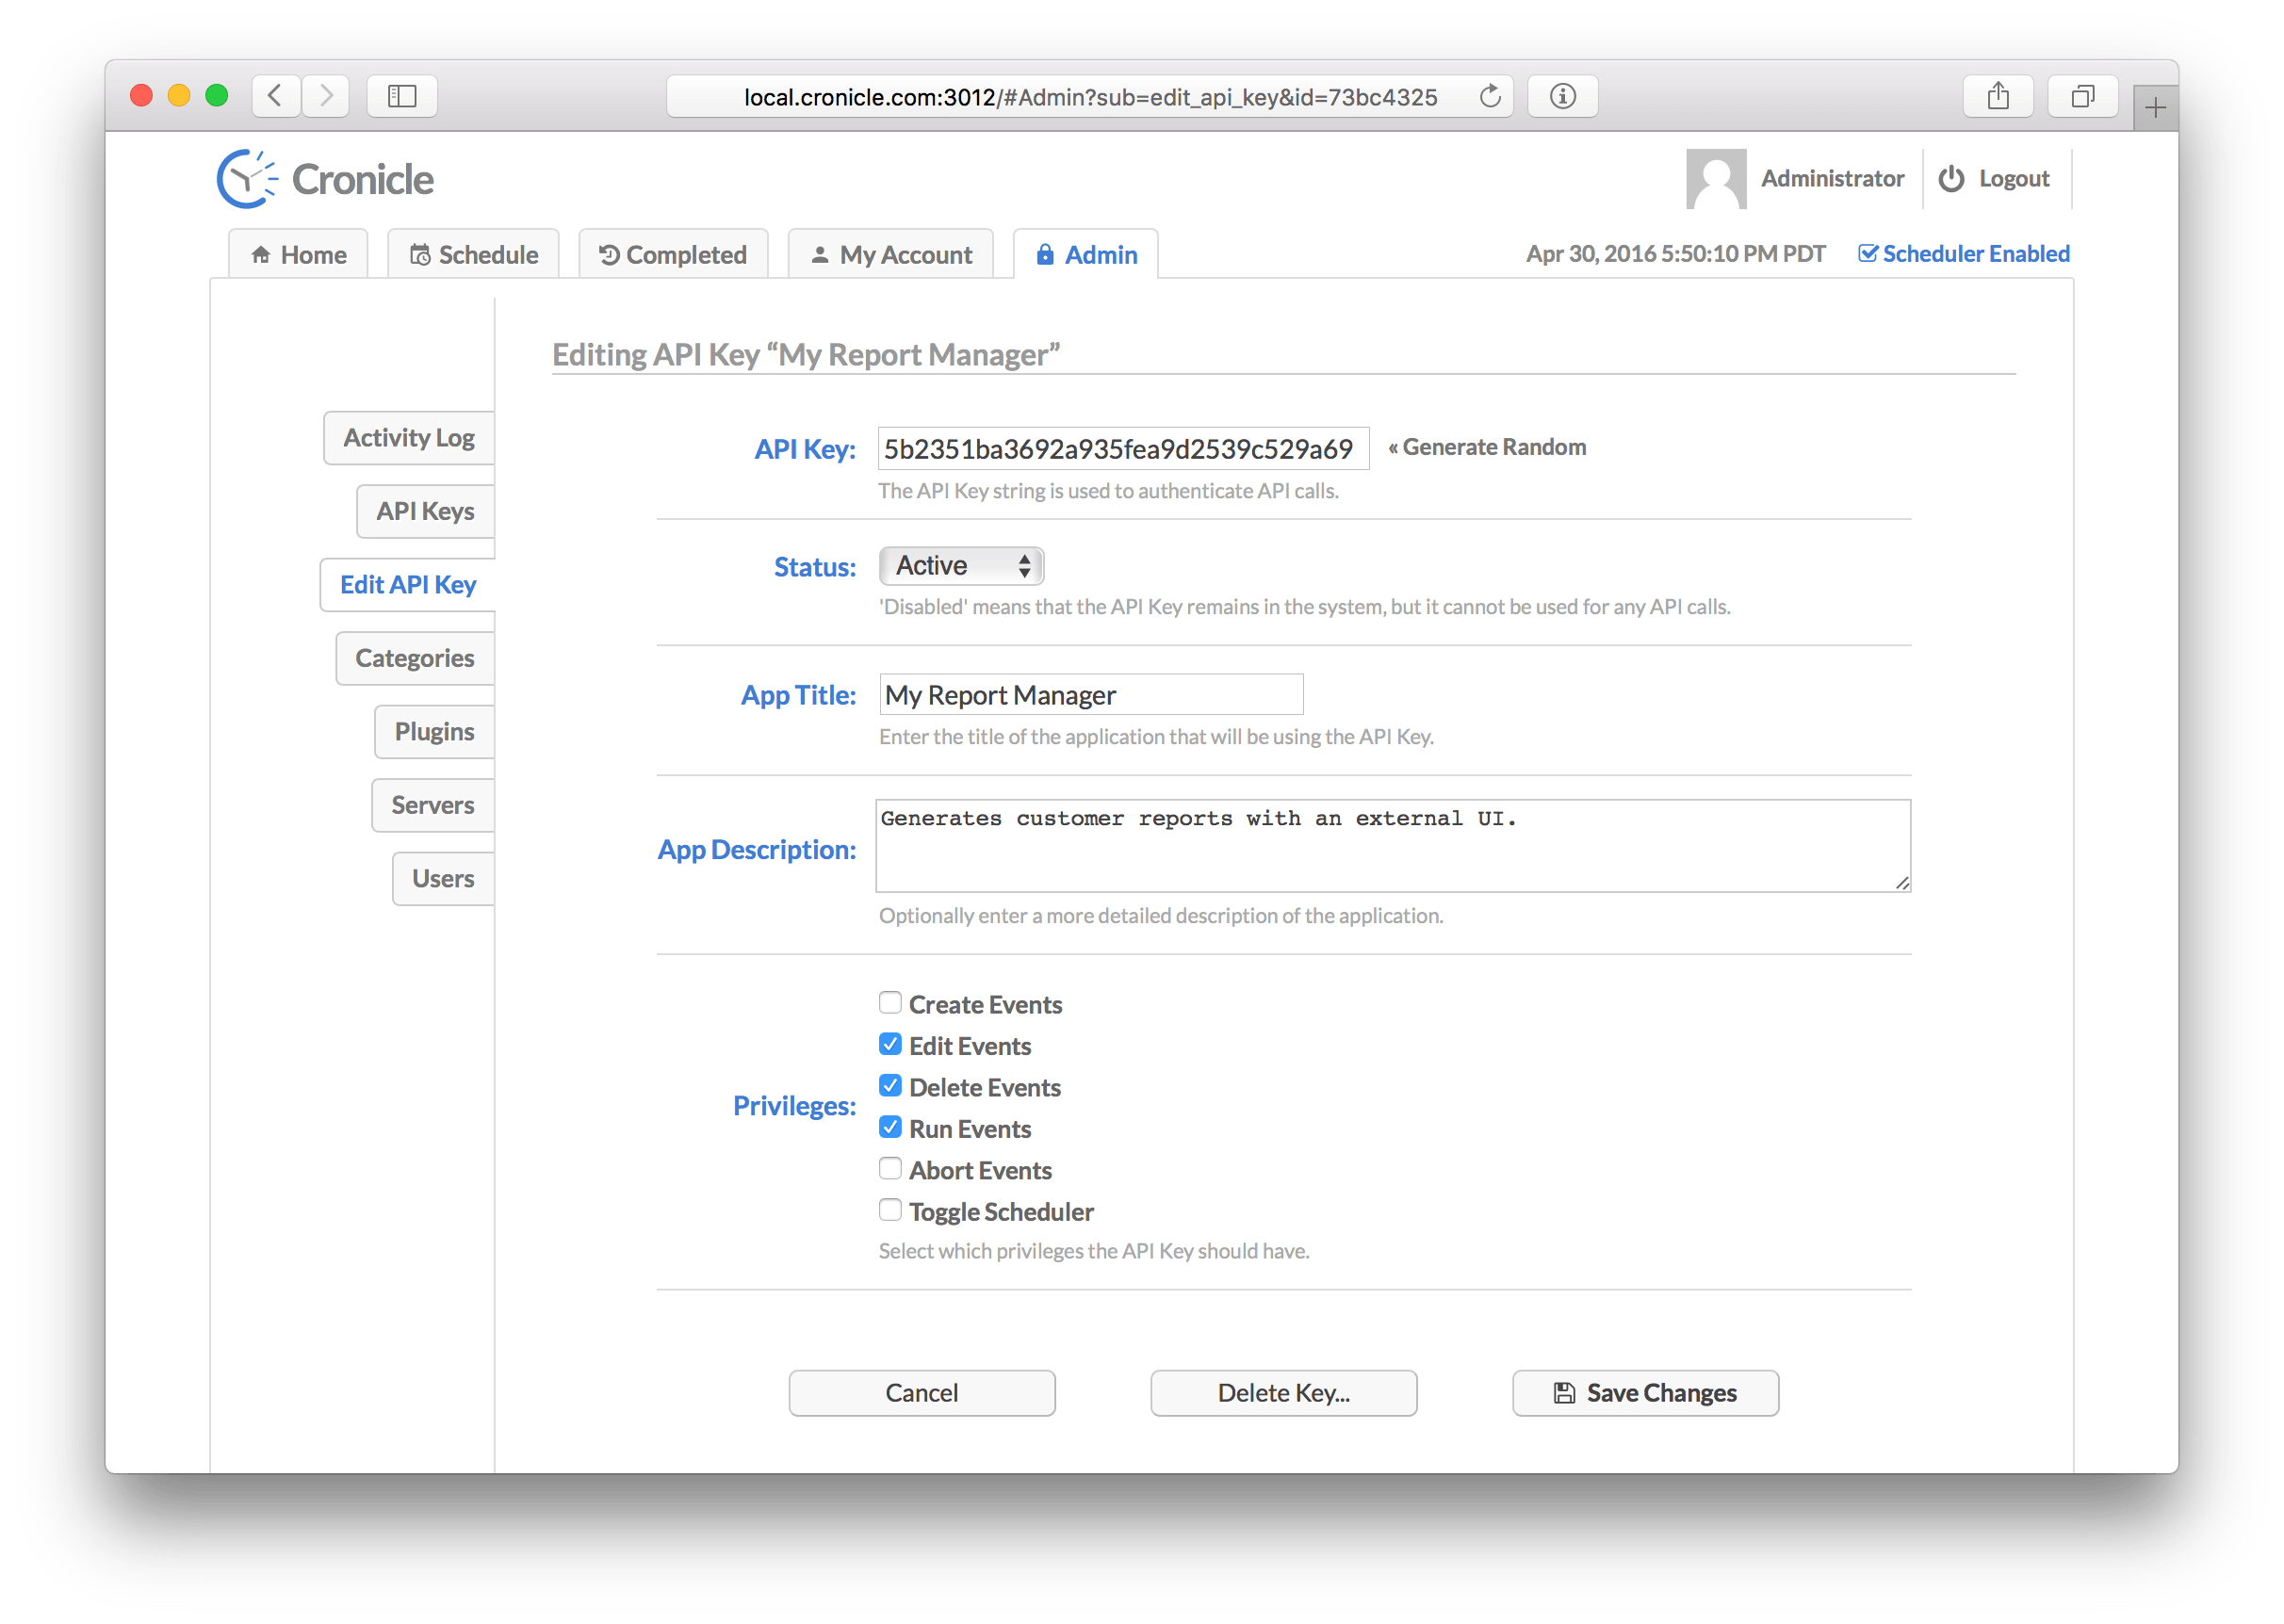
The API Key form contains the following elements:
- The API Key itself, which is an automatically generated 32-character hexadecimal string. You can manually customize this if desired, or click Generate Random to generate a new random key.
- The Status which is either
ActiveorDisabled. Disable an API Key if you have a misbehaving app or an exposed key, and all API calls will be rejected. Only active keys are allowed to make any calls. - The App Title which is the name of your app that will be using the key. This is displayed in various places including the activity log.
- An App Description which is an optional verbose description of your app, just so other users can understand what the purpose of each API key is.
- A set of Privileges, which grant the API Key access to specific features of Cronicle. This is the same system used to grant user level permissions.
For more details on how to use the API Key system in your apps, see the API Keys section below.
Categories Tab
Events can be assigned to custom categories that you define. This is a great way to enable/disable groups of events at once, set a maximum concurrent job limit for the entire category, set default notification and resource limits, and highlight events with a specific color.
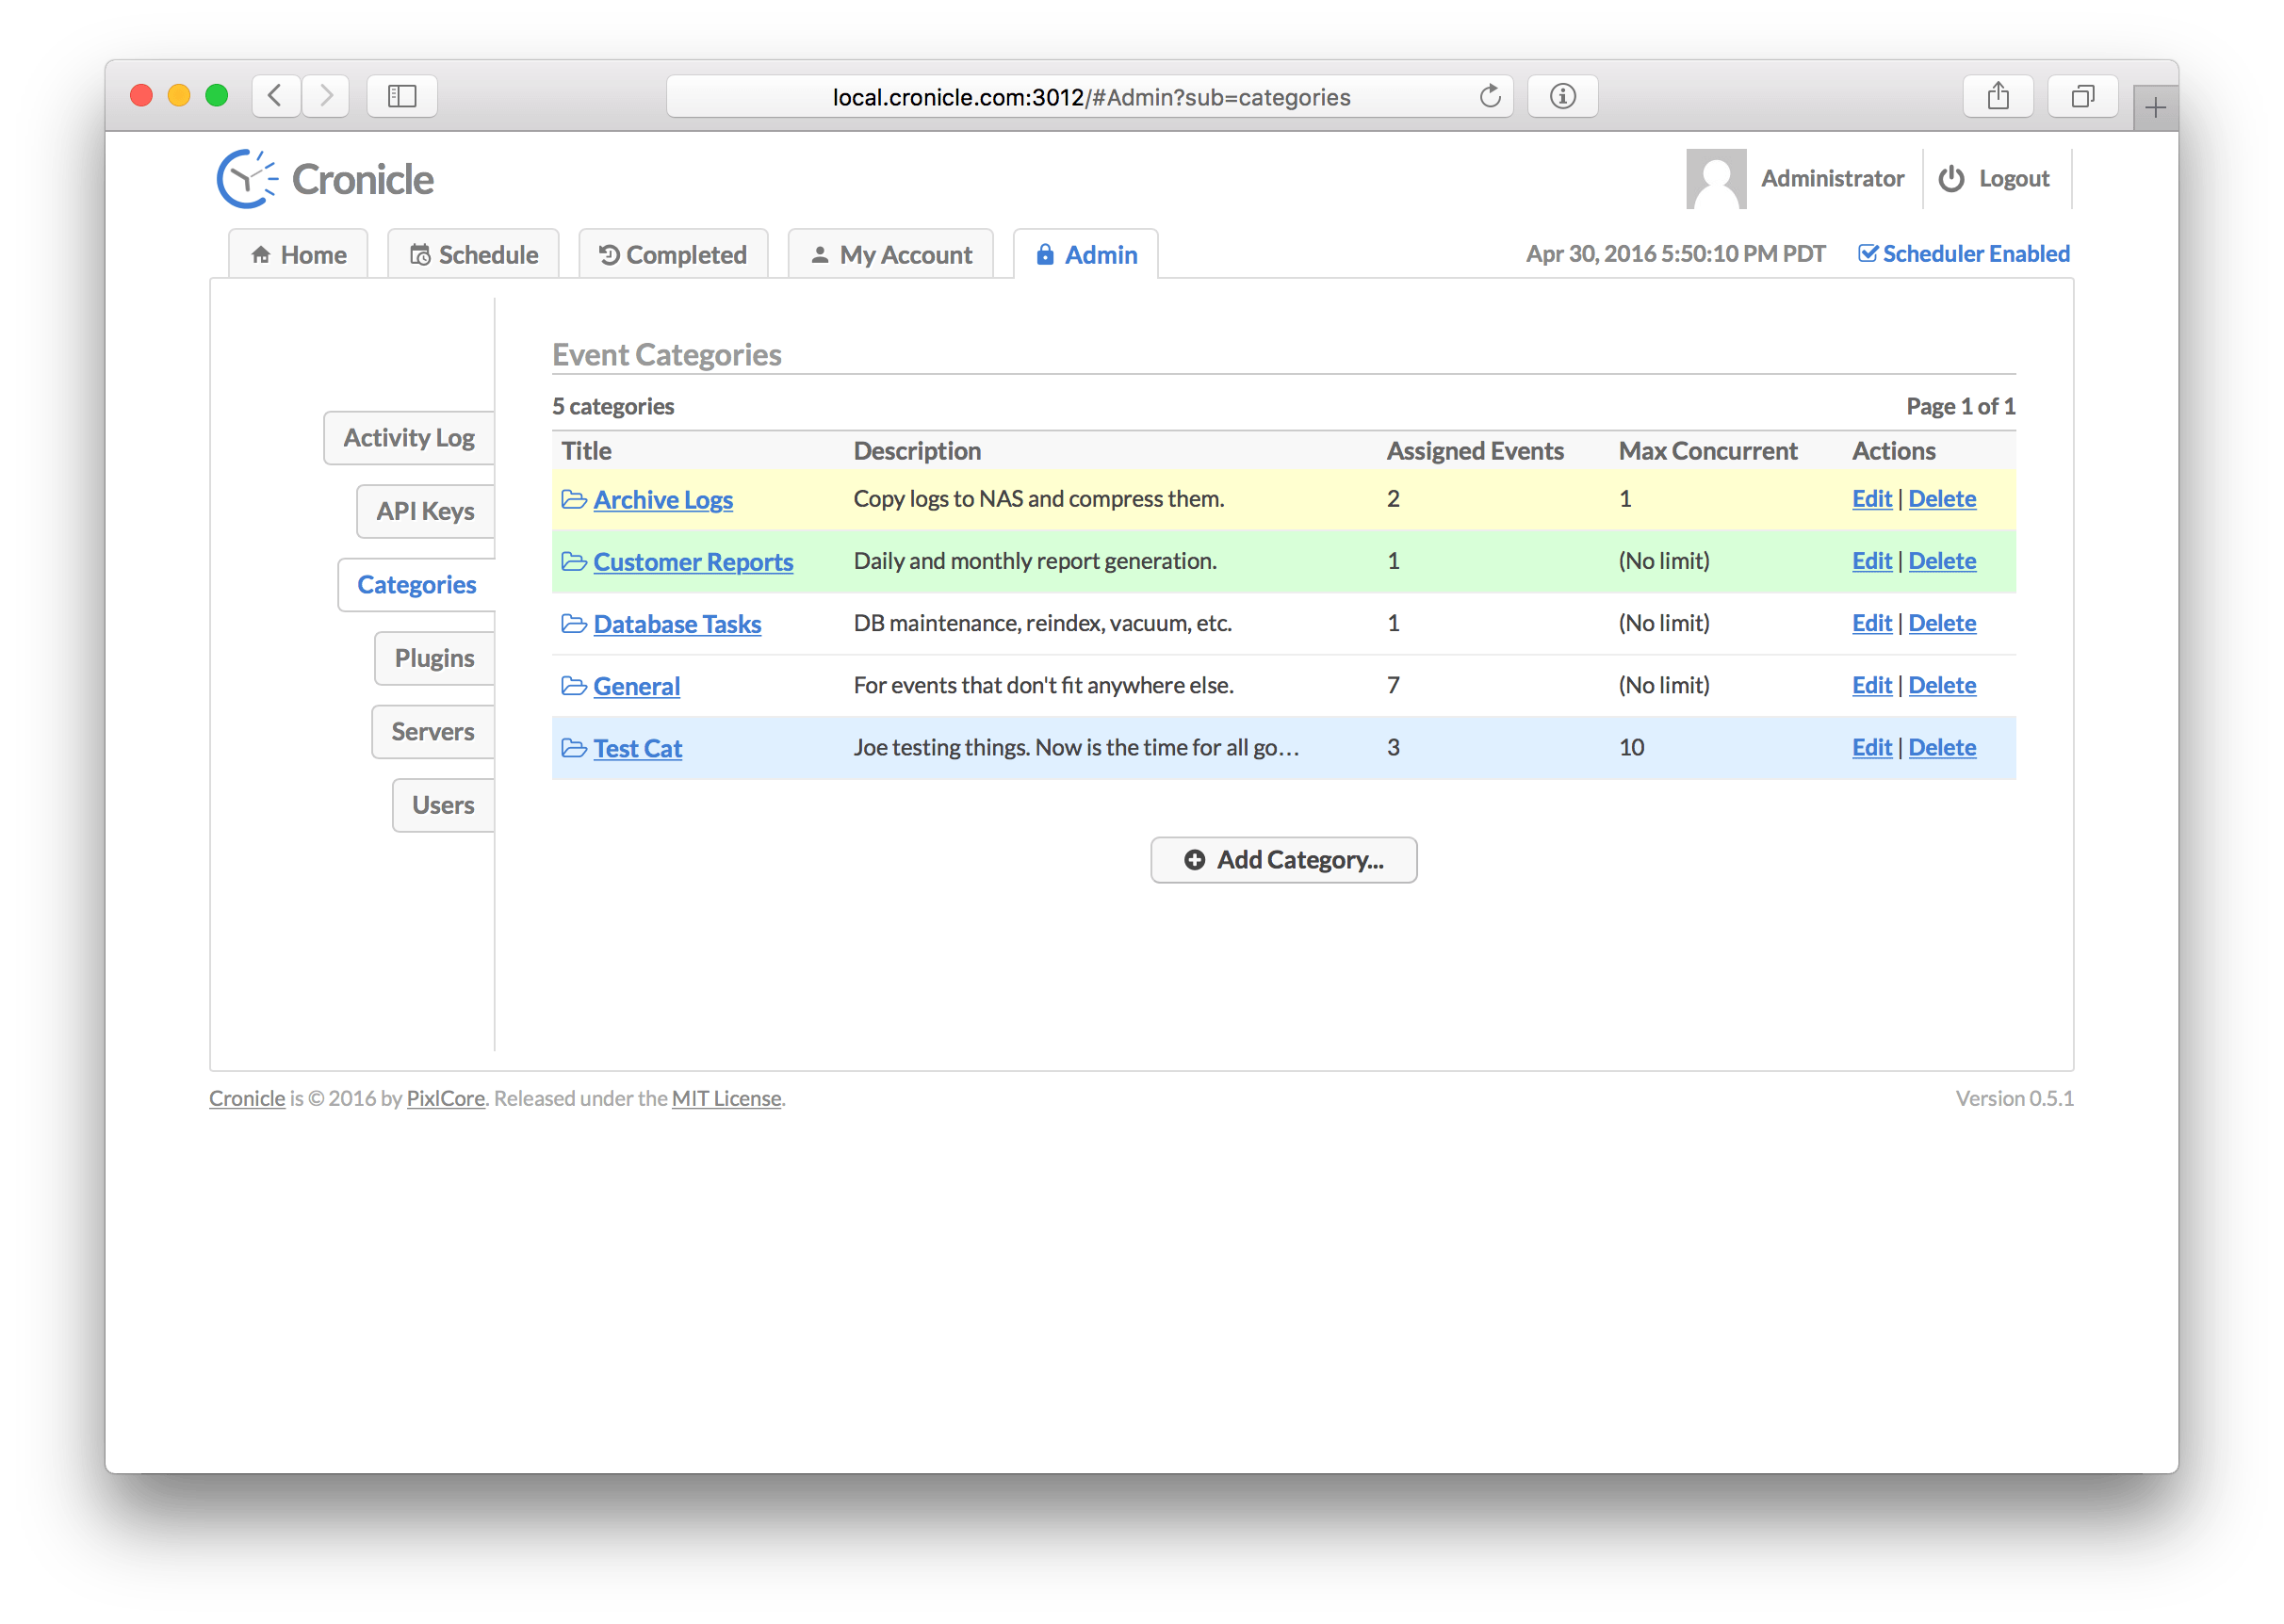
On this screen is the list of all event categories. The table columns are as follows:
| Column | Description |
|---|---|
| Title | The title of the category, used for display purposes. |
| Description | An optional description of the category. |
| Assigned Events | The number of events assigned to the category. |
| Max Concurrent | The maximum number of concurrent jobs to allow. |
| Actions | A list of actions to take (edit and delete). |
When you create or edit a category, you are taken to this screen:
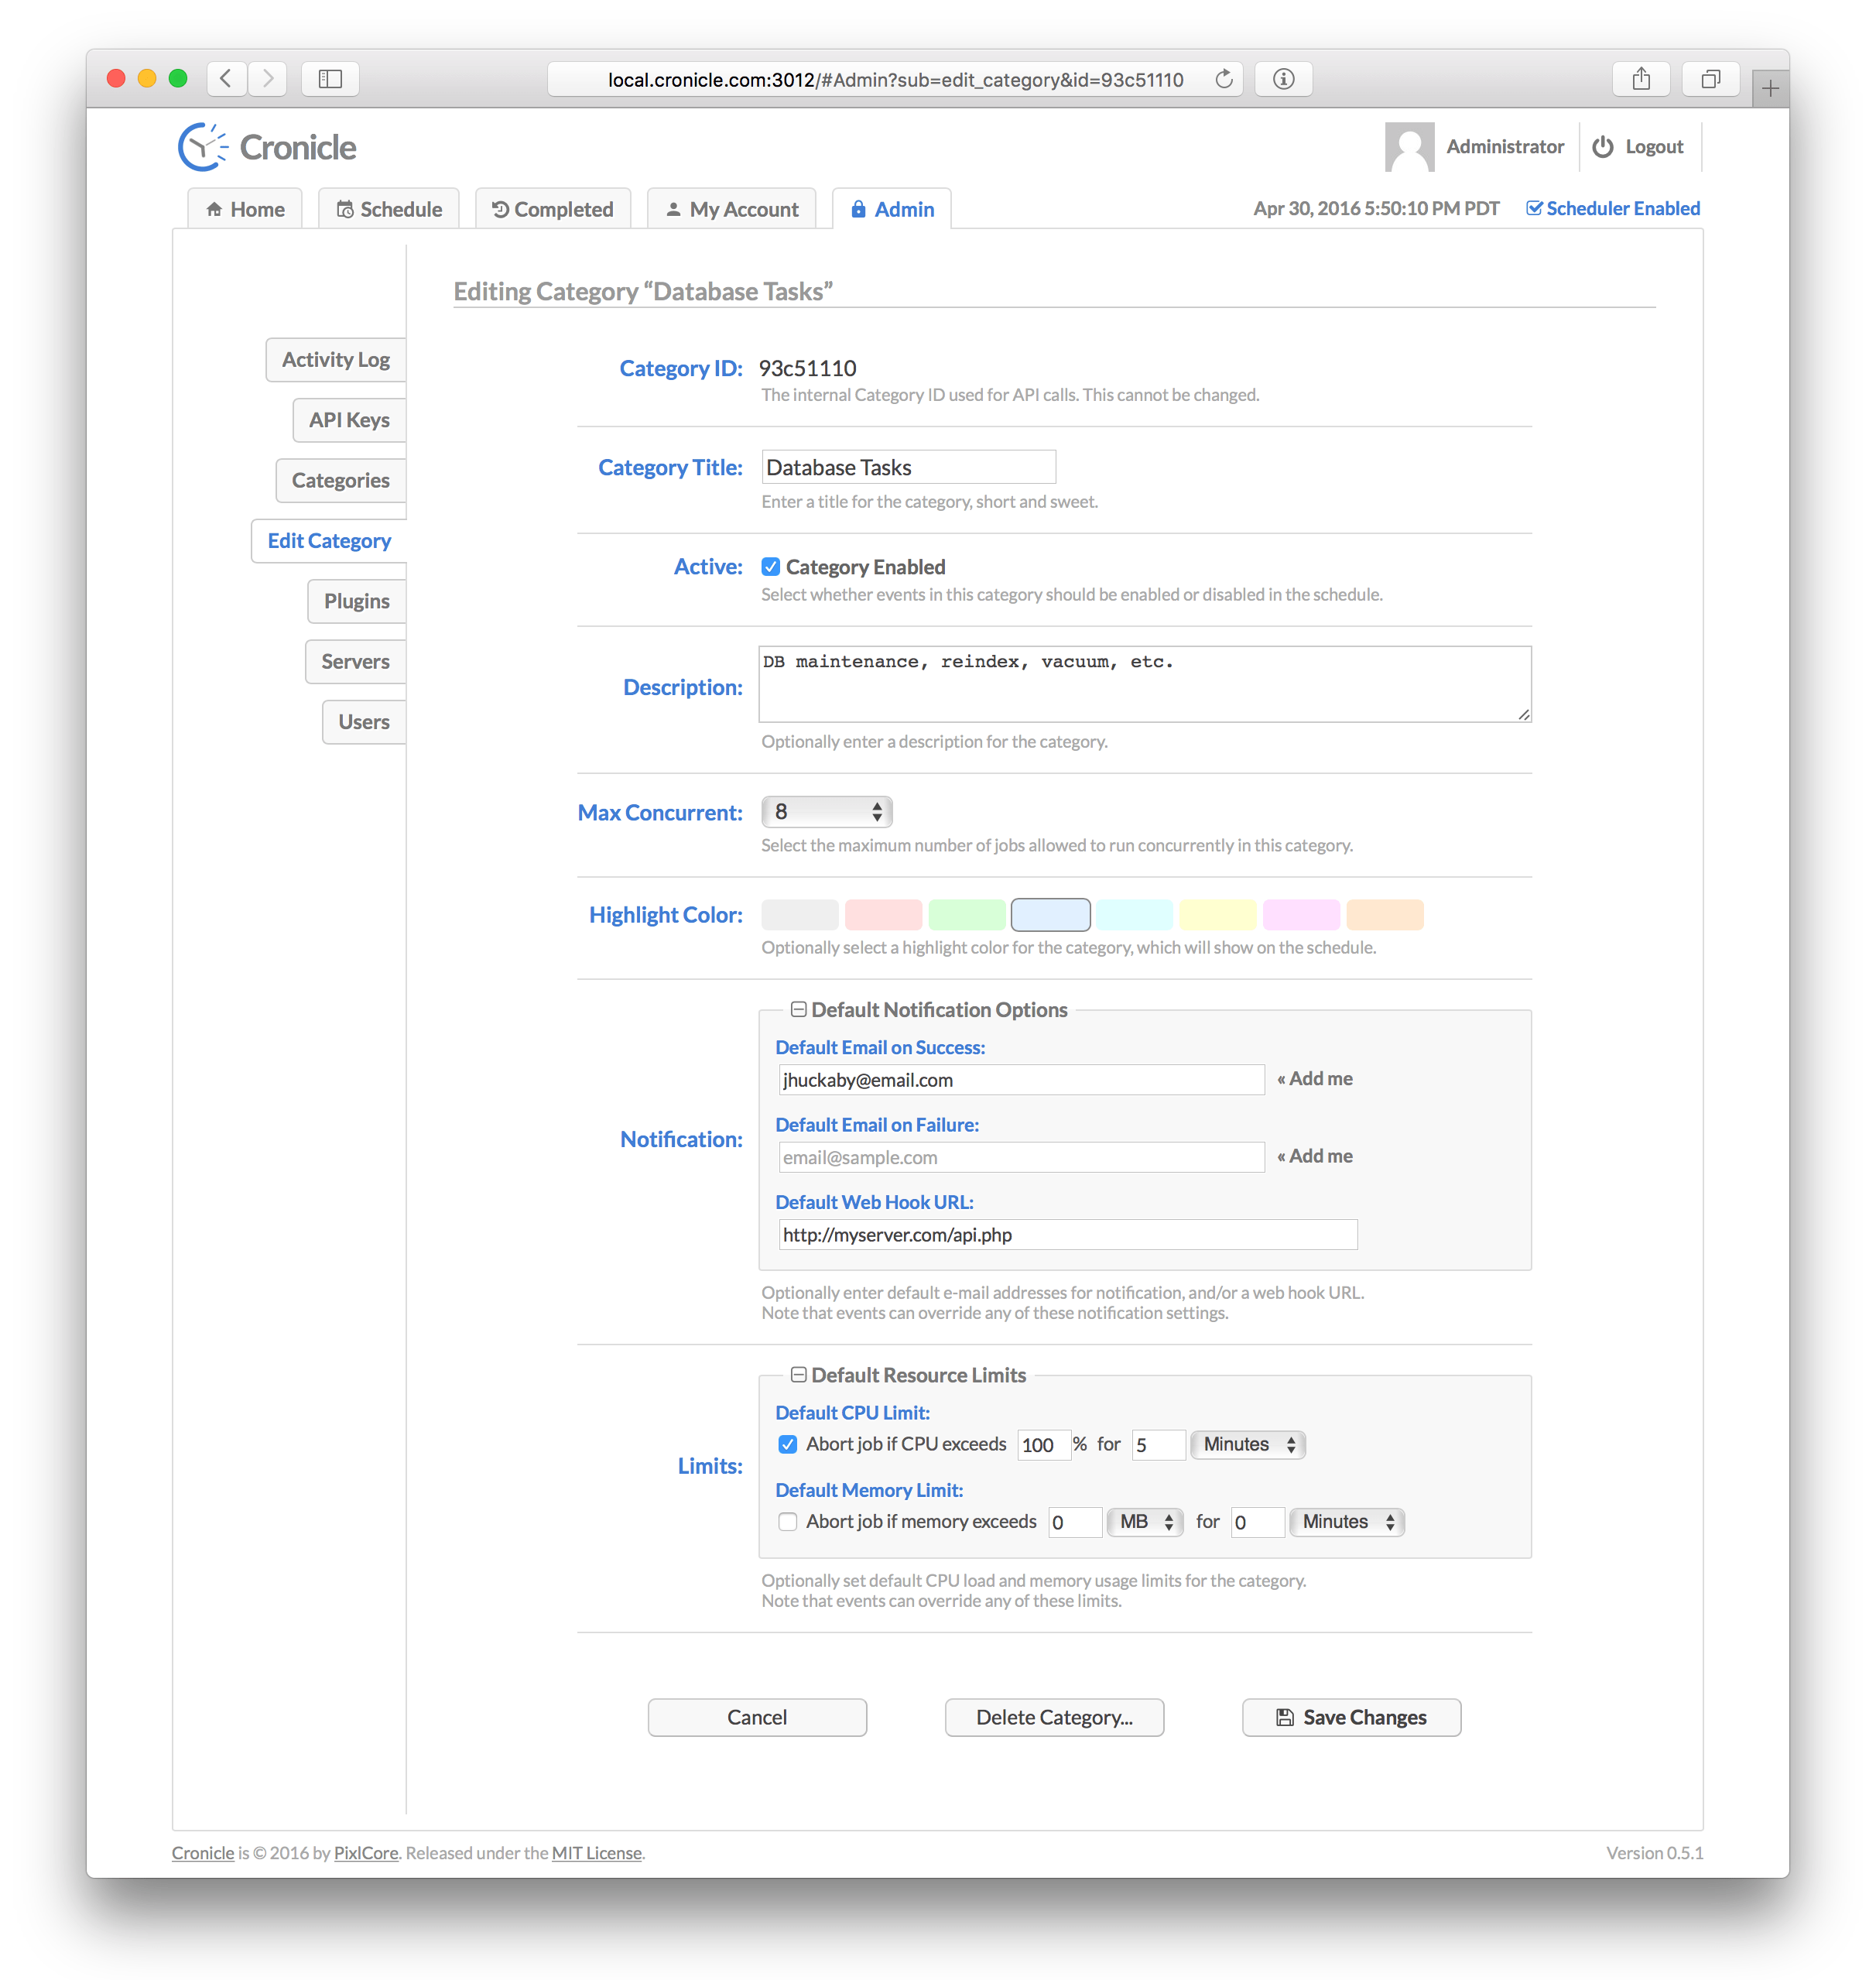
The category edit form contains the following elements:
- The Category ID which is an auto-generated alphanumeric ID used only by the API. This cannot be changed.
- The Category Title which is used for display purposes.
- The Status which controls whether the category is active or disabled. This also affects all events assigned to the category, meaning if the category is disabled, all the events assigned to it will also be effectively disabled as well (the scheduler won't start jobs for them).
- An optional Description of the category, for your own use.
- A Max Concurrent selector, which allows you to set the maximum allowed jobs to run concurrently across all events in the category. This is not a default setting that is applied per event, but rather a total overall limit for all assigned events.
- An optional Highlight Color which is displayed as the background color on the main Schedule Tab for all events assigned to the category.
- A set of Default Notification Options, which include separate e-mail lists for successful and failed jobs, and a default Web Hook URL. These settings may be overridden per each event.
- A set of Default Resource Limits, which include separate CPU and Memory limits. Note that these are measured per job, and not as a category total. These settings may be overridden per each event (see Event Resource Limits for more details).
Plugins Tab
Plugins are used to run jobs, and can be written in virtually any language. They are spawned as sub-processes, launched via a custom command-line script that you provide. Communication is achieved via reading and writing JSON to STDIN / STDOUT. For more details, see the Plugins section below.
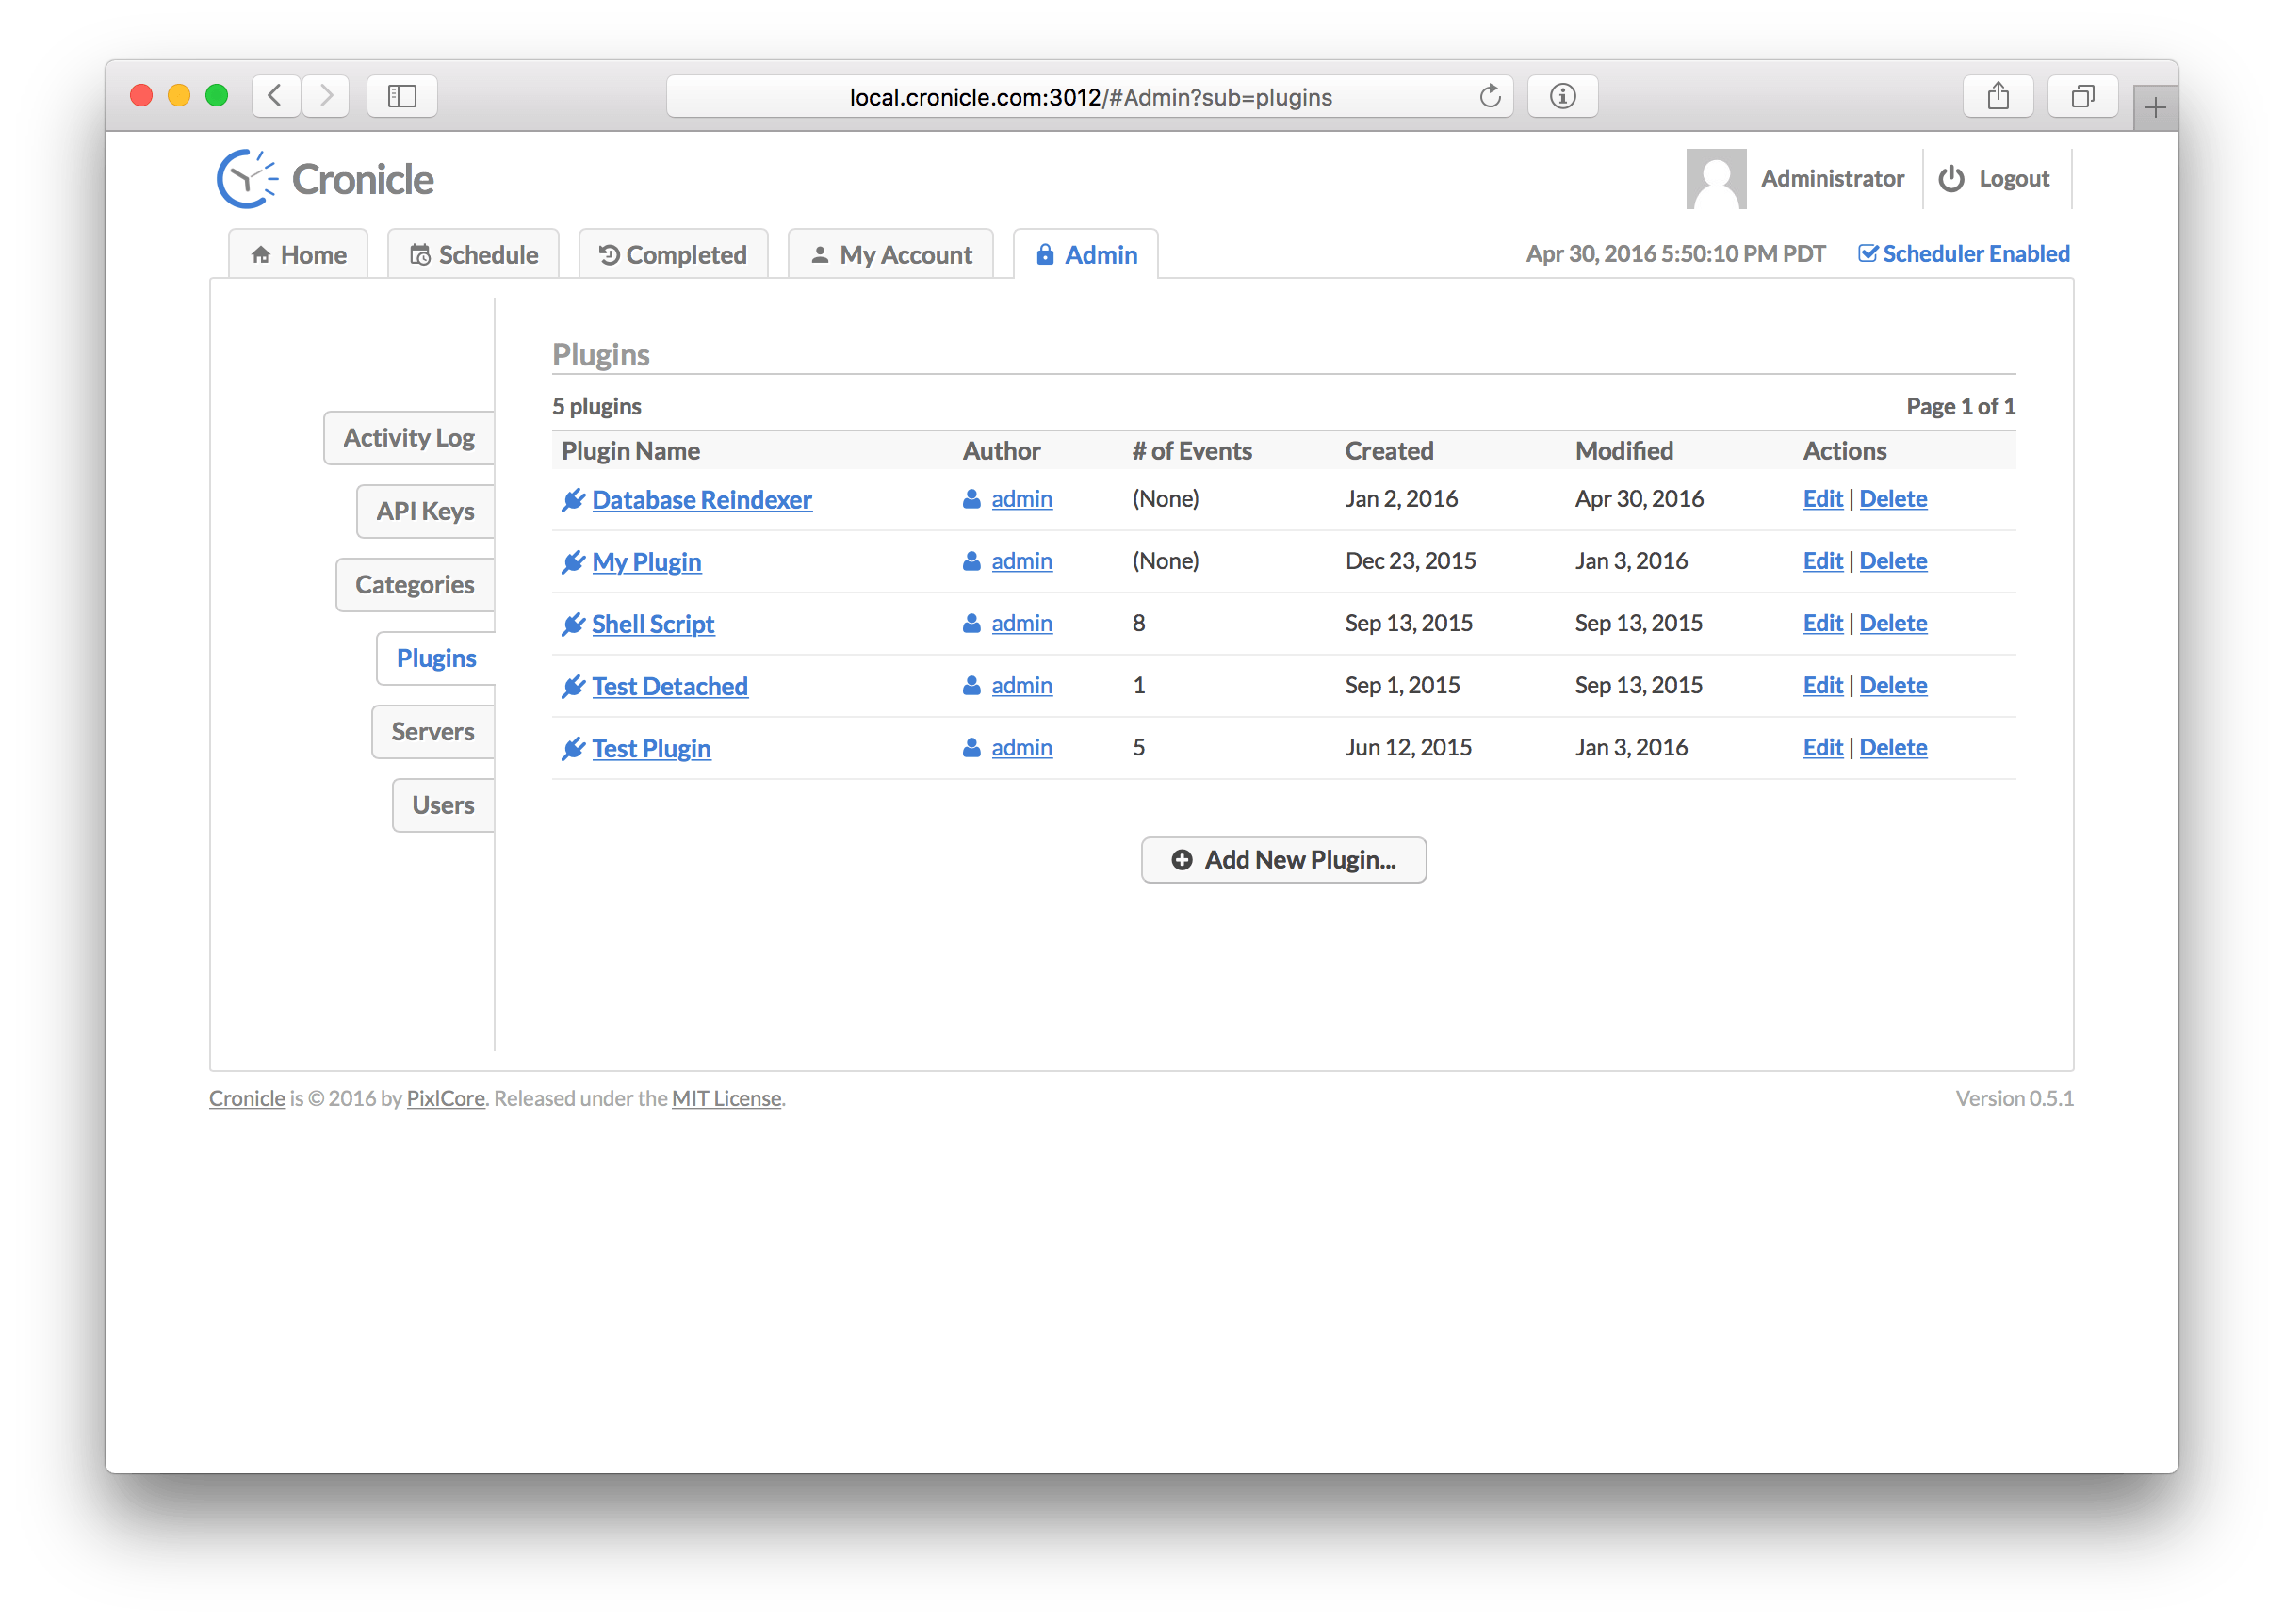
On this screen you'll find a list of all the Plugins registered in the system. The table columns are as follows:
| Column | Description |
|---|---|
| Plugin Name | The name of the Plugin, used for display purposes. |
| Author | The username of the user who originally created the Plugin. |
| Number of Events | The number of events using the Plugin. |
| Created | The date when the Plugin was first created. |
| Modified | The date when the Plugin was last modified. |
| Actions | A list of actions to take (edit and delete). |
When you create or edit a Plugin, you are taken to this screen:
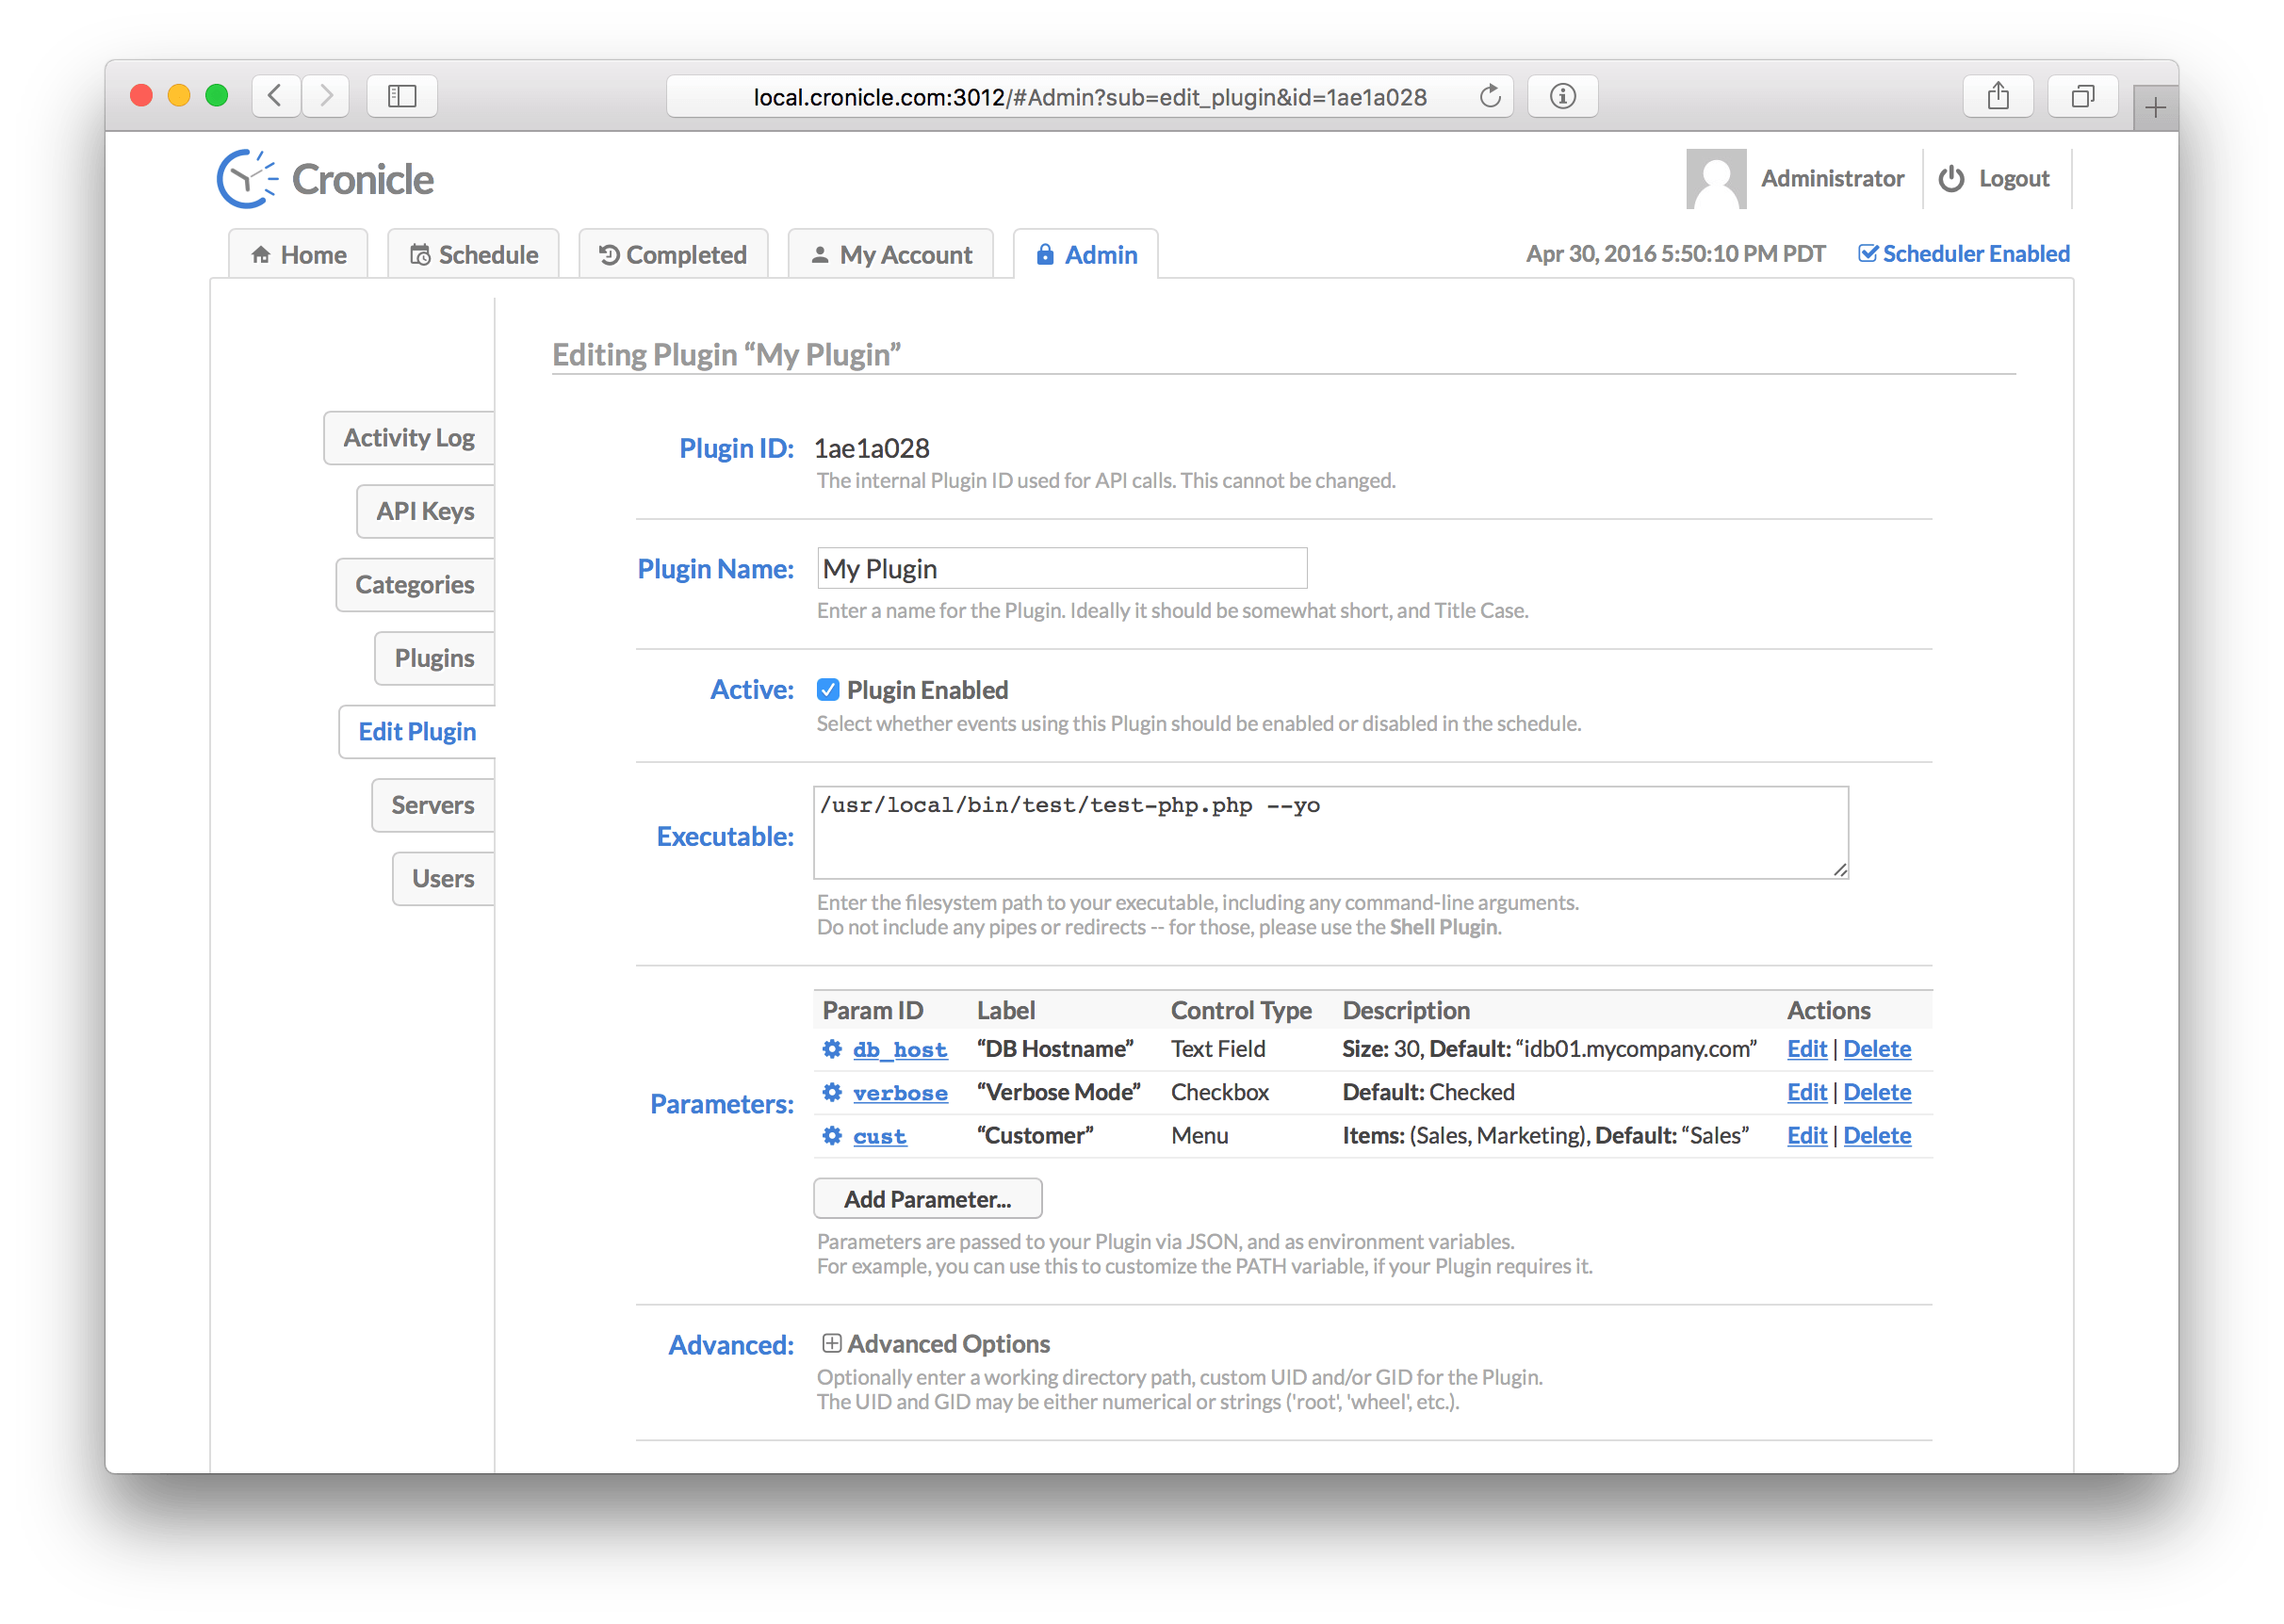
The Plugin edit form contains the following elements:
- The Plugin ID which is an auto-generated alphanumeric ID used only by the API. This cannot be changed.
- The Plugin Name which is used for display purposes.
- The Status which controls whether the Plugin is active or disabled. This also affects all events assigned to the Plugin, meaning if the Plugin is disabled, all the events assigned to it will also be effectively disabled as well (the scheduler won't start jobs for them).
- The Executable path, which is executed in a sub-process to run jobs. You may include command-line arguments here if your Plugin requires them, but no shell redirects or pipes (see the Shell Plugin if you need those).
- A set of custom Parameters which you can define here, and then edit later for each event. These parameters are then passed to your Plugin when jobs run. See below for details.
- A set of Advanced Options, including customizing the working directory, and user/group (all optional). See below for details.
Plugin Parameters
The Parameter system allows you to define a set of UI controls for your Plugin (text fields, text boxes, checkboxes, drop-down menus, etc.) which are then presented to the user when editing events. This can be useful if your Plugin has configurable behavior which you want to expose to people creating events in the schedule. Each Parameter has an ID which identifies the user's selection, and is included in the JSON data sent to your Plugin for each job.
When adding or editing Plugin Parameters, you will be presented with this dialog:
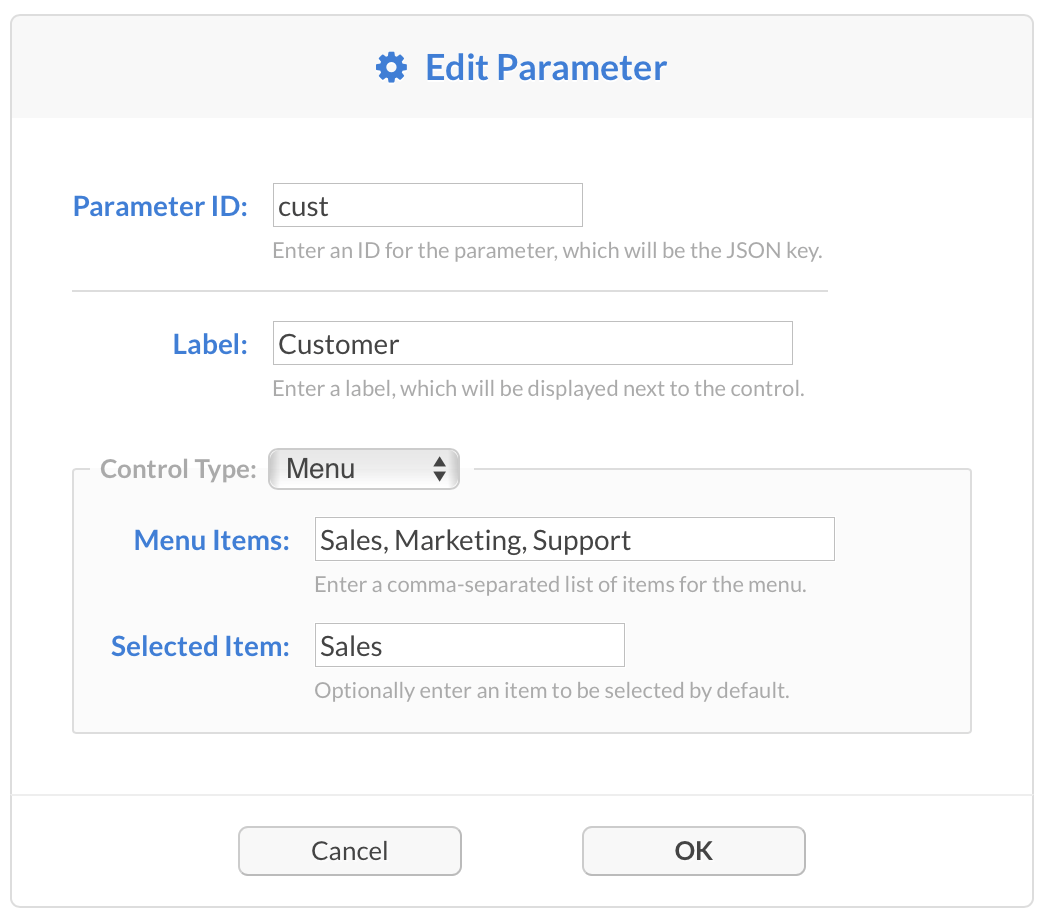
Here you will need to provide:
- A Parameter ID which uniquely identifies the parameter in the JSON data sent to your Plugin.
- A Label for display purposes (used in the UI only).
- A Control Type selection, which can be a text field, a text box, a checkbox, a drop-down menu, or a hidden variable.
Depending on the control type selected, you may need to provide different pieces of information to render the control in the UI, such as a comma-separated list of values for a menu, a default text field value and size, etc.
Parameter values for each event are passed to your Plugin when jobs are launched. These arrive as a JSON object (located in params), as well as upper-case environment variables. So for example, you can use Plugin Parameters to set custom environment variables for your jobs, or override existing ones such as PATH. Example of this:
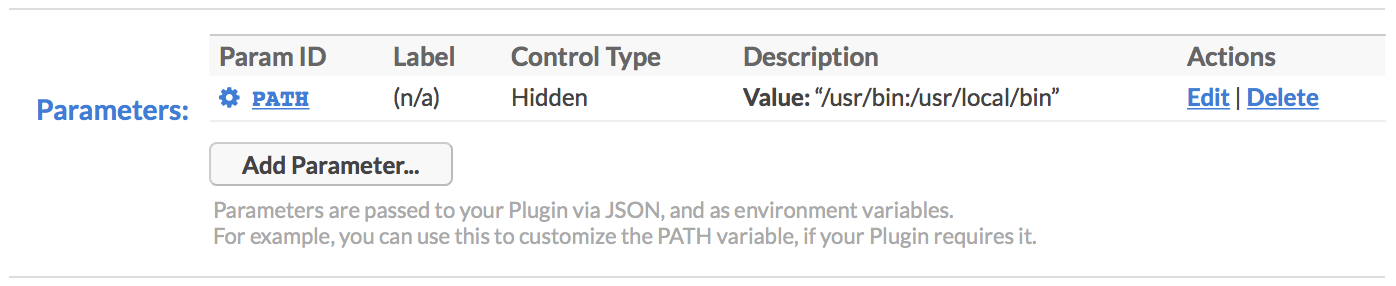
For more details on how to use these parameters in your Plugin code, see the Plugins section below.
Advanced Plugin Options
The Advanced options pane expands to the following:
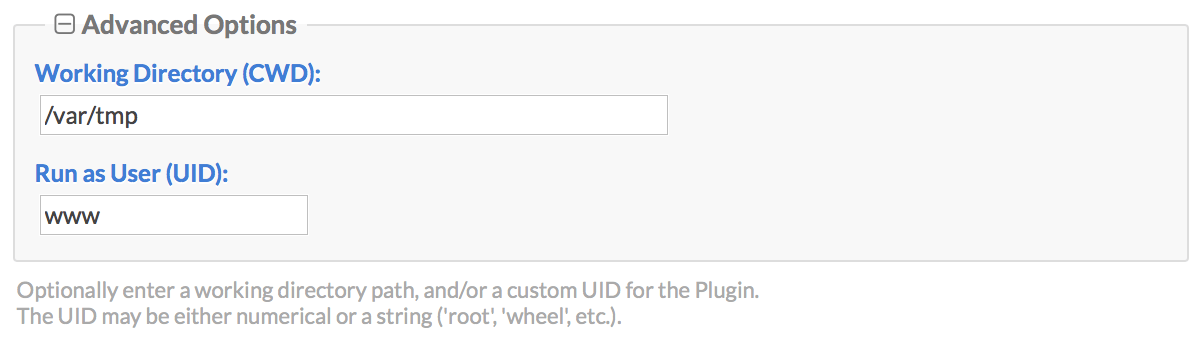
Here you can customize the following settings:
| Option | Description |
|---|---|
| Working Directory | This is the directory path to set as the current working directory when your jobs are launched. It defaults to the Cronicle base directory (/opt/cronicle). |
| Run as User | You can optionally run your jobs as another user by entering their UID here. A username string is also acceptable (and recommended, as UIDs may differ between servers). |
Servers Tab
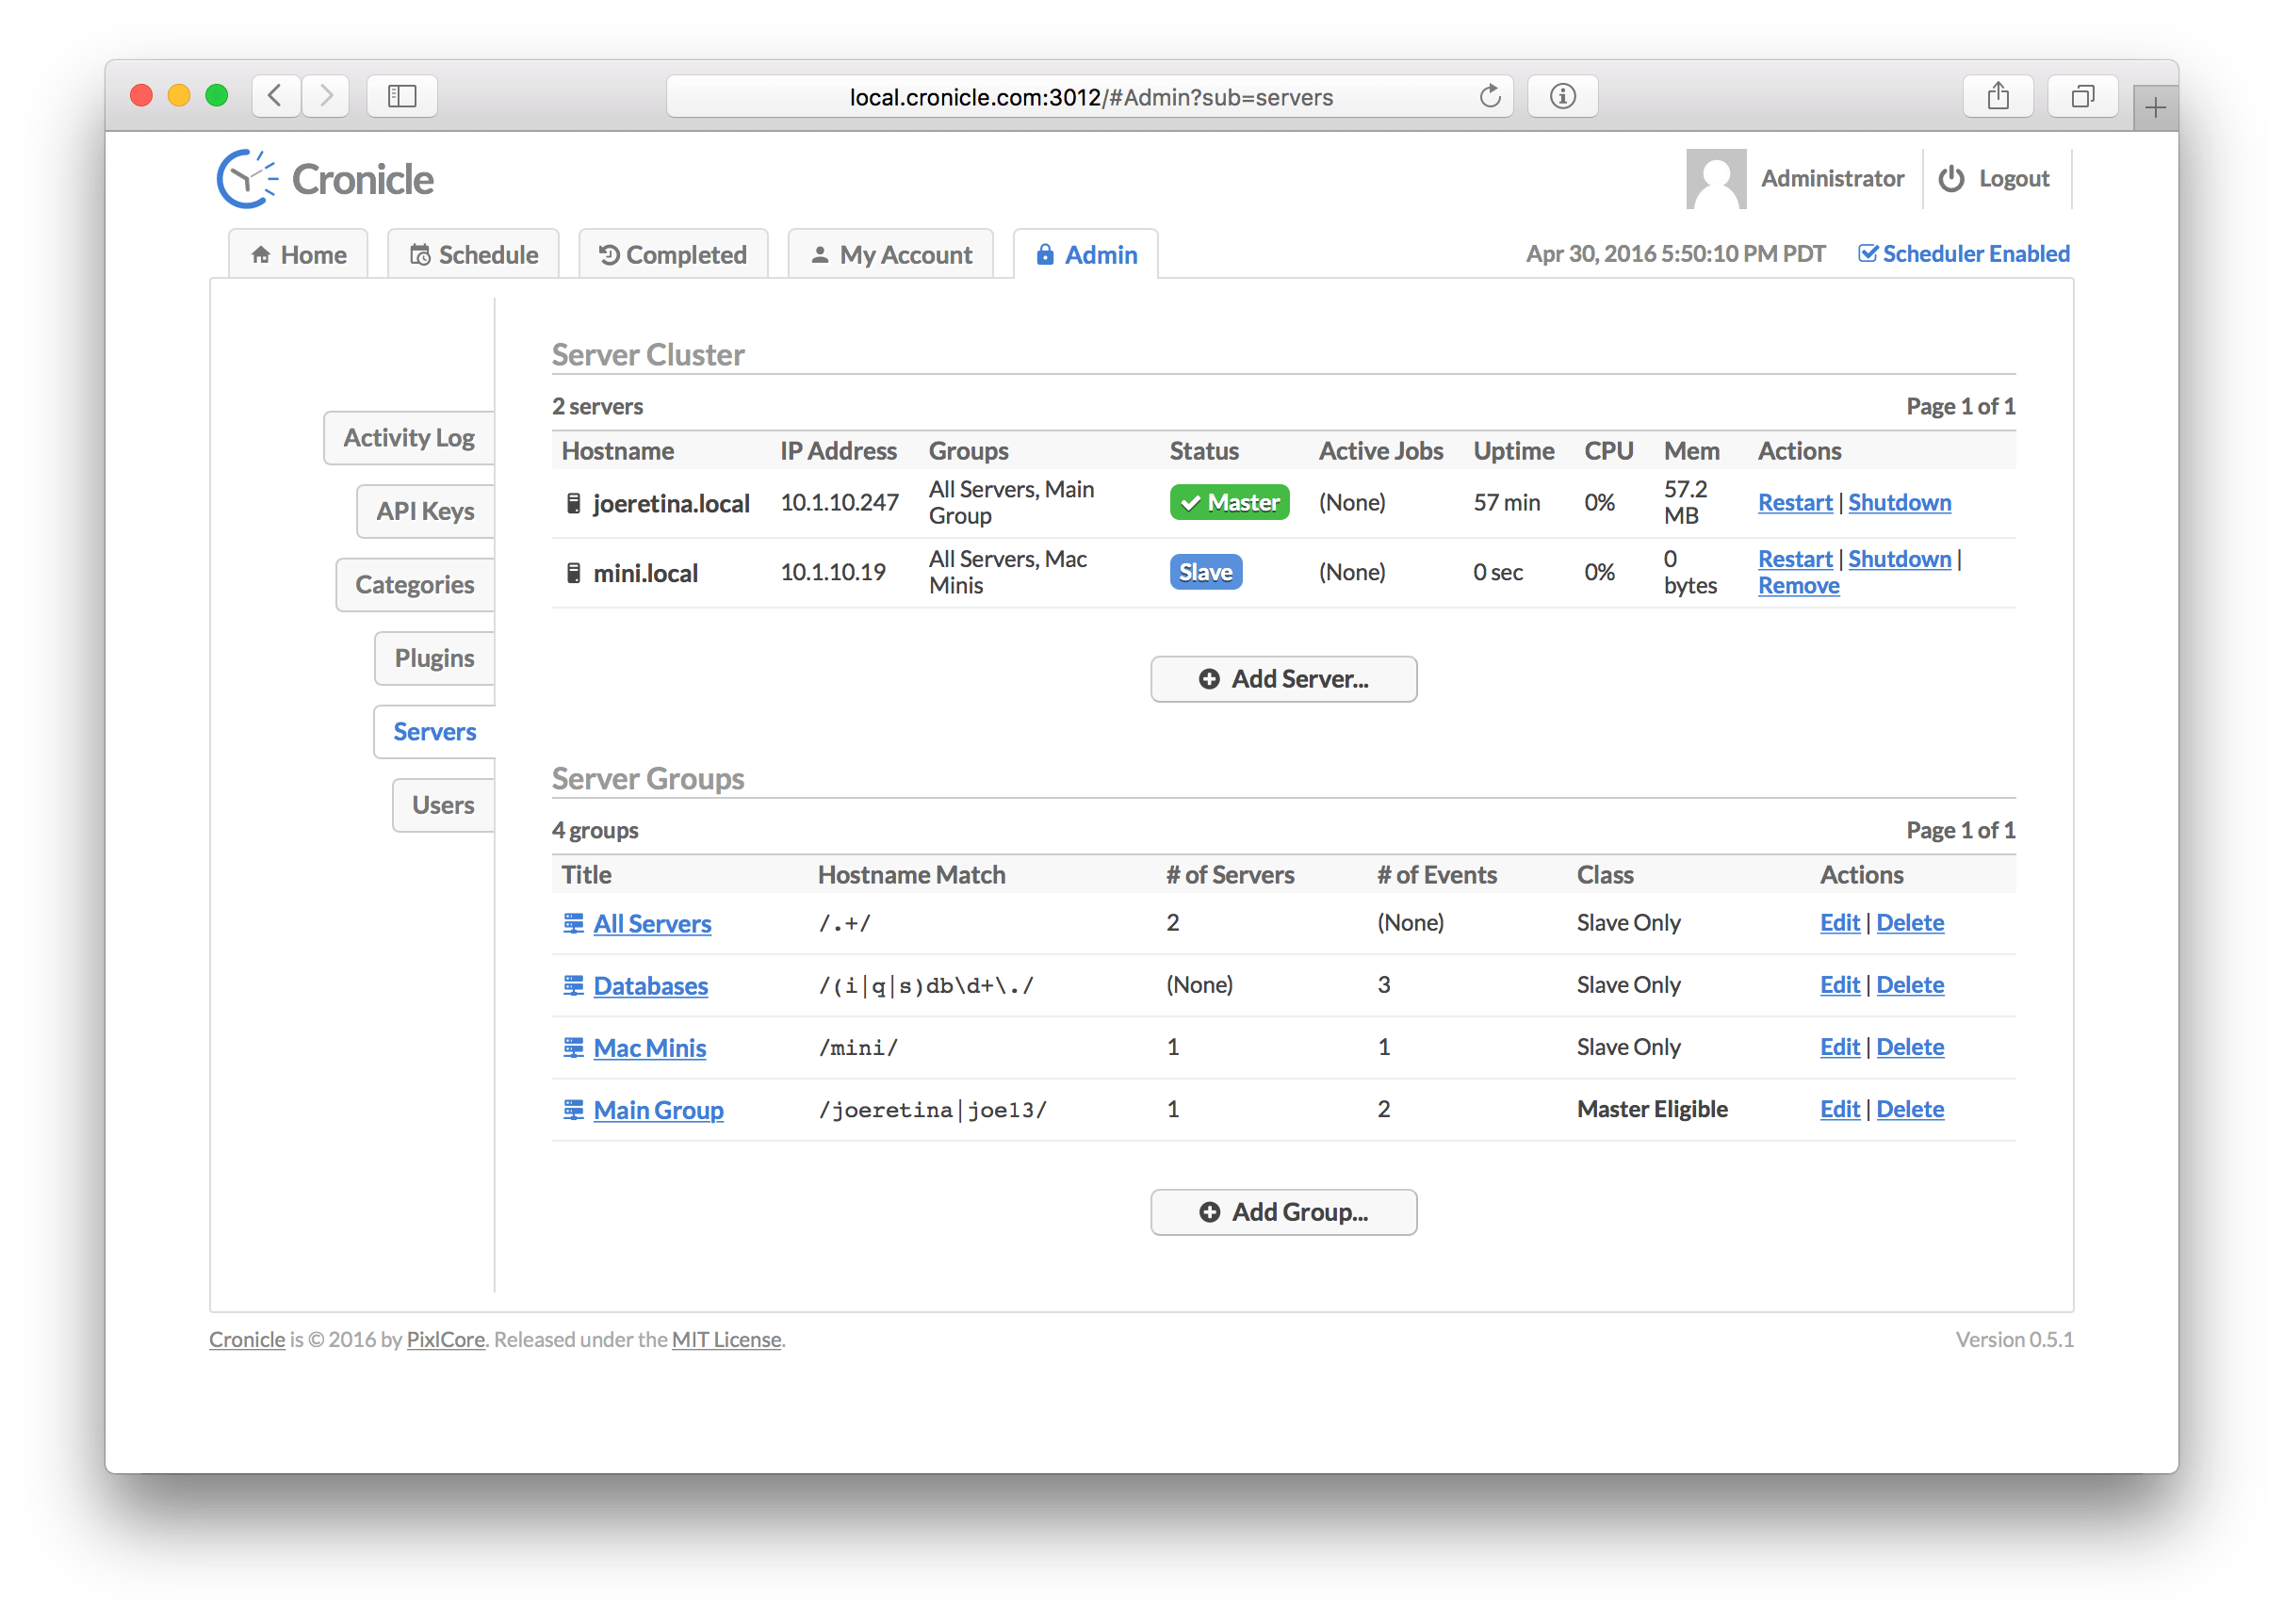
When Cronicle is configured to run in a multi-server environment, this tab allows you to manage the cluster. At the top of the page you'll see a list of all the servers currently registered, their status, and controls to restart or shut them down. The table columns include:
| Column | Description |
|---|---|
| Hostname | The hostname of the server. |
| IP Address | The IP address of the server. |
| Groups | A list of the groups to which the server belongs. |
| Status | The current server status (primary, backup or worker). |
| Active Jobs | The number of active jobs currently running on the server. |
| Uptime | The elapsed time since Cronicle was restarted on the server. |
| CPU | The current CPU usage on the server (all jobs). |
| Memory | The current memory usage on the server (all jobs). |
| Actions | A list of actions to take (restart and shutdown). |
There is also an Add Server button, but note that servers on the same LAN should be automatically discovered and added to the cluster. You will only need to manually add a server if it lives in a remote location, outside of local UDP broadcast range.
Server Groups
Below the server cluster you'll find a list of server groups. These serve two purposes. First, you can define groups in order to target events at them. For example, an event can target the group of servers instead of an individual server, and one of the servers will be picked for each job (or, if Multiplex is enabled, all the servers at once). Second, you can use server groups to define which of your servers are eligible to become the primary server, if the current primary is shut down.
When Cronicle is first installed, two server groups are created by default. A "Primary Group" which contains only the current (primary) server, and an "All Servers" group, which contains all the servers (current and future). Groups automatically add servers by a hostname-based regular expression match. Therefore, when additional servers join the cluster, they will be assigned to groups automatically via their hostname.
The list of server groups contains the following columns:
| Column | Description |
|---|---|
| Title | The title of the server group. |
| Hostname Match | A hostname regular expression to automatically add servers to the group. |
| Number of Servers | The number of servers currently in the group. |
| Number of Events | The number of events currently targeting the group. |
| Class | The server group classification (whether it supports becoming primary or not). |
| Actions | A list of actions to take (edit and delete). |
When adding or editing a server group, you will be presented with this dialog:
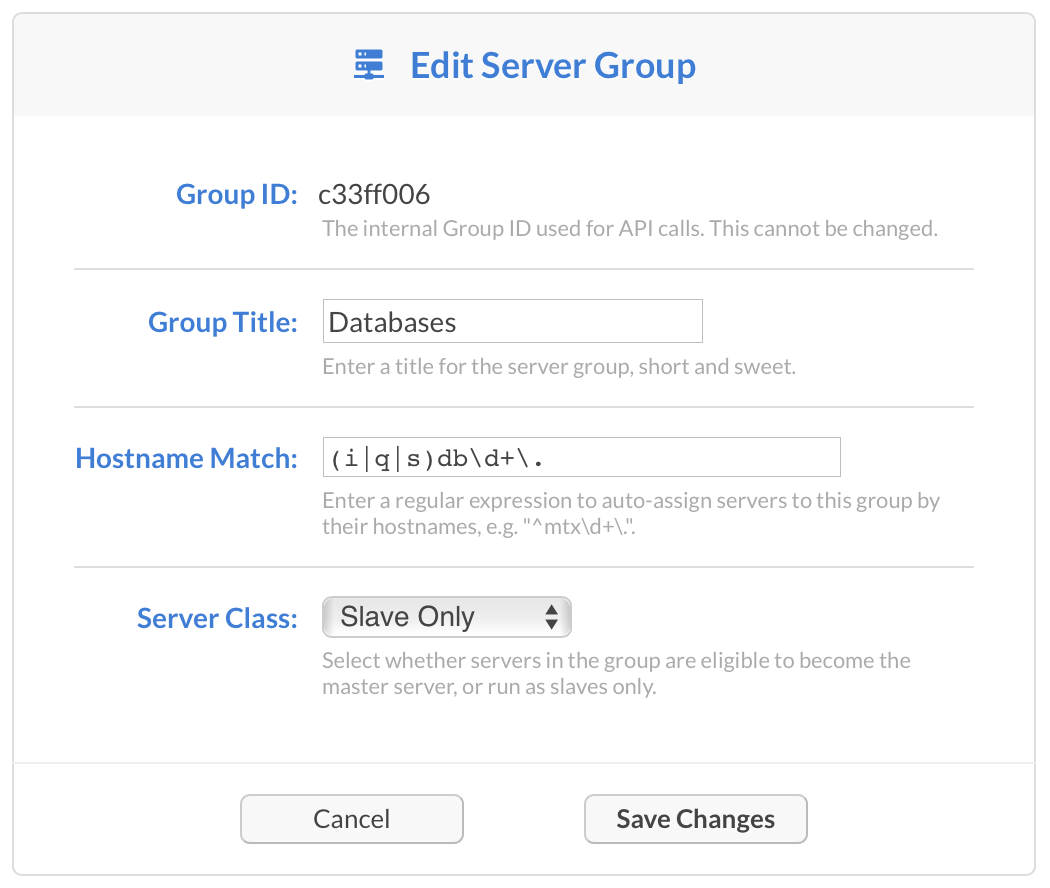
Here you will need to provide:
- A Group Title which is used for display purposes.
- A Hostname Match which is a regular expression applied to every server hostname (used to automatically add servers to the group).
- A Server Class which sets the servers in your group as "Primary Eligible" or "Worker Only".
Note that "Primary Eligible" servers all need to be properly configured and have access to your storage back-end. Meaning, if you opted to use the filesystem, you'll need to make sure it is mounted (via NFS or similar mechanism) on all the servers who could become primary. Or, if you opted to use a NoSQL DB such as Couchbase or S3, they need all the proper settings and/or credentials to connect. For more details, see the Multi-Server Cluster section.
Users Tab
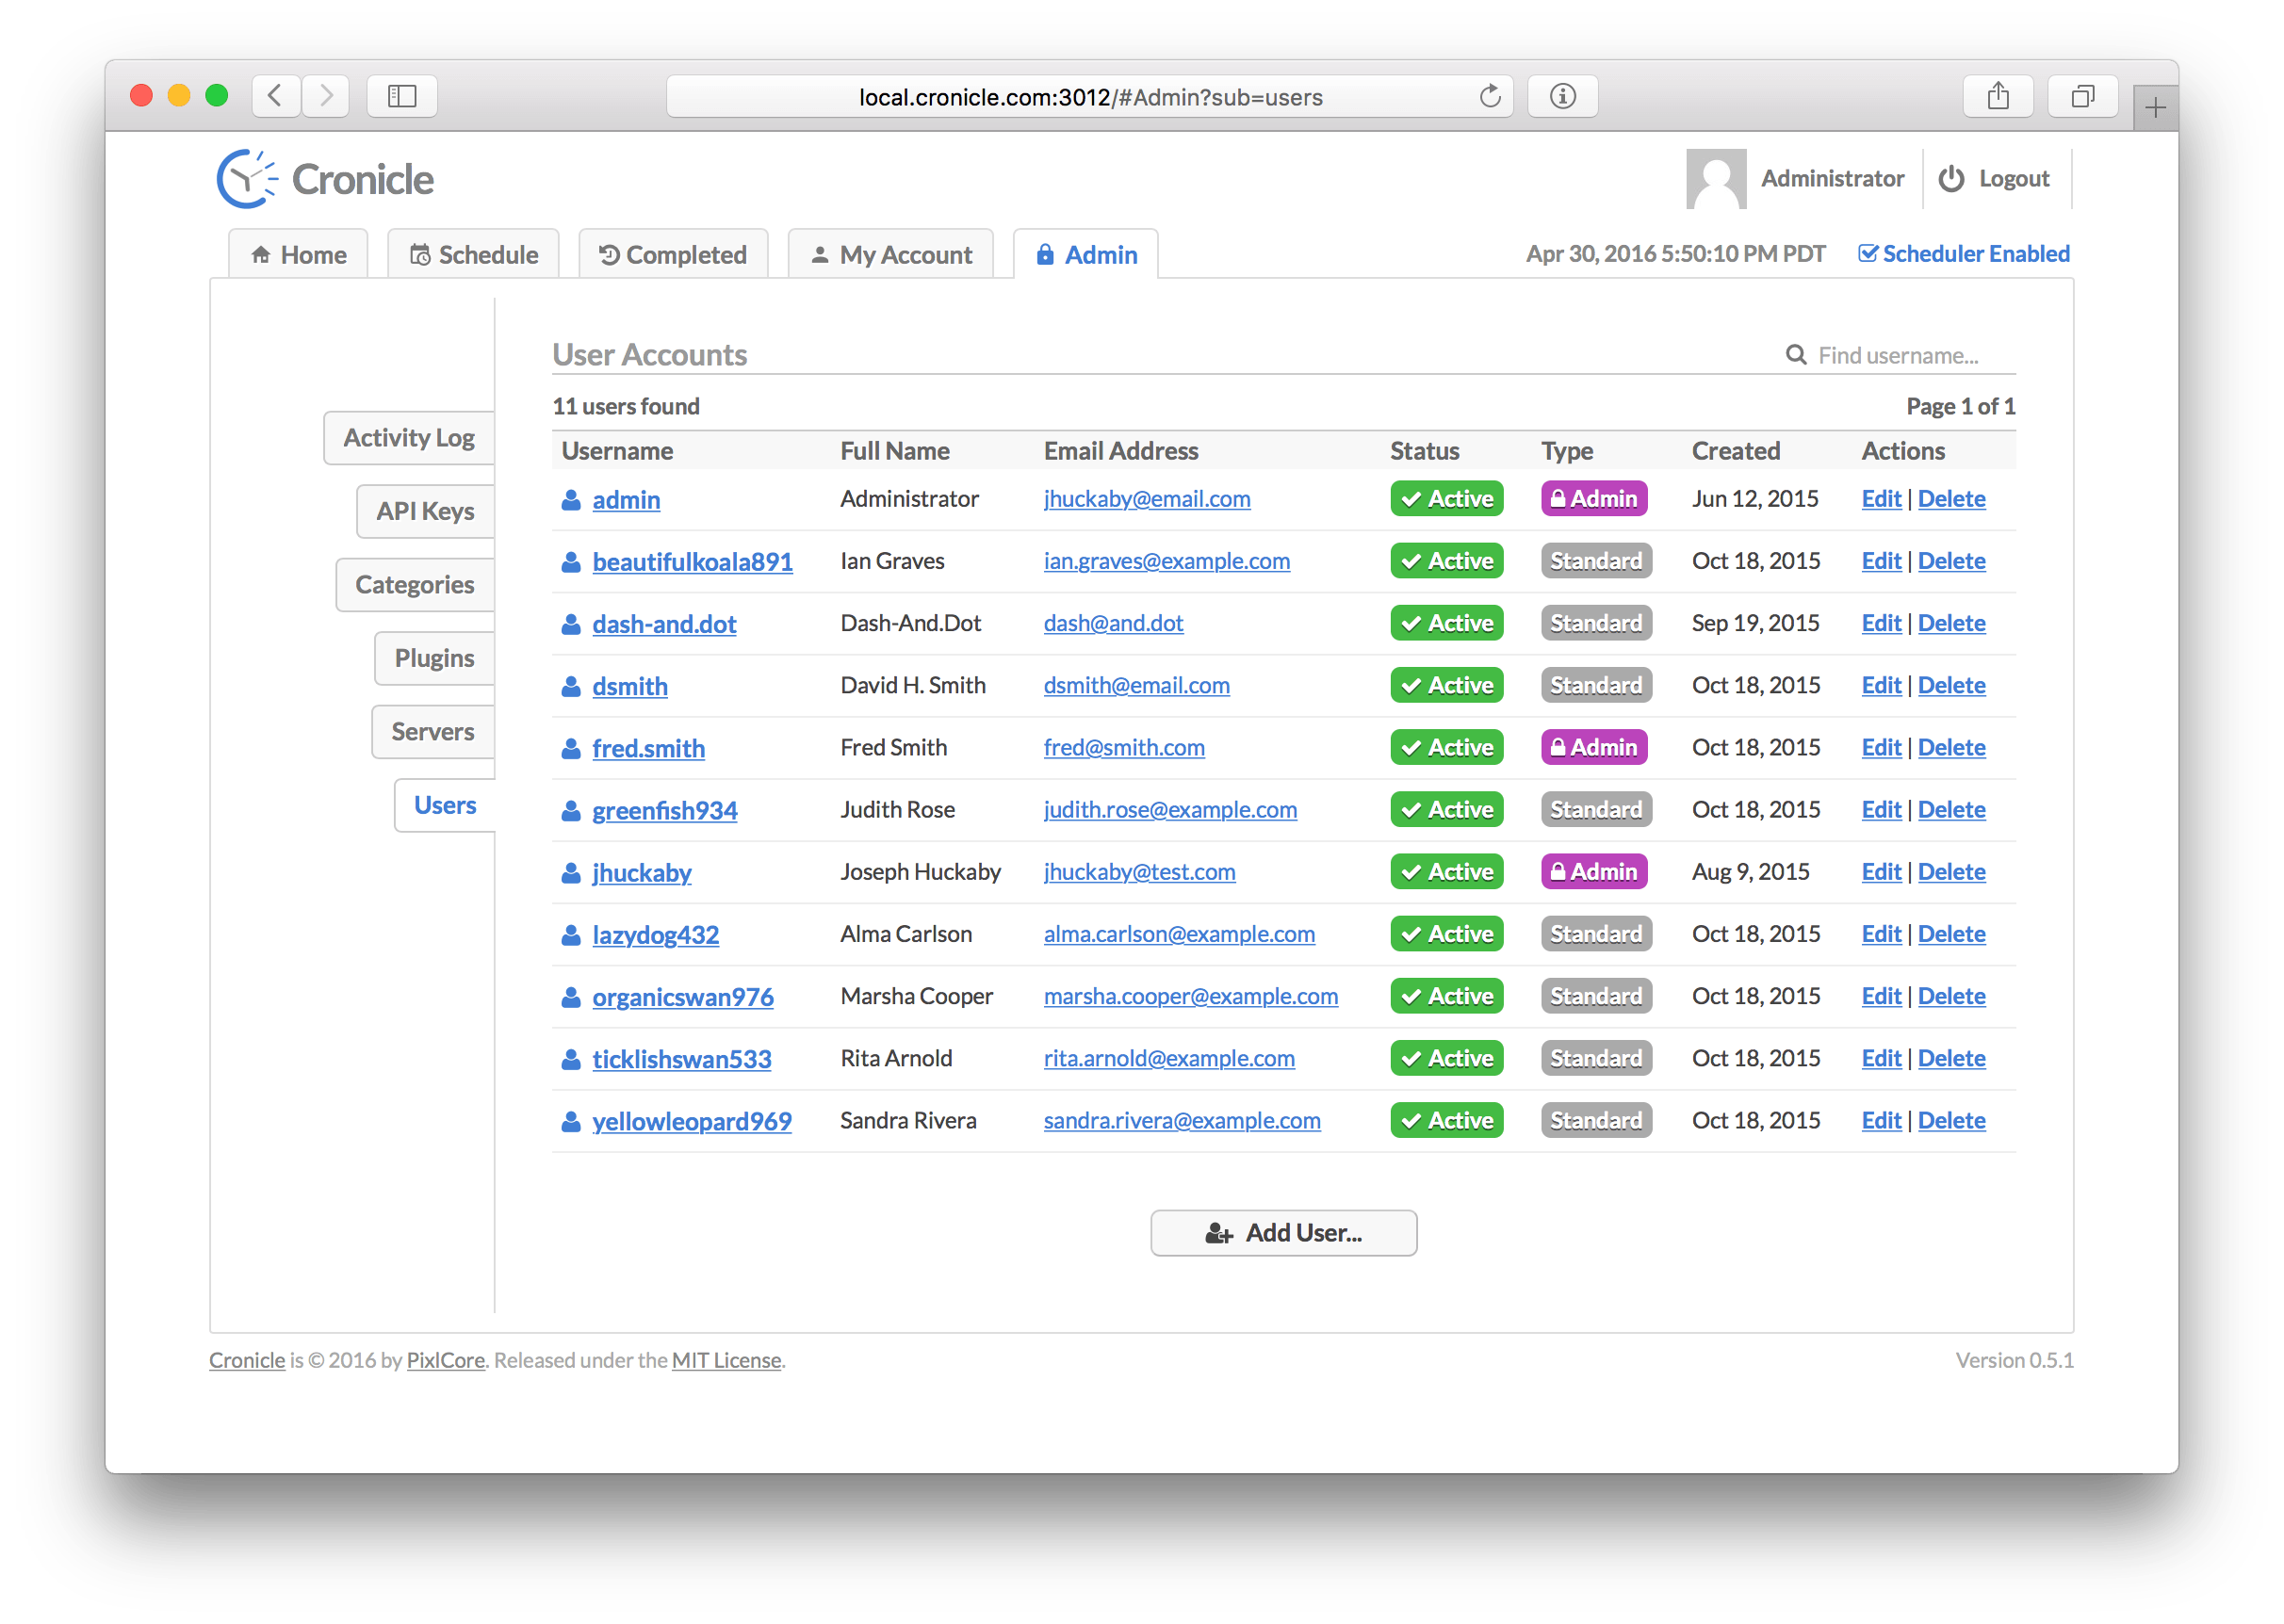
This tab shows you all the user accounts registered in the system, and allows you to edit, delete and add new ones. The table columns are as follows:
| Column | Description |
|---|---|
| Username | The account username. |
| Full Name | The user's full name. |
| Email Address | The user's e-mail address. |
| Status | The account status (active or disabled). |
| Type | The account type (standard or administrator). |
| Created | The date when the user was first created. |
| Actions | A list of actions to take (edit and delete). |
When you create or edit a user, you are taken to this screen:
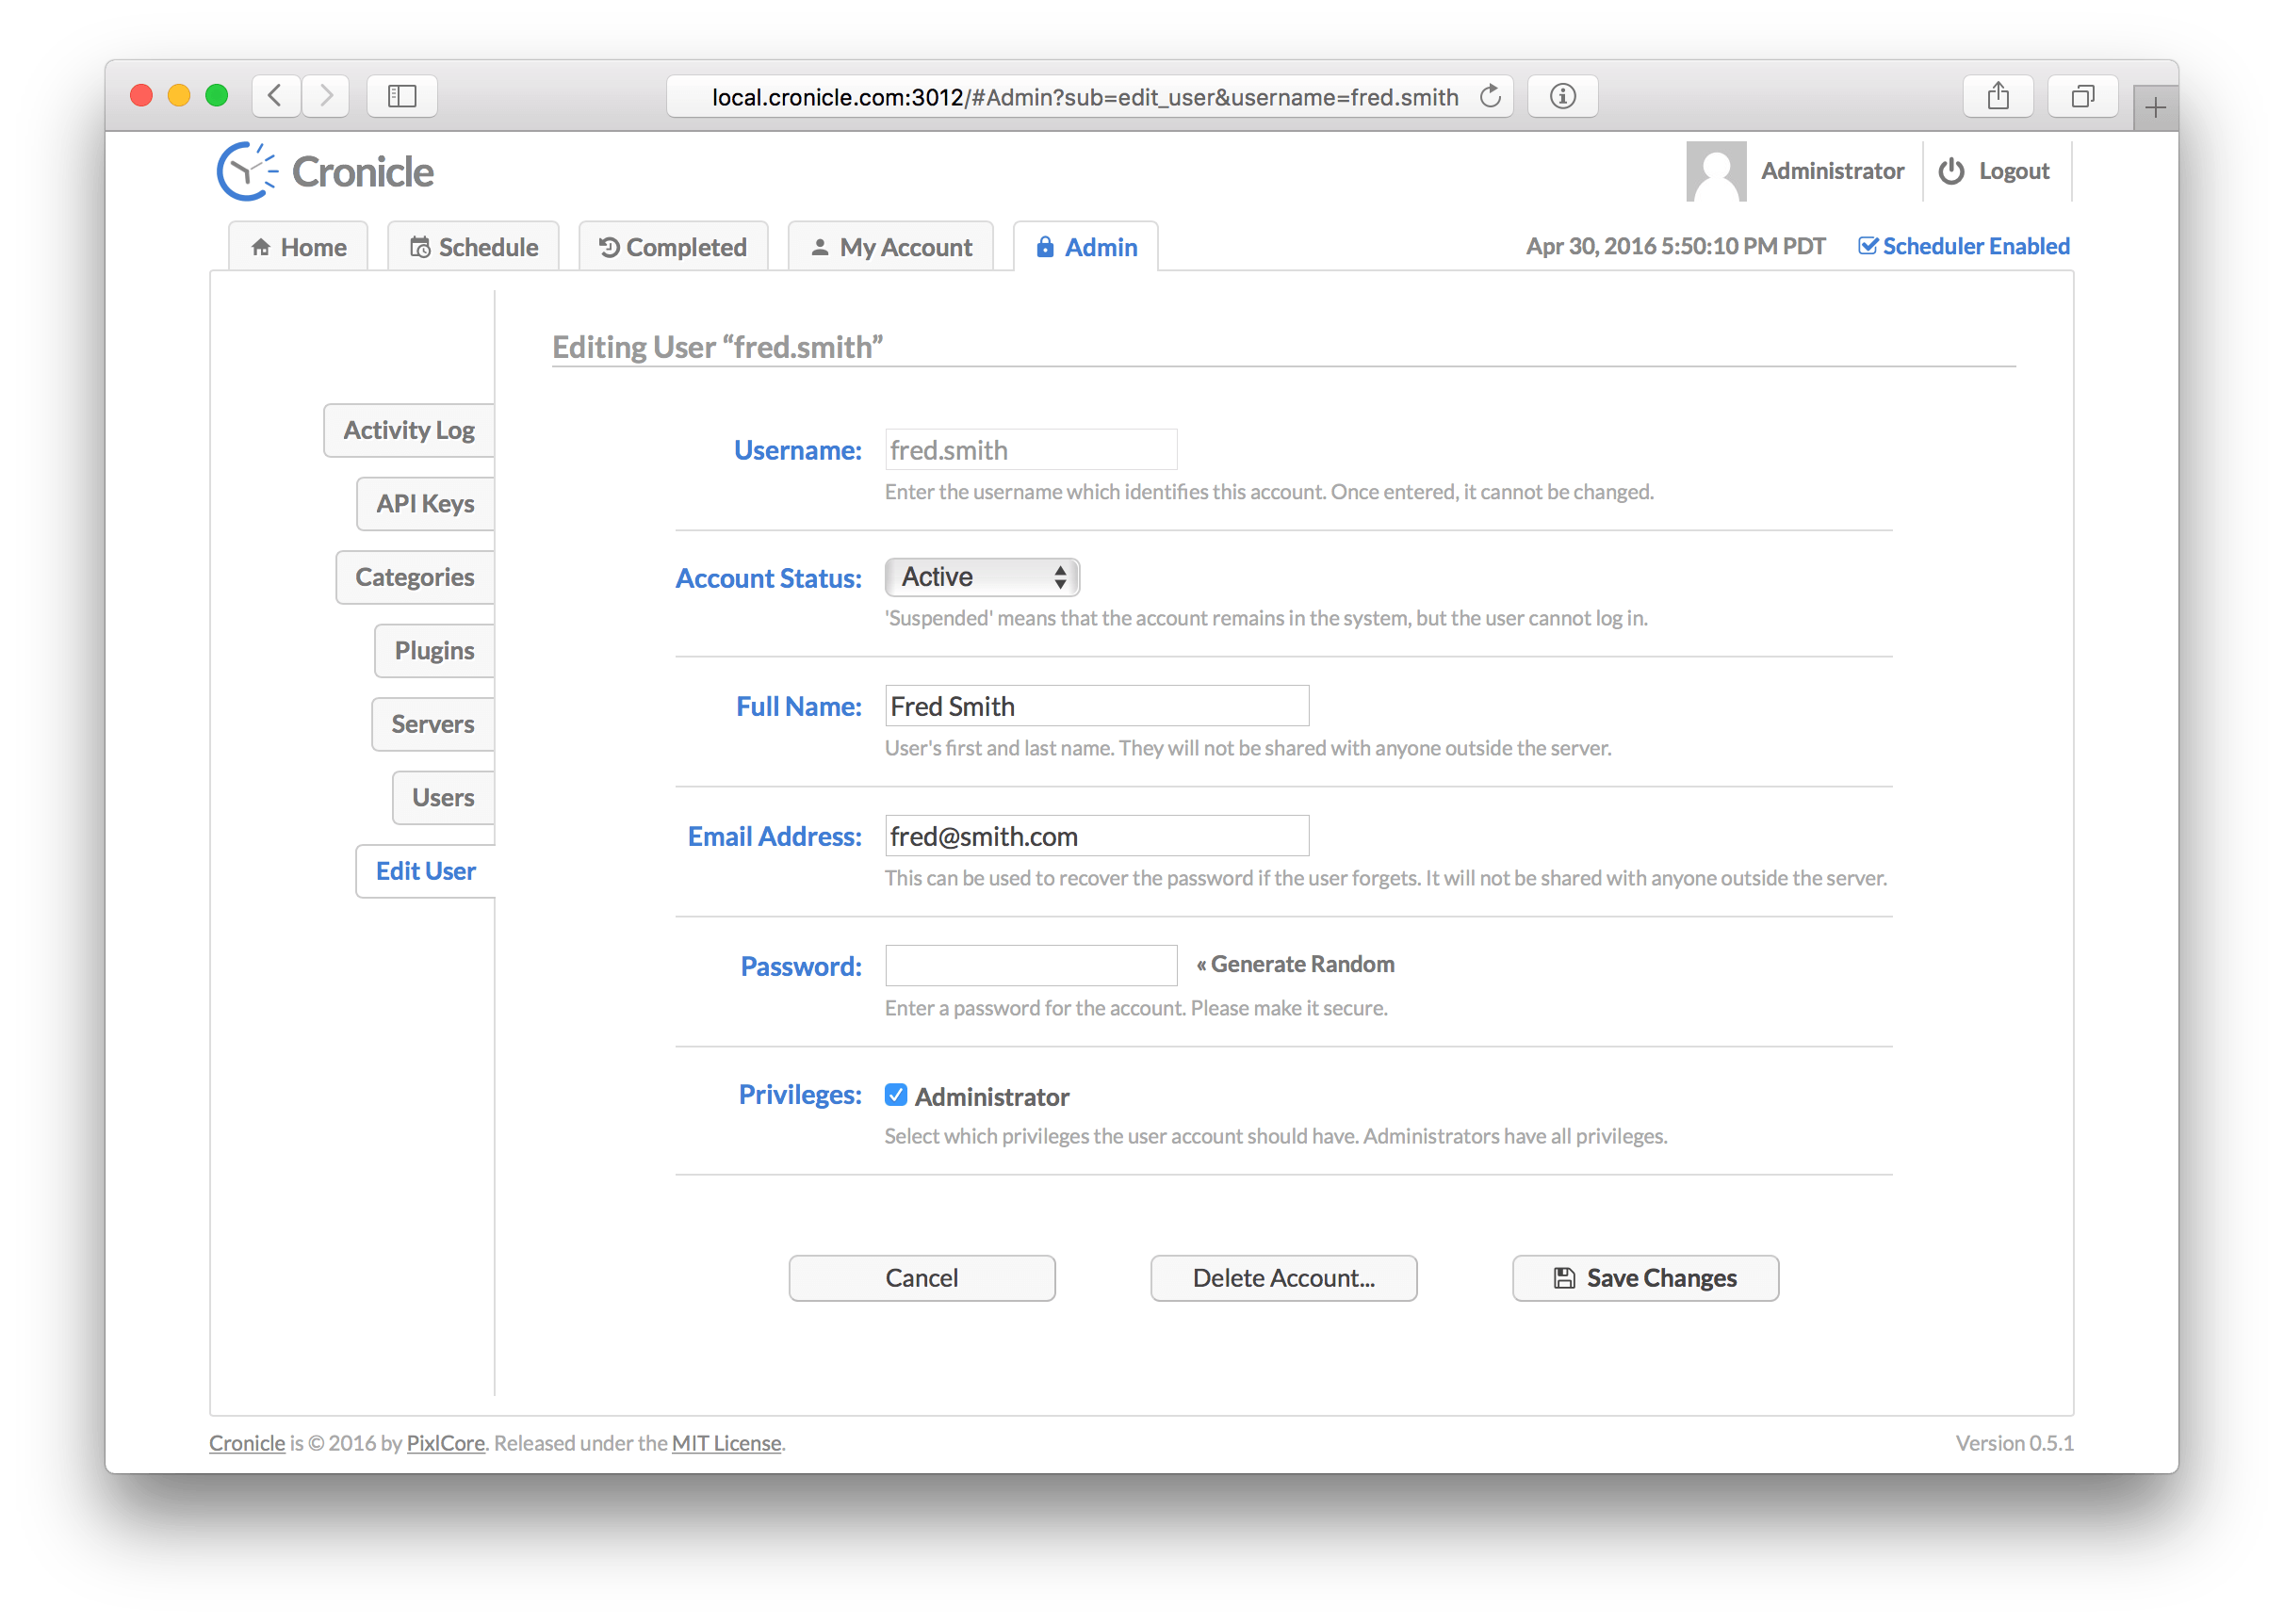
The user edit form contains the following elements:
- The Username, which cannot be edited after the user is created. Usernames may contain alphanumeric characters, periods and dashes.
- The Account Status which is either
ActiveorDisabled. Disabled accounts cannot login. - The user's Full Name, which is used for display purposes.
- The user's Email Address, which is used for event and error notifications.
- The account Password, which can be reset here, as well as randomized.
- A set of Privileges, which grant the user access to specific features of Cronicle.
Plugins
Plugins handle running your events, and reporting status back to the Cronicle daemon. They can be written in virtually any language, as they are really just command-line executables. Cronicle spawns a sub-process for each job, executes a command-line you specify, and then uses pipes to pass in job information and retrieve status, all in JSON format.
So you can write a Plugin in your language of choice, as long as it can read and write JSON. Also, Cronicle ships with a built-in Plugin for handling shell scripts, which makes things even easier if you just have some simple shell commands to run, and don't want to have to deal with JSON at all. See Shell Plugin below for more on this.
Writing Plugins
To write your own Plugin, all you need is to provide a command-line executable, and have it read and write JSON over STDIN and STDOUT. Information about the current job is passed as a JSON document to your STDIN, and you can send back status updates and completion events simply by writing JSON to your STDOUT.
Please note that regardless of your choice of programming language, your Plugin needs to be a real command-line executable. So it needs to have execute file permissions (usually 0755), and a shebang line at the top of the file, indicating which interpreter to use. For example, if you write a Node.js Plugin, you need something like this at the very top of your .js file:
#!/usr/bin/node
The location of the node binary may vary on your servers.
JSON Input
As soon as your Plugin is launched as a sub-process, a JSON document is piped to its STDIN stream, describing the job. This will be compacted onto a single line followed by an EOL, so you can simply read a line, and not have to worry about locating the start and end of the JSON. Here is an example JSON document (pretty-printed here for display purposes):
{
	"id": "jihuxvagi01",
	"hostname": "joeretina.local",
	"command": "/usr/local/bin/my-plugin.js",
	"event": "3c182051",
	"now": 1449431125,
	"log_file": "/opt/cronicle/logs/jobs/jihuxvagi01.log",
	"params": {
		"myparam1": "90",
		"myparam2": "Value"
	}
}
There may be other properties in the JSON (many are copied over from the event), but these are the relevant ones:
| Property Name | Description |
|---|---|
id |
A unique alphanumeric ID assigned to the job. |
hostname |
The hostname of the server currently processing the job. |
command |
The exact command that was executed to start your Plugin. |
event |
The Event ID of the event that fired off the job. |
now |
A Unix timestamp representing the "current" time for the job (very important -- see below). |
log_file |
A fully-qualified filesystem path to a unique log file specifically for the job, which you can use. |
params |
An object containing your Plugin's custom parameters, filled out with values from the Event Editor. |
The now property is special. It may or may not be the "current" time, depending on how and why the job started. Meaning, if the associated event is set to Run All Mode it is possible that a previous job couldn't run for some reason, and Cronicle is now "catching up" by running missed jobs. In this situation, the now property will be set to the time when the event should have run. For example, if you have a Plugin that generates daily reports, you'll need to know which day to run the report for. Normally this will be the current date, but if a day was missed for some reason, and Cronicle is catching up by running yesterday's job, you should use the now time to determine which day's data to pull for your report.
The log_file is designed for your Plugin's own use. It is a unique file created just for the job, and its contents are displayed in real-time via the Cronicle UI on the Job Details Tab. You can use any log format you want, just make sure you open the file in "append" mode (it contains a small header written by the daemon). Note that you can also just print to STDOUT or STDERR, and these are automatically appended to the log file for you.
The params object will contain all the custom parameter keys defined when you created the Plugin (see the Plugins Tab section), and values populated from the event editor, when the Plugin was selected for the event. The keys should match the parameter IDs you defined.
JSON Output
Your Plugin is expected to write JSON to STDOUT in order to report status back to the Cronicle daemon. At the very least, you need to notify Cronicle that the job was completed. This is done by printing a JSON object with a complete property set to 1 (or any true value). You need to make sure the JSON is compacted onto a single line, and ends with a single EOL character (\n on Unix). Example:
{ "complete": 1 }
This tells Cronicle that the job was completed, and your process is about to exit. By default, the job is considered a success. However, if the job failed and you need to report an error, you must include a code property set to any non-zero error code you want, and a description property set to a custom error message. Include these along with the complete property in the JSON. Example:
{ "complete": 1, "code": 999, "description": "Failed to connect to database." }
Your error code and description will be displayed on the Job Details Tab, and in any e-mail notifications and/or web hooks sent out for the event completion.
If your Plugin writes anything other than JSON to STDOUT (or STDERR), it is automatically appended to your log file. This is so you don't have to worry about using existing code or utilities that may emit some kind of output. Cronicle is very forgiving in this regard.
Reporting Progress
In addition to reporting success or failure at the end of a job, you can also optionally report progress at custom intervals while your job is running. This is how Cronicle can display its visual progress meter in the UI, as well as calculate the estimated time remaining. To update the progress of a job, simply print a JSON document with a progress property, set to a number between 0.0 and 1.0. Example:
{ "progress": 0.5 }
This would show progress at 50% completion, and automatically calculate the estimated time remaining based on the duration and progress so far. You can repeat this as often as you like, with as granular progress as you can provide.
Performance Metrics
You can optionally include performance metrics at the end of a job, which are displayed as a pie chart on the Job Details Tab. These metrics can consist of any categories you like, and the JSON format is a simple perf object where the values represent the amount of time spent in seconds. Example:
{ "perf": { "db": 18.51, "http": 3.22, "gzip": 0.84 } }
The perf keys can be anything you want. They are just arbitrary categories you can make up, which represent how your Plugin spent its time during the job.
Cronicle accepts a number of different formats for the perf metrics, to accommodate various performance tracking libraries. For example, you can provide the metrics in query string format, like this:
{ "perf": "db=18.51&http=3.22&gzip=0.84" }
If your metrics include a total (or t) in addition to other metrics, this is assumed to represent the total time, and will automatically be excluded from the pie chart (but included in the performance history graph).
If you track metrics in units other than seconds, you can provide the scale. For example, if your metrics are all in milliseconds, just set the scale property to 1000. Example:
{ "perf": { "scale": 1000, "db": 1851, "http": 3220, "gzip": 840 } }
The slightly more complex format produced by our own pixl-perf library is also supported.
Nested Metrics
In order for the pie chart to be accurate, your perf metrics must not overlap each other. Each metric should represent a separate period of time. Put another way, if all the metrics were added together, they should equal the total time. To illustrate this point, consider the following "bad" example:
{ "perf": { "database": 18.51, "run_sql_query": 3.22, "connect_to_db": 0.84 } }
In this case the Plugin is tracking three different metrics, but the database metric encompasses all database related activities, including the run_sql_query and connect_to_db. So the database metric overlaps the others. Cronicle has no way of knowing this, so the pie chart would be quite inaccurate, because the three metrics do not add up to the total time.
However, if you want to track nested metrics as well as a parent metric, just make sure you prefix your perf keys properly. In the above example, all you would need to do is rename the keys like this:
{ "perf": { "db": 18.51, "db_run_sql": 3.22, "db_connect": 0.84 } }
Cronicle will automatically detect that the db key is used as a prefix in the other two keys, and it will be omitted from the pie chart. Only the nested db_run_sql and db_connect keys will become slices of the pie, as they should add up to the total in this case.
Note that all the metrics are included in the performance history graph, as that is a line graph, not a pie chart, so it doesn't matter that everything add up to the total time.
Changing Notification Settings
Notification settings for the job are configured in the UI at the event level, and handled automatically after your Plugin exits. E-mail addresses may be entered for both successful and failure results. However, your Plugin running the job can alter these settings on-the-fly.
For example, if you only want to send a successful e-mail in certain cases, and want to disable it based on some outcome from inside the Plugin, just print some JSON to STDOUT like this:
{ "notify_success": "" }
This will disable the e-mail that is normally sent upon success. Similarly, if you want to disable the failure e-mail, print this to STDOUT:
{ "notify_fail": "" }
Another potential use of this feature is to change who gets e-mailed, based on a decision made inside your Plugin. For example, you may have multiple error severity levels, and want to e-mail a different set of people for the really severe ones. To do that, just specify a new set of e-mail addresses in the notify_fail property:
{ "notify_fail": "[email protected]" }
These JSON updates can be sent as standalone records as shown here, at any time during your job run, or you can batch everything together at the very end:
{ "complete": 1, "code": 999, "description": "Failed to connect to database.", "perf": { "db": 18.51, "db_run_sql": 3.22, "db_connect": 0.84 }, "notify_fail": "[email protected]" }
Chain Reaction Control
You can enable or disable Chain Reaction mode on the fly, by setting the chain property in your JSON output. This allows you to designate another event to launch as soon as the current job completes, or to clear the property (set it to false or a blank string) to disable Chain Reaction mode if it was enabled in the UI.
To enable a chain reaction, you need to know the Event ID of the event you want to trigger. You can determine this by editing the event in the UI and copy the Event ID from the top of the form, just above the title. Then you can specify the ID in your jobs by printing some JSON to STDOUT like this:
{ "chain": "e29bf12db" }
Remember that your job must complete successfully in order to trigger the chain reaction, and fire off the next event. However, if you want to run a event only on job failure, set the chain_error property instead:
{ "chain_error": "e29bf12db" }
You set both the chain and chain_error properties, to run different events on success / failure.
To disable chain reaction mode, set the chain and chain_error properties to false or empty strings:
{ "chain": "", "chain_error": "" }
Chain Data
When a chained event runs, some additional information is included in the initial JSON job object sent to STDIN:
| Property Name | Description |
|---|---|
source_event |
The ID of the original event that started the chain reaction. |
chain_code |
The error code from the original job, or 0 for success. |
chain_description |
The error description from the original job, if applicable. |
chain_data |
Custom user data, if applicable (see below). |
You can pass custom JSON data to the next event in the chain, when using a Chain Reaction event. Simply specify a JSON property called chain_data in your JSON output, and pass in anything you want (can be a complex object / array tree), and the next event will receive it. Example:
{ "chain": "e29bf12db", "chain_data": { "custom_key": "foobar", "value": 42 } }
So in this case when the event e29bf12db runs, it will be passed your chain_data object as part of the JSON sent to it when the job starts. The Plugin code running the chained event can access the data by parsing the JSON and grabbing the chain_data property.
Custom Data Tables
If your Plugin produces statistics or other tabular data at the end of a run, you can have Cronicle render this into a table on the Job Details page. Simply print a JSON object with a property named table, containing the following keys:
| Property Name | Description |
|---|---|
title |
Optional title displayed above the table, defaults to "Job Stats". |
header |
Optional array of header columns, displayed in shaded bold above the main data rows. |
rows |
Required array of rows, with each one being its own inner array of column values. |
caption |
Optional caption to show under the table (centered, small gray text). |
Here is an example data table. Note that this has been expanded for documentation purposes, but in practice your JSON needs to be compacted onto a single line when printed to STDOUT.
{
	"table": {
		"title": "Sample Job Stats",
		"header": [
			"IP Address", "DNS Lookup", "Flag", "Count", "Percentage"
		],
		"rows": [
			["62.121.210.2", "directing.com", "MaxEvents-ImpsUserHour-DMZ", 138, "0.0032%" ],
			["97.247.105.50", "hsd2.nm.comcast.net", "MaxEvents-ImpsUserHour-ILUA", 84, "0.0019%" ],
			["21.153.110.51", "grandnetworks.net", "InvalidIP-Basic", 20, "0.00046%" ],
			["95.224.240.69", "hsd6.mi.comcast.net", "MaxEvents-ImpsUserHour-NM", 19, "0.00044%" ],
			["72.129.60.245", "hsd6.nm.comcast.net", "InvalidCat-Domestic", 17, "0.00039%" ],
			["21.239.78.116", "cable.mindsprung.com", "InvalidDog-Exotic", 15, "0.00037%" ],
			["172.24.147.27", "cliento.mchsi.com", "MaxEvents-ClicksPer", 14, "0.00035%" ],
			["60.203.211.33", "rgv.res.com", "InvalidFrog-Croak", 14, "0.00030%" ],
			["24.8.8.129", "dsl.att.com", "Pizza-Hawaiian", 12, "0.00025%" ],
			["255.255.1.1", "favoriteisp.com", "Random-Data", 10, "0%" ]
		],
		"caption": "This is an example stats table you can generate from within your Plugin code."
	}
}
This would produce a table like the following:
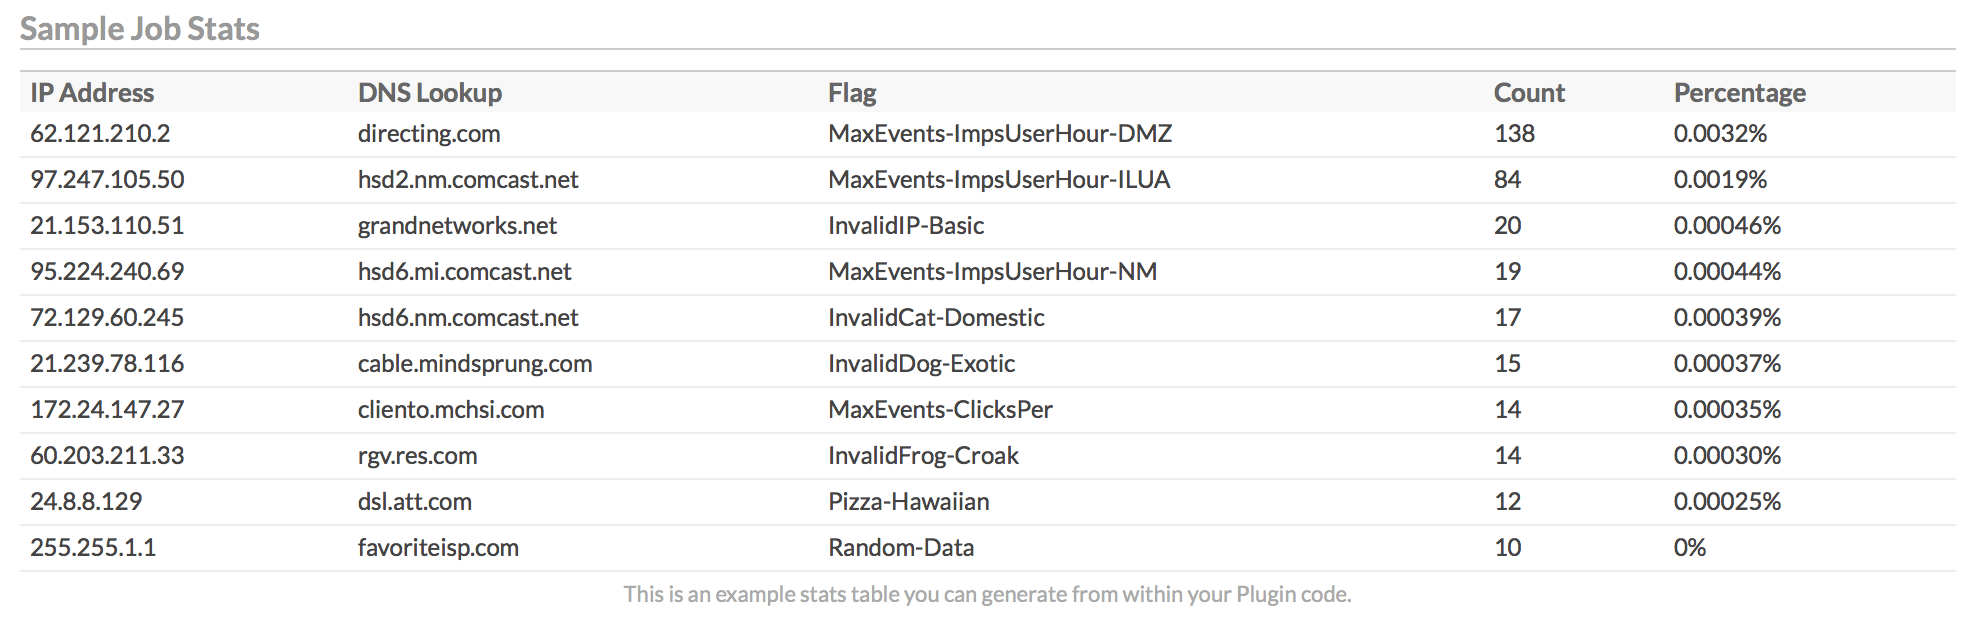
Custom HTML Content
If you would prefer to generate your own HTML content from your Plugin code, and just have it rendered into the Job Details page, you can do that as well. Simply print a JSON object with a property named html, containing the following keys:
| Property Name | Description |
|---|---|
title |
Optional title displayed above the section, defaults to "Job Report". |
content |
Required Raw HTML content to render into the page. |
caption |
Optional caption to show under your HTML (centered, small gray text). |
Here is an example HTML report. Note that this has been expanded for documentation purposes, but in practice your JSON needs to be compacted onto a single line when printed to STDOUT.
{
	"html": {
		title: "Sample Job Report",
		content: "This is <b>HTML</b> so you can use <i>styling</i> and such.",
		caption: "This is a caption displayed under your HTML content."
	}
}
If your Plugin generates plain text instead of HTML, you can just wrap it in a <pre> block, which will preserve formatting such as whitespace.
Updating The Event
Your job can optionally trigger an event update when it completes. This can be used to do things such as disable the event (remove it from the schedule) in response to a catastrophic error, or change the event's timing, change the server or group target, and more.
To update the event for a job, simply include an update_event object in your Plugin's JSON output, containing any properties from the Event Data Format. Example:
{
	"update_event": {
		"enabled": 0
	}
}
This would cause the event to be disabled, so the schedule would no longer launch it. Note that you can only update the event once, and it happens at the completion of your job.
Job Environment Variables
When processes are spawned to run jobs, your Plugin executable is provided with a copy of the current environment, along with the following custom environment variables:
| Variable | Description |
|---|---|
$CRONICLE |
The current Cronicle version, e.g. 1.0.0. |
$JOB_ALGO |
Specifies the algorithm that was used for picking the server from the target group. See Algorithm. |
$JOB_CATCH_UP |
Will be set to 1 if the event has Run All Mode mode enabled, 0 otherwise. |
$JOB_CATEGORY_TITLE |
The Category Title to which the event is assigned. See Categories Tab. |
$JOB_CATEGORY |
The Category ID to which the event is assigned. See Categories Tab. |
$JOB_CHAIN |
The chain reaction event ID to launch if job completes successfully. See Chain Reaction. |
$JOB_CHAIN_ERROR |
The chain reaction event ID to launch if job fails. See Chain Reaction. |
$JOB_COMMAND |
The command-line executable that was launched for the current Plugin. |
$JOB_CPU_LIMIT |
Limits the CPU to the specified percentage (100 = 1 core), abort if exceeded. See Event Resource Limits. |
$JOB_CPU_SUSTAIN |
Only abort if the CPU limit is exceeded for this many seconds. See Event Resource Limits. |
$JOB_DETACHED |
Specifies whether Detached Mode is enabled or not. |
$JOB_EVENT_TITLE |
A display name for the event, shown on the Schedule Tab as well as in reports and e-mails. |
$JOB_EVENT |
The ID of the event that launched the job. |
$JOB_HOSTNAME |
The hostname of the server chosen to run the current job. |
$JOB_ID |
The unique alphanumeric ID assigned to the job. |
$JOB_LOG |
The filesystem path to the job log file, which you can append to if you want. However, STDOUT or STDERR are both piped to the log already. |
$JOB_MEMORY_LIMIT |
Limits the memory usage to the specified amount, in bytes. See Event Resource Limits. |
$JOB_MEMORY_SUSTAIN |
Only abort if the memory limit is exceeded for this many seconds. See Event Resource Limits. |
$JOB_MULTIPLEX |
Will be set to 1 if the event has Multiplexing enabled, 0 otherwise. |
$JOB_NOTES |
Text notes saved with the event, included in e-mail notifications. See Event Notes. |
$JOB_NOTIFY_FAIL |
List of e-mail recipients to notify upon job failure (CSV). See Event Notification. |
$JOB_NOTIFY_SUCCESS |
List of e-mail recipients to notify upon job success (CSV). See Event Notification. |
$JOB_NOW |
The Epoch timestamp of the job time (may be in the past if re-running a missed job). |
$JOB_PLUGIN_TITLE |
The Plugin Title for the associated event. |
$JOB_PLUGIN |
The Plugin ID for the associated event. |
$JOB_RETRIES |
The number of retries to allow before reporting an error. See Event Retries. |
$JOB_RETRY_DELAY |
Optional delay between retries, in seconds. See Event Retries. |
$JOB_SOURCE |
String representing who launched the job, will be Scheduler or Manual (USERNAME). |
$JOB_STAGGER |
If Multiplexing is enabled, this specifies the number of seconds to wait between job launches. |
$JOB_TIME_START |
The starting time of the job, in Epoch seconds. |
$JOB_TIMEOUT |
The event timeout (max run time) in seconds, or 0 if no timeout is set. |
$JOB_TIMEZONE |
The timezone for interpreting the event timing settings. Needs to be an IANA timezone string. See Event Timing. |
$JOB_WEB_HOOK |
An optional URL to hit for the start and end of each job. See Event Web Hook. |
In addition, any Plugin Parameters are also passed as environment variables. The keys are converted to upper-case, as that seems to be the standard. So for example, you can customize the PATH by declaring it as a Plugin Parameter:
You can also include inline variables in the parameter value itself, using the syntax $VARNAME. So for example, if you wanted to append to the current PATH instead of having to set it from scratch, you could:
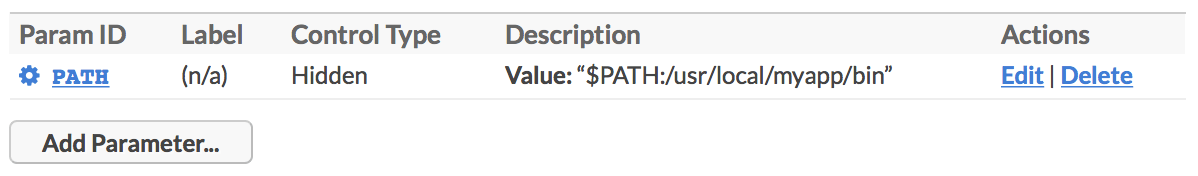
Please note that if you do overwrite the entire path, you must include the location of the Node.js node binary (typically in /usr/bin or /usr/local/bin). Otherwise, things will not work well.
Sample Node Plugin
Here is a sample Plugin written in Node.js:
#!/usr/bin/env node

var rl = require('readline').createInterface({ input: process.stdin });

rl.on('line', function(line) {
	// got line from stdin, parse JSON
	var job = JSON.parse(line);
	console.log("Running job: " + job.id + ": " + JSON.stringify(job) );

	// Update progress at 50%
	setTimeout( function() {
		console.log("Halfway there!");
		process.stdout.write( JSON.stringify({ progress: 0.5 }) + "\n" );
	}, 5 * 1000 );

	// Write completion to stdout
	setTimeout( function() {
		console.log("Job complete, exiting.");

		process.stdout.write( JSON.stringify({
			complete: 1,
			code: 0
		}) + "\n" );

	}, 10 * 1000 );

	// close readline interface
	rl.close();
});
Sample Perl Plugin
Here is a sample Plugin written in Perl, using the JSON module:
#!/usr/bin/env perl

use strict;
use JSON;

# set output autoflush
$| = 1;

# read line from stdin -- it should be our job JSON
my $line = <STDIN>;
my $job = decode_json($line);

print "Running job: " . $job->{id} . ": " . encode_json($job) . "\n";

# report progress at 50%
sleep 5;
print "Halfway there!\n";
print encode_json({ progress => 0.5 }) . "\n";

sleep 5;
print "Job complete, exiting.\n";

# All done, send completion via JSON
print encode_json({
	complete => 1,
	code => 0
}) . "\n";

exit(0);

1;
Sample PHP Plugin
Here is a sample Plugin written in PHP:
#!/usr/bin/env php
<?php

// make sure php flushes after every print
ob_implicit_flush();

// read line from stdin -- it should be our job JSON
$line = fgets( STDIN );
$job = json_decode($line, true);

print( "Running job: " . $job['id'] . ": " . json_encode($job) . "\n" );

// report progress at 50%
sleep(5);
print( "Halfway there!\n" );
print( json_encode(array( 'progress' => 0.5 )) . "\n" );

sleep(5);
print( "Job complete, exiting.\n" );

// All done, send completion via JSON
print( json_encode(array(
	'complete' => 1,
	'code' => 0
)) . "\n" );

exit(0);
?>
Built-in Shell Plugin
Cronicle ships with a built-in "Shell Plugin", which you can use to execute arbitrary shell scripts. Simply select the Shell Plugin from the Edit Event Tab, and enter your script. This is an easy way to get up and running quickly, because you don't have to worry about reading or writing JSON.
The Shell Plugin determines success or failure based on the exit code of your script. This defaults to 0 representing success. Meaning, if you want to trigger an error, exit with a non-zero status code, and make sure you print your error message to STDOUT or STDERR (both will be appended to your job's log file). Example:
#!/bin/bash

# Perform tasks or die trying...
/usr/local/bin/my-task-1.bin || exit 1
/usr/local/bin/my-task-2.bin || exit 1
/usr/local/bin/my-task-3.bin || exit 1
You can still report intermediate progress with the Shell Plugin. It can accept JSON in the standard output format if enabled, but there is also a shorthand. You can echo a single number on its own line, from 0 to 100, with a % suffix, and that will be interpreted as the current progress. Example:
#!/bin/bash

# Perform some long-running task...
/usr/local/bin/my-task-1.bin || exit 1
echo "25%"

# And another...
/usr/local/bin/my-task-2.bin || exit 1
echo "50%"

# And another...
/usr/local/bin/my-task-3.bin || exit 1
echo "75%"

# And the final task...
/usr/local/bin/my-task-4.bin || exit 1
This would allow Cronicle to show a graphical progress bar on the Home and Job Details tabs, and estimate the time remaining based on the elapsed time and current progress.
Pro-Tip: The Shell Plugin actually supports any interpreted scripting language, including Node.js, PHP, Perl, Python, and more. Basically, any language that supports a Shebang line will work in the Shell Plugin. Just change the #!/bin/sh to point to your interpreter binary of choice.
Built-in HTTP Request Plugin
Cronicle ships with a built-in "HTTP Request" Plugin, which you can use to send simple GET, HEAD or POST requests to any URL, and log the response. You can specify custom HTTP request headers, and also supply regular expressions to match a successful response based on the content. Here is the user interface when selected:
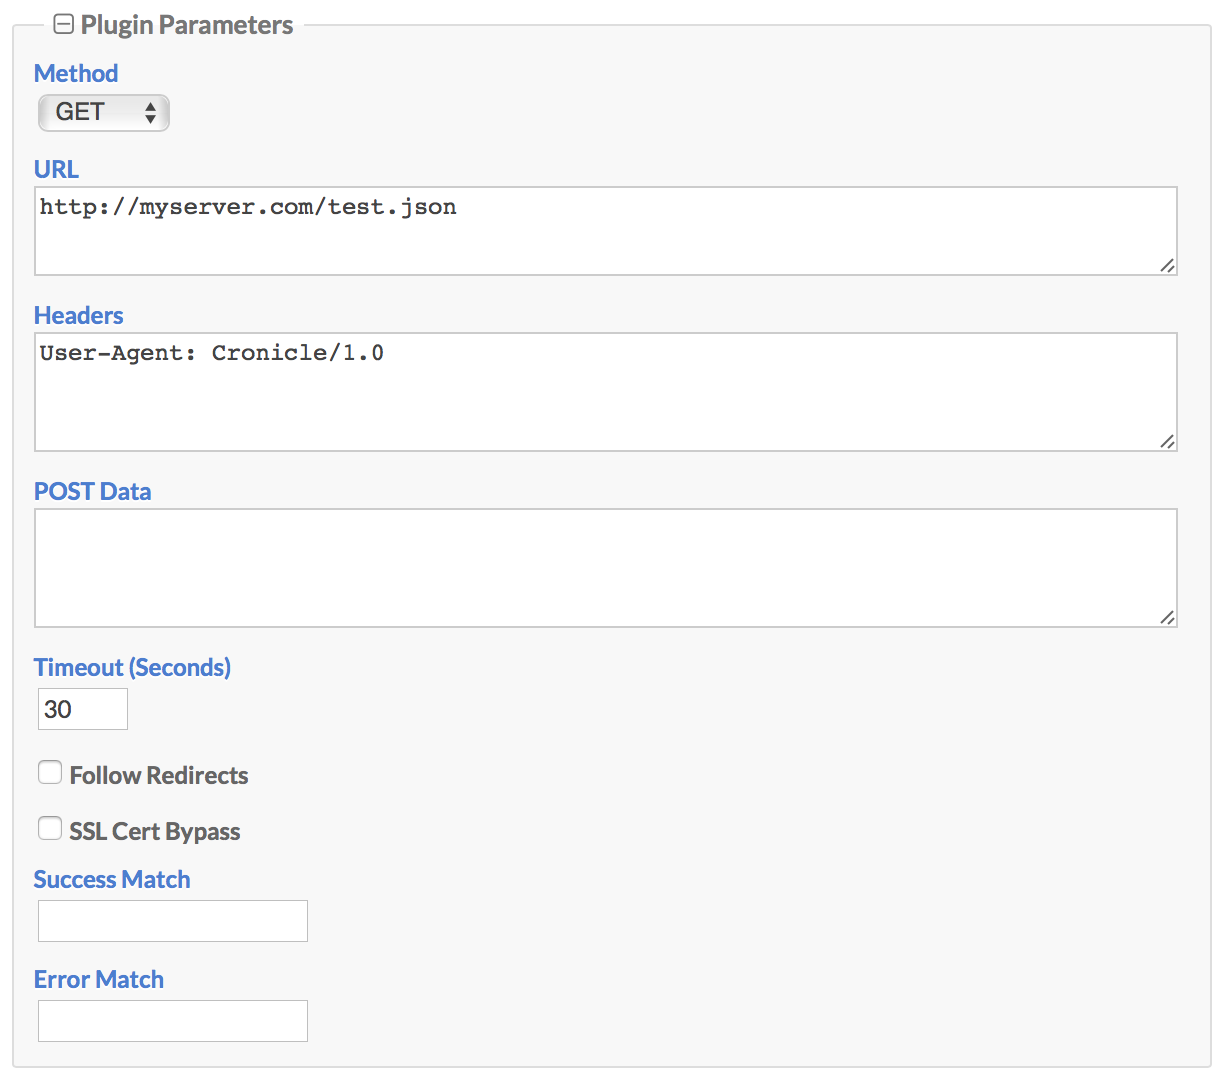
Here are descriptions of the parameters:
| Plugin Parameter | Description |
|---|---|
| Method | Select the HTTP request method, either GET, HEAD or POST. |
| URL | Enter your fully-qualified URL here, which must begin with either http:// or https://. |
| Headers | Optionally include any custom request headers here, one per line. |
| POST Data | If you are sending a HTTP POST, enter the raw POST data here. |
| Timeout | Enter the timeout in seconds, which is measured as the time to first byte in the response. |
| Follow Redirects | Check this box to automatically follow HTTP redirect responses (up to 32 of them). |
| SSL Cert Bypass | Check this box if you need to make HTTPS requests to servers with invalid SSL certificates (self-signed or other). |
| Success Match | Optionally enter a regular expression here, which is matched against the response body. If specified, this must match to consider the job a success. |
| Error Match | Optionally enter a regular expression here, which is matched against the response body. If this matches the response body, then the job is aborted with an error. |
HTTP Request Chaining
The HTTP Request Plugin supports Cronicle's Chain Reaction system in two ways. First, information about the HTTP response is passed into the Chain Data object, so downstream chained events can read and act on it. Specifically, all the HTTP response headers, and possibly even the content body itself (if formatted as JSON and smaller than 1 MB) are included. Example:
"chain_data": {
	"headers": {
		"date": "Sat, 14 Jul 2018 20:14:01 GMT",
		"server": "Apache/2.4.28 (Unix) LibreSSL/2.2.7 PHP/5.6.30",
		"last-modified": "Sat, 14 Jul 2018 20:13:54 GMT",
		"etag": "\"2b-570fb3c47e480\"",
		"accept-ranges": "bytes",
		"content-length": "43",
		"connection": "close",
		"content-type": "application/json",
		"x-uuid": "7617a494-823f-4566-8f8b-f479c2a6e707"
	},
	"json": {
		"key1": "value1",
		"key2": 12345
	}
}
In this example an HTTP request was made that returned those specific response headers (the header names are converted to lower-case), and the body was also formatted as JSON, so the JSON data itself is parsed and included in a property named json. Downstream events that are chain-linked to the HTTP Request event can read these properties and act on them.
Secondly, you can chain an HTTP Request into another HTTP Request, and use the chained data values from the previous response in the next request. To do this, you need to utilize a special [/bracket/slash] placeholder syntax in the second request, to lookup values in the chain_data object from the first one. You can use these placeholders in the URL, Request Headers and POST Data text fields. Example:
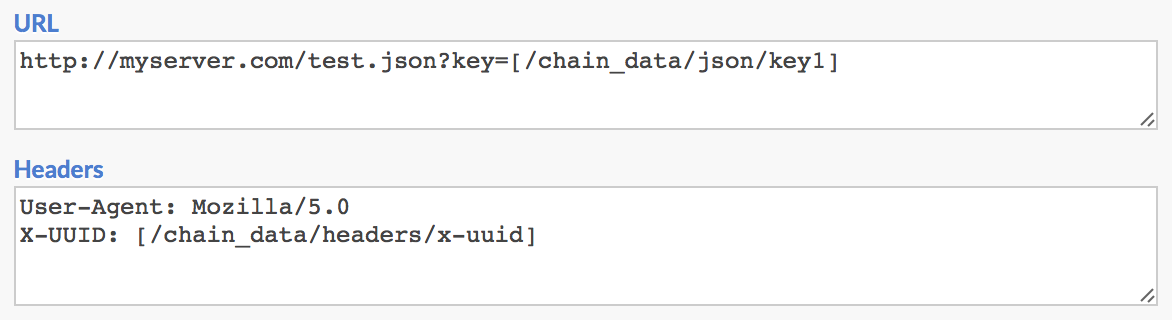
Here you can see we are using two placeholders, one in the URL and another in the HTTP request headers. These are looking up values from a previous HTTP Request event, and passing them into the next request. Specifically, we are using:
| Placeholder | Description |
|---|---|
[/chain_data/json/key1] |
This placeholder is looking up the key value from the JSON data (body content) of the previous HTTP response. Using our example response shown above, this would resolve to value1. |
[/chain_data/headers/x-uuid] |
This placeholder is looking up the X-UUID response header from the previous HTTP response. Using our example response shown above, this would resolve to 7617a494-823f-4566-8f8b-f479c2a6e707. |
So once the second request is sent off, after placeholder expansion the URL would actually resolve to:
http://myserver.com/test.json?key=value1
And the headers would expand to:
User-Agent: Mozilla/5.0
X-UUID: 7617a494-823f-4566-8f8b-f479c2a6e707
You can chain as many requests together as you like, but note that each request can only see and act on chain data from the previous request (the one that directly chained to it).
Command Line
Here are all the Cronicle services available to you on the command line. Most of these are accessed via the following shell script:
/opt/cronicle/bin/control.sh [COMMAND]
Here are all the accepted commands:
| Command | Description |
|---|---|
start |
Starts Cronicle in daemon mode. See Starting and Stopping. |
stop |
Stops the Cronicle daemon and waits for exit. See Starting and Stopping. |
restart |
Calls stop, then start, in sequence. See Starting and Stopping. |
status |
Checks whether Cronicle is currently running. See Starting and Stopping. |
setup |
Runs initial storage setup (for first time install). See Setup. |
maint |
Runs daily storage maintenance routine. See Storage Maintenance. |
admin |
Creates new emergency admin account (specify user / pass). See Recover Admin Access. |
export |
Exports data to specified file. See Data Import and Export. |
import |
Imports data from specified file. See Data Import and Export. |
upgrade |
Upgrades Cronicle to the latest stable (or specify version). See Upgrading Cronicle. |
version |
Outputs the current Cronicle package version and exits. |
help |
Displays a list of available commands and exits. |
Starting and Stopping
To start the service, use the start command:
/opt/cronicle/bin/control.sh start
And to stop it, the stop command:
/opt/cronicle/bin/control.sh stop
You can also issue a quick stop + start with the restart command:
/opt/cronicle/bin/control.sh restart
The status command will tell you if the service is running or not:
/opt/cronicle/bin/control.sh status
Environment Variables
Cronicle supports a special environment variable syntax, which can specify command-line options as well as override any configuration settings. The variable name syntax is CRONICLE_key where key is one of several command-line options (see table below) or a JSON configuration property path. These can come in handy for automating installations, and using container systems.
For overriding configuration properties by environment variable, you can specify any top-level JSON key from config.json, or a path to a nested property using double-underscore (__) as a path separator. For boolean properties, you can specify 1 for true and 0 for false. Here is an example of some of the possibilities available:
| Variable | Sample Value | Description |
|---|---|---|
CRONICLE_foreground |
1 |
Run Cronicle in the foreground (no background daemon fork). |
CRONICLE_echo |
1 |
Echo the event log to the console (STDOUT), use in conjunction with CRONICLE_foreground. |
CRONICLE_color |
1 |
Echo the event log with color-coded columns, use in conjunction with CRONICLE_echo. |
CRONICLE_base_app_url |
http://cronicle.mycompany.com |
Override the base_app_url configuration property. |
CRONICLE_email_from |
[email protected] |
Override the email_from configuration property. |
CRONICLE_smtp_hostname |
mail.mycompany.com |
Override the smtp_hostname configuration property. |
CRONICLE_secret_key |
CorrectHorseBatteryStaple |
Override the secret_key configuration property. |
CRONICLE_web_socket_use_hostnames |
1 |
Override the web_socket_use_hostnames configuration property. |
CRONICLE_server_comm_use_hostnames |
1 |
Override the server_comm_use_hostnames configuration property. |
CRONICLE_WebServer__http_port |
80 |
Override the http_port property inside the WebServer object. |
CRONICLE_WebServer__https_port |
443 |
Override the https_port property inside the WebServer object. |
CRONICLE_Storage__Filesystem__base_dir |
/data/cronicle |
Override the base_dir property inside the Filesystem object inside the Storage object. |
Almost every configuration property can be overridden using this environment variable syntax. The only exceptions are things like arrays, e.g. log_columns and socket_io_transports.
Storage Maintenance
Storage maintenance automatically runs every morning at 4 AM local server time (this is configurable if you want to change it). The operation is mainly for deleting expired records, and pruning lists that have grown too large. However, if the Cronicle service was stopped and you missed a day or two, you can force it to run at any time. Just execute this command on your primary server:
/opt/cronicle/bin/control.sh maint
This will run maintenance for the current day. However, if the service was down for more than one day, please run the command for each missed day, providing the date in YYYY-MM-DD format:
/opt/cronicle/bin/control.sh maint 2015-10-29
/opt/cronicle/bin/control.sh maint 2015-10-30
Recover Admin Access
Lost access to your admin account? You can create a new temporary administrator account on the command-line. Just execute this command on your primary server:
/opt/cronicle/bin/control.sh admin USERNAME PASSWORD
Replace USERNAME with the desired username, and PASSWORD with the desired password for the new account. Note that the new user will not show up in the main list of users in the UI. But you will be able to login using the provided credentials. This is more of an emergency operation, just to allow you to get back into the system. This is not a good way to create permanent users. Once you are logged back in, you should consider creating another account from the UI, then deleting the emergency admin account.
Server Startup
Here are the instructions for making Cronicle automatically start on server boot (Linux only). Type these commands as root:
cp /opt/cronicle/bin/cronicled.init /etc/init.d/cronicled
chmod 775 /etc/init.d/cronicled
Then, if you have a RedHat-style Linux (i.e. Fedora, CentOS), type this:
chkconfig cronicled on
Or, if you have Debian-style Linux (i.e. Ubuntu), type this:
update-rc.d cronicled defaults
For multi-server clusters, you'll need to repeat these steps on each server.
Important Note: When Cronicle starts on server boot, it typically does not have a proper user environment, namely a PATH environment variable. So if your scripts rely on binary executables in alternate locations, e.g. /usr/local/bin, you may have to restore the PATH and other variables inside your scripts by redeclaring them.
Upgrading Cronicle
To upgrade Cronicle, you can use the built-in upgrade command:
/opt/cronicle/bin/control.sh upgrade
This will upgrade the app and all dependencies to the latest stable release, if a new one is available. It will not affect your data storage, users, or configuration settings. All those will be preserved and imported to the new version. For multi-server clusters, you'll need to repeat this command on each server.
Alternately, you can specify the exact version you want to upgrade (or downgrade) to:
/opt/cronicle/bin/control.sh upgrade 1.0.4
If you upgrade to the HEAD version, this will grab the very latest from GitHub. Note that this is primarily for developers or beta-testers, and is likely going to contain bugs. Use at your own risk:
/opt/cronicle/bin/control.sh upgrade HEAD
Data Import and Export
Cronicle can import and export data via the command-line, to/from a plain text file. This data includes all the "vital" storage records such as Users, Plugins, Categories, Servers, Server Groups, API Keys and all Scheduled Events. It excludes things like user sessions, job completions and job logs.
To export your Cronicle data, issue this command on your primary server:
/opt/cronicle/bin/control.sh export /path/to/cronicle-data-backup.txt --verbose
The --verbose flag makes it emit some extra information to the console. Omit that if you want it to run silently. Omit the filename if you want it to export the data to STDOUT instead of a file.
To import data back into the system, first make sure Cronicle is stopped on all servers, and then run this command:
/opt/cronicle/bin/control.sh import /path/to/cronicle-data-backup.txt
If you want daily backups of the data which auto-expire after a year, a simple shell script can do it for ya:
#!/bin/bash
DATE_STAMP=`date "+%Y-%m-%d"`
BACKUP_DIR="/backup/cronicle/data"
BACKUP_FILE="$BACKUP_DIR/backup-$DATE_STAMP.txt"

mkdir -p $BACKUP_DIR
/opt/cronicle/bin/control.sh export $BACKUP_FILE --verbose
find $BACKUP_DIR -mtime +365 -type f -exec rm -v {} \;
Storage Migration Tool
If you need to migrate your Cronicle storage data to a new location or even a new engine, a simple built-in migration tool is provided. This tool reads all Cronicle storage records and writes them back out, using two different storage configurations (old and new).
To use the tool, first edit your Cronicle's conf/config.json file on your primary server, and locate the Storage object. This should point to your current storage configuration, i.e. where we are migrating from. Then, add a new object right next to it, and name it NewStorage. This should point to your new storage location and/or storage engine, i.e. where we are migrating to.
The contents of the NewStorage object should match whatever you'd typically put into Storage, if setting up a new install. See the Storage Configuration section for details. It can point to any of the supported engines. Here is an example that would migrate from the local filesystem to Amazon S3:
{
	"Storage": {
		"engine": "Filesystem",
		"Filesystem": {
			"base_dir": "data",
			"key_namespaces": 1
		}
	},

	"NewStorage": {
		"engine": "S3",
		"AWS": {
			"accessKeyId": "YOUR_AMAZON_ACCESS_KEY",
			"secretAccessKey": "YOUR_AMAZON_SECRET_KEY",
			"region": "us-west-1",
			"correctClockSkew": true,
			"maxRetries": 5,
			"httpOptions": {
				"connectTimeout": 5000,
				"timeout": 5000
			}
		},
		"S3": {
			"keyPrefix": "cronicle",
			"fileExtensions": true,
			"params": {
				"Bucket": "YOUR_S3_BUCKET_ID"
			}
		}
	}
}
You could also use this to migrate between two AWS regions, S3 buckets or key prefixes on S3. Just point Storage and NewStorage to the same engine, e.g. S3, and change only the region, bucket or prefix in the NewStorage object.
When you are ready to proceed, make sure you shut down Cronicle on all your servers. You should not migrate storage while Cronicle is running, as it can result in corrupted data.
All good? Okay then, on your Cronicle primary server as root (superuser), issue this command:
/opt/cronicle/bin/control.sh migrate
The following command-line arguments are supported:
| Argument | Description |
|---|---|
--debug |
Echo all debug log messages to the console. This also disables the progress bar. |
--verbose |
Print the key of each record as it is migrated. This also disables the progress bar. |
--dryrun |
Do not write any changes to new storage (except for a single test record, which is then deleted). Used for debugging and troubleshooting. |
It is recommended that you first run the migrate command with --dryrun to make sure that it can read and write to the two storage locations. The script also logs all debug messages and transactions to logs/StorageMigration.log.
Once the migration is complete and you have verified that your data is where you expect, edit the conf/config.json file one last time, and remove the old Storage object, and then rename NewStorage to Storage, effectively replacing it. Cronicle will now access your storage data from the new location. Make a backup of the file in case you ever need to roll back.
If you have multiple Cronicle servers, make sure you sync your conf/config.json between all servers! They all need to be identical.
Finally, restart Cronicle, and all should be well.
Inner Workings
This section contains details on some of the inner workings of Cronicle.
Cron Noncompliance
Cronicle has a custom-built scheduling system that is loosely based on Unix Cron. It does not, however, conform to the specification written by Paul Vixie. Namely, it differs in the following ways:
- Month days and weekdays are intersected when both are present
- If you specify both month days and weekdays, both must match for Cronicle to fire an event. Vixie Cron behaves differently, in that it will fire if either matches. This was a deliberate design decision to enable more flexibility in scheduling.
When importing Crontab syntax:
- Cronicle does not support the concept of running jobs on reboot, so the
@rebootmacro is disallowed. - If a 6th column is specified, it is assumed to be years.
- Weekdays
0and7are both considered to be Sunday.
For more details on Cronicle's scheduler implementation, see the Event Timing Object.
Storage
The storage system in Cronicle is built on the pixl-server-storage module, which is basically a key/value store. It can write everything to local disk (the default), Couchbase or Amazon S3.
Writing to local disk should work just fine for most installations, even with multi-server setups, as long as there is only one primary server. However, if you want redundant backups with auto-failover, and/or redundant data storage, then you either have to use a shared filesystem such as NFS, or switch to Couchbase or S3.
With an NFS shared filesystem, your primary and backup servers can have access to the same Cronicle data storage. Only the primary server performs data writes, so there should never be any data corruption. The easiest way to set up a shared filesystem is to configure Cronicle to point at your NFS mount in the conf/config.json file, then run the setup script. The filesystem storage location is in the base_dir property, which is found in the Storage / Filesystem objects:
{
	"Storage": {
		"engine": "Filesystem",
		"list_page_size": 50,
		"concurrency": 4,

		"Filesystem": {
			"base_dir": "/PATH/TO/YOUR/NFS/MOUNT",
			"key_namespaces": 1
		}
	}
}
Then run the setup script as instructed in the Setup section. Make sure all your backup servers have the NFS filesystem mounted in the same location, and then copy the conf/config.json file to all the servers. Do not run the setup script more than once.
Setting up Couchbase or S3 is handled in much the same way. Edit the conf/config.json file to point to the service of your choice, then run the setup script to create the initial storage records. See the Couchbase or Amazon S3 configuration sections for more details.
Logs
Cronicle writes its logs in a plain text, square-bracket delimited column format, which looks like this:
[1450993152.554][2015/12/24 13:39:12][joeretina.local][Cronicle][debug][3][Cronicle starting up][]
[1450993152.565][2015/12/24 13:39:12][joeretina.local][Cronicle][debug][4][Server is eligible to become primary (Main Group)][]
[1450993152.566][2015/12/24 13:39:12][joeretina.local][Cronicle][debug][3][We are becoming the primary server][]
[1450993152.576][2015/12/24 13:39:12][joeretina.local][Cronicle][debug][2][Startup complete, entering main loop][]
The log columns are defined as follows, from left to right:
| Log Column | Description |
|---|---|
hires_epoch |
A date/time stamp in high-resolution Epoch time. |
date |
A human-readable date/time stamp in the format: YYYY/MM/DD HH:MI:SS (local server time) |
hostname |
The hostname of the server that wrote the log entry (useful for multi-server setups if you merge your logs together). |
component |
The component name which generated the log entry. See below for a list of all the components. |
category |
The category of the log entry, which will be one of debug, transaction or error. |
code |
Debug level (1 to 10), transaction or error code. |
msg |
Debug, transaction or error message text. |
data |
Additional JSON data, may or may not present. |
The columns are configurable via the log_columns property in the conf/config.json file:
{
	"log_columns": ["hires_epoch", "date", "hostname", "component", "category", "code", "msg", "data"]
}
Feel free to reorder or remove columns, but don't rename any. The IDs are special, and match up to keywords in the source code.
By default, logging consists of several different files, each for a specific component of the system. After starting up Cronicle, you will find these log files in the log_dir directory:
| Log Filename | Description |
|---|---|
Cronicle.log |
The main component will contain most of the app logic (scheduler, jobs, startup, shutdown, etc.). |
Error.log |
The error log will contain all errors, including job failures, server disconnects, etc. |
Transaction.log |
The transaction log will contain all transactions, including API actions, job completions, etc. |
API.log |
The API component log will contain information about incoming HTTP API calls. |
Storage.log |
The storage component log will contain information about data reads and writes. |
Filesystem.log |
Only applicable if you use the local filesystem storage back-end. |
Couchbase.log |
Only applicable if you use the Couchbase storage back-end. |
S3.log |
Only applicable if you use the Amazon S3 storage back-end. |
User.log |
The user component log will contain user related information such as logins and logouts. |
WebServer.log |
The web server component log will contain information about HTTP requests and connections. |
crash.log |
If Cronicle crashed for any reason, you should find a date/time and stack trace in this log. |
install.log |
Contains detailed installation notes from npm, and the build script. |
The log_filename configuration property controls this, and by default it is set to the following:
{
	"log_filename": "[component].log",
}
This causes the value of the component column to dictate the actual log filename. If you would prefer that everything be logged to a single combo file instead, just change this to a normal string without brackets, such as:
{
	"log_filename": "event.log",
}
Keeping Time
Cronicle manages job scheduling for its events by using a "cursor" system, as opposed to a classic queue. Each event has its own internal cursor (pointer) which contains a timestamp. This data is stored in RAM but is also persisted to disk for failover. When the clock advances a minute, the scheduler iterates over all the active events, and moves their cursors forward, always trying to keep them current. It launches any necessary jobs along the way.
For events that have Run All Mode set, a cursor may pause or even move backwards, depending on circumstances. If a job fails to launch, the cursor stays back in the previous minute so it can try again. In this way jobs virtually "queue up" as time advances. When the blocking issue is resolved (resource constraint or other), the event cursor will be moved forward as quickly as resources and settings allow, so it can "catch up" to current time.
Also, you have the option of manually resetting an event's cursor using the Time Machine feature. This way you can manually have it re-run past jobs, or hop over a "queue" that has built up.
Primary Server Failover
In a Multi-Server Cluster, you can designate a number of servers as primary backups, using the Server Groups feature. These backup servers will automatically take over as primary if something happens to the current primary server (shutdown or crash). Your servers will automatically negotiate who should become primary, both at startup and at failover, based on an alphabetical sort of their hostnames. Servers which sort higher will become primary before servers that sort lower.
Upon startup there is a ~60 second delay before a primary server is chosen. This allows time for all the servers in the cluster to auto-discover each other.
Unclean Shutdown
Cronicle is designed to handle server failures. If a worker server goes down for any reason, the cluster will automatically adjust. Any active jobs on the dead server will be failed and possibly retried after a short period of time (see dead_job_timeout), and new jobs will be reassigned to other servers as needed.
If a primary server goes down, one of the backups will take over within 60 seconds (see master_ping_timeout). The same rules apply for any jobs that were running on the primary server. They'll be failed and retried as needed by the new primary server, with one exception: unclean shutdown.
When a primary server experiences a catastrophic failure such as a daemon crash, kernel panic or power loss, it has no time to do anything, so any active jobs on the server are instantly dead. The jobs will eventually be logged as failures, and the logs recovered when the server comes back online. However, if the events had Run All Mode enabled, they won't be auto-retried when the new primary takes over, because it has no way of knowing a job was even running. And by the time the old primary server is brought back online, days or weeks may have passed, so it would be wrong to blindly rewind the event clock to before the event ran.
So in summary, the only time human intervention may be required is if a primary server dies unexpectedly due to an unclean shutdown, and it had active jobs running on it, and those jobs had Run All Mode set. In that case, you may want to use the Time Machine feature to reset the event clock, to re-run any missed jobs.
API Reference
JSON REST API
All API calls expect JSON as input (unless they are simple HTTP GETs), and will return JSON as output. The main API endpoint is:
/api/app/NAME/v1
Replace NAME with the specific API function you are calling (see below for list). All requests should be HTTP GET or HTTP POST as the API dictates, and should be directed at the Cronicle primary server on the correct TCP port (the default is 3012 but is often reconfigured to be 80). Example URL:
http://myserver.com:3012/api/app/get_schedule/v1
For web browser access, JSONP response style is supported for all API calls, by including a callback query parameter. However, all responses include a Access-Control-Allow-Origin: * header, so cross-domain XHR requests will work as well.
Redirects
If you are running a multi-server Cronicle cluster with multiple primary backup servers behind a load balancer, you may receive a HTTP 302 response if you hit a non-primary server for an API request. In this case, the Location response header will contain the proper primary server hostname. Please repeat your request pointed at the correct server. Most HTTP request libraries have an option to automatically follow redirects, so you can make this process automatic.
It is recommended (although not required) that you cache the primary server hostname if you receive a 302 redirect response, so you can make subsequent calls to the primary server directly, without requiring a round trip.
API Keys
API Keys allow you to register external applications or services to use the REST API. These can be thought of as special user accounts specifically for applications. API calls include running jobs on-demand, monitoring job status, and managing the schedule (creating, editing and/or deleting events). Each API key can be granted a specific set of privileges.
To create an API Key, you must first be an administrator level user. Login to the Cronicle UI, proceed to the API Keys Tab, and click the "Add API Key..." button. Fill out the form and click the "Create Key" button at the bottom of the page.
API Keys are randomly generated hexadecimal strings, and are 32 characters in length. Example:
0095f5b664b93304d5f8b1a61df605fb
You must include a valid API Key with every API request. There are three ways to do this: include a X-API-Key HTTP request header, an api_key query string parameter, or an api_key JSON property.
Here is a raw HTTP request showing all three methods of passing the API Key (only one of these is required):
GET /api/app/get_schedule/v1?api_key=0095f5b664b93304d5f8b1a61df605fb HTTP/1.1
Host: myserver.com
X-API-Key: 0095f5b664b93304d5f8b1a61df605fb
Content-Type: application/json

{"offset": 0, "limit": 50, "api_key": "0095f5b664b93304d5f8b1a61df605fb"}
Standard Response Format
Regardless of the specific API call you requested, all responses will be in JSON format, and include at the very least a code property. This will be set to 0 upon success, or any other value if an error occurred. In the event of an error, a description property will also be included, containing the error message itself. Individual API calls may include additional properties, but these two are standard fare in all cases. Example successful response:
{ "code": 0 }
Example error response:
{"code": "session", "description": "No Session ID or API Key could be found"}
API Calls
Here is the list of supported API calls:
get_schedule
/api/app/get_schedule/v1
This fetches scheduled events and returns details about them. It supports pagination to fetch chunks, with the default being the first 50 events. Both HTTP GET (query string) or HTTP POST (JSON data) are acceptable. Parameters:
| Parameter Name | Description |
|---|---|
offset |
(Optional) The offset into the data to start returning records, defaults to 0. |
limit |
(Optional) The number of records to return, defaults to 50. |
Example request:
{
	"offset": 0,
	"limit": 1000
}
Example response:
{
	"code": 0,
	"rows": [
		{
			"enabled": 1,
			"params": {
				"script": "#!/bin/sh\n\n/usr/local/bin/db-reindex.pl\n"
			},
			"timing": {
				"minutes": [ 10 ]
			},
			"max_children": 1,
			"timeout": 3600,
			"catch_up": false,
			"plugin": "shellplug",
			"title": "Rebuild Indexes",
			"category": "general",
			"target": "c33ff006",
			"multiplex": 0,
			"retries": 0,
			"detached": 0,
			"notify_success": "",
			"notify_fail": "",
			"web_hook": "",
			"notes": "",
			"id": "29bf12db",
			"modified": 1445233242,
			"created": 1445233022,
			"username": "admin",
			"timezone": "America/Los_Angeles"
		}
	],
	"list": {
		"page_size": 50,
		"first_page": 0,
		"last_page": 0,
		"length": 12,
		"type": "list"
	}
}
In addition to the Standard Response Format, this API will include the following:
The rows array will contain an element for every matched event in the requested set. It will contain up to limit elements. See the Event Data Format section below for details on the event object properties themselves.
The list object contains internal metadata about the list structure in storage. You can probably ignore this, except perhaps the list.length property, which will contain the total number of events in the schedule, regardless if your offset and limit parameters. This can be useful for building pagination systems.
get_event
/api/app/get_event/v1
This fetches details about a single event, given its ID or exact title. Both HTTP GET (query string) or HTTP POST (JSON data) are acceptable. Parameters:
| Parameter Name | Description |
|---|---|
id |
The ID of the event you wish to fetch details on. |
title |
The exact title of the event you wish to fetch details on (case-sensitive). |
Example request:
{
	"id": "540cf457"
}
Example response:
{
	"code": 0,
	"event": {
		"enabled": 0,
		"params": {
			"script": "#!/bin/sh\n\n/usr/local/bin/s3-backup-logs.pl\n"
		},
		"timing": {
			"minutes": [ 5 ]
		},
		"max_children": 1,
		"timeout": 3600,
		"catch_up": false,
		"plugin": "shellplug",
		"title": "Backup Logs to S3",
		"category": "ad8190ff",
		"target": "all",
		"multiplex": 0,
		"retries": 0,
		"detached": 0,
		"notify_success": "",
		"notify_fail": "",
		"web_hook": "",
		"notes": "",
		"id": "540cf457",
		"modified": 1449941100,
		"created": 1445232960,
		"username": "admin",
		"retry_delay": 0,
		"cpu_limit": 0,
		"cpu_sustain": 0,
		"memory_limit": 0,
		"memory_sustain": 0,
		"log_max_size": 0,
		"timezone": "America/Los_Angeles"
	}
}
In addition to the Standard Response Format, this API will include the following:
The event object will contain the details for the requested event. See the Event Data Format section below for details on the event object properties themselves.
If Allow Queued Jobs is enabled on the event, the API response will also include a queue property, which will be set to the number of jobs currently queued up.
If there are any active jobs currently running for the event, they will also be included in the response, in a jobs array. Each job object will contain detailed information about the running job. See get_job_status below for more details.
create_event
/api/app/create_event/v1
This creates a new event and adds it to the schedule. API Keys require the create_events privilege to use this API. Only HTTP POST (JSON data) is acceptable. The required parameters are as follows:
| Parameter Name | Description |
|---|---|
title |
(Required) A display name for the event, shown on the Schedule Tab as well as in reports and e-mails. |
enabled |
(Required) Specifies whether the event is enabled (active in the scheduler) or not. Should be set to 1 or 0. |
category |
(Required) The Category ID to which the event will be assigned. See Categories Tab. |
plugin |
(Required) The ID of the Plugin which will run jobs for the event. See Plugins Tab. |
target |
(Required) Events can target a Server Group (Group ID), or an individual server (hostname). |
In addition to the required parameters, almost anything in the Event Data Object can also be included here. Example request:
{
	"catch_up": 1,
	"category": "43f8c57e",
	"cpu_limit": 100,
	"cpu_sustain": 0,
	"detached": 0,
	"enabled": 1,
	"log_max_size": 0,
	"max_children": 1,
	"memory_limit": 0,
	"memory_sustain": 0,
	"modified": 1451185588,
	"multiplex": 0,
	"notes": "This event handles database maintenance.",
	"notify_fail": "",
	"notify_success": "",
	"params": {
		"db_host": "idb01.mycompany.com",
		"verbose": 1,
		"cust": "Sales"
	},
	"plugin": "test",
	"retries": 0,
	"retry_delay": 30,
	"target": "db1.int.myserver.com",
	"timeout": 3600,
	"timezone": "America/New_York",
	"timing": {
		"hours": [ 21 ],
		"minutes": [ 20, 40 ]
	},
	"title": "DB Reindex",
	"web_hook": "http://myserver.com/notify-chronos.php"
}
Example response:
{
	"code": 0,
	"id": "540cf457"
}
In addition to the Standard Response Format, the ID of the new event will be returned in the id property.
update_event
/api/app/update_event/v1
This updates an existing event given its ID, replacing any properties you specify. API Keys require the edit_events privilege to use this API. Only HTTP POST (JSON data) is acceptable. The parameters are as follows:
| Parameter Name | Description |
|---|---|
id |
(Required) The ID of the event you wish to update. |
reset_cursor |
(Optional) Reset the event clock to the given Epoch timestamp (see Event Time Machine). |
abort_jobs |
(Optional) If you are disabling the event by setting enabled to 0, you may also abort any running jobs if you want. |
Include anything from the Event Data Object to update (i.e. replace) the values. Anything omitted is preserved. Example request:
{
	"id": "3c182051",
	"enabled": 0,
}
Example request with everything updated:
{
	"id": "3c182051",
	"reset_cursor": 1451185588,
	"abort_jobs": 0,
	"catch_up": 1,
	"category": "43f8c57e",
	"cpu_limit": 100,
	"cpu_sustain": 0,
	"detached": 0,
	"enabled": 1,
	"log_max_size": 0,
	"max_children": 1,
	"memory_limit": 0,
	"memory_sustain": 0,
	"multiplex": 0,
	"notes": "This event handles database maintenance.",
	"notify_fail": "",
	"notify_success": "",
	"params": {
		"db_host": "idb01.mycompany.com",
		"verbose": 1,
		"cust": "Marketing"
	},
	"plugin": "test",
	"retries": 0,
	"retry_delay": 30,
	"target": "db1.int.myserver.com",
	"timeout": 3600,
	"timezone": "America/New_York",
	"timing": {
		"hours": [ 21 ],
		"minutes": [ 20, 40 ]
	},
	"title": "DB Reindex",
	"username": "admin",
	"web_hook": "http://myserver.com/notify-chronos.php"
}
Example response:
{
	"code": 0
}
See the Standard Response Format for details.
delete_event
/api/app/delete_event/v1
This deletes an existing event given its ID. Note that the event must not have any active jobs still running (or else an error will be returned). API Keys require the delete_events privilege to use this API. Only HTTP POST (JSON data) is acceptable. The parameters are as follows:
| Parameter Name | Description |
|---|---|
id |
(Required) The ID of the event you wish to delete. |
Example request:
{
	"id": "3c182051"
}
Example response:
{
	"code": 0
}
See the Standard Response Format for details.
run_event
/api/app/run_event/v1
This immediately starts an on-demand job for an event, regardless of the schedule. This is effectively the same as a user clicking the "Run Now" button in the UI. API Keys require the run_events privilege to use this API. Both HTTP GET (query string) or HTTP POST (JSON data) are acceptable. You can specify the target event by its ID or exact title:
| Parameter Name | Description |
|---|---|
id |
The ID of the event you wish to run a job for. |
title |
The exact title of the event you wish to run a job for (case-sensitive). |
You can also include almost anything from the Event Data Object to customize the settings for the job. Anything omitted is pulled from the event object. Example request:
{
	"id": "3c182051"
}
Example request with everything customized:
{
	"id": "3c182051",
	"category": "43f8c57e",
	"cpu_limit": 100,
	"cpu_sustain": 0,
	"detached": 0,
	"log_max_size": 0,
	"max_children": 1,
	"memory_limit": 0,
	"memory_sustain": 0,
	"multiplex": 0,
	"notify_fail": "",
	"notify_success": "",
	"params": {
		"db_host": "idb01.mycompany.com",
		"verbose": 1,
		"cust": "Marketing"
	},
	"plugin": "test",
	"retries": 0,
	"retry_delay": 30,
	"target": "db1.internal.myserver.com",
	"timeout": 3600,
	"title": "DB Reindex",
	"username": "admin",
	"web_hook": "http://myserver.com/notify-chronos.php"
}
Note that the params object can be omitted entirely, or sparsely populated, and any missing properties that are defined in the event are automatically merged in. This allows your API client to only specify the params it needs to (including arbitrary new ones).
Example response:
{
	"code": 0,
	"ids": ["23f5c37f", "f8ac3082"]
}
In addition to the Standard Response Format, the IDs of all the launched jobs will be returned in the ids array. Typically only a single job is launched, but it may be multiple if the event has Multiplexing enabled and targets a group with multiple servers.
If Allow Queued Jobs is enabled on the event, the API response will also include a queue property, which will be set to the number of jobs currently queued up.
Advanced Tip: If you do not wish to merge the POST data into the params (for example if you are using a webhook that provides other data as JSON), then you can add &post_data=1 to the query string. If you do this, then the POST data will be available in the post_data key of the params object.
get_job_status
/api/app/get_job_status/v1
This fetches status for a job currently in progress, or one already completed. Both HTTP GET (query string) or HTTP POST (JSON data) are acceptable. Parameters:
| Parameter Name | Description |
|---|---|
id |
(Required) The ID of the job you wish to fetch status on. |
Example request:
{
	"id": "jiinxhh5203"
}
Example response:
{
	"code": 0,
	"job": {
		"params": {
			"db_host": "idb01.mycompany.com",
			"verbose": 1,
			"cust": "Marketing"
		},
		"timeout": 3600,
		"catch_up": 1,
		"plugin": "test",
		"category": "43f8c57e",
		"retries": 0,
		"detached": 0,
		"notify_success": "[email protected]",
		"notify_fail": "[email protected]",
		"web_hook": "http://myserver.com/notify-chronos.php",
		"notes": "Joe testing.",
		"multiplex": 0,
		"memory_limit": 0,
		"memory_sustain": 0,
		"cpu_limit": 0,
		"cpu_sustain": 0,
		"log_max_size": 0,
		"retry_delay": 30,
		"timezone": "America/New_York",
		"source": "Manual (admin)",
		"id": "jiiqjexr701",
		"time_start": 1451341765.987,
		"hostname": "joeretina.local",
		"command": "bin/test-plugin.js",
		"event": "3c182051",
		"now": 1451341765,
		"event_title": "Test Event 2",
		"plugin_title": "Test Plugin",
		"category_title": "Test Cat",
		"nice_target": "joeretina.local",
		"log_file": "/opt/cronicle/logs/jobs/jiiqjexr701.log",
		"pid": 11743,
		"progress": 1,
		"cpu": {
			"min": 19,
			"max": 19,
			"total": 19,
			"count": 1,
			"current": 19
		},
		"mem": {
			"min": 214564864,
			"max": 214564864,
			"total": 214564864,
			"count": 1,
			"current": 214564864
		},
		"complete": 1,
		"code": 0,
		"description": "Success!",
		"perf": "scale=1&total=90.319&db_query=3.065&db_connect=5.096&log_read=7.425&gzip_data=11.094&http_post=17.72",
		"log_file_size": 25110,
		"time_end": 1451341856.61,
		"elapsed": 90.62299990653992
	}
}
In addition to the Standard Response Format, the job details can be found in the job object.
In the job object you'll find all the standard Event Data Object properties, as well as the following properties unique to this API:
| Property Name | Description |
|---|---|
hostname |
The hostname of the server currently running, or the server who ran the job. |
source |
If the job was started manually via user or API, this will contain a text string identifying who it was. |
log_file |
A local filesystem path to the job's log file (only applicable if job is in progress). |
pid |
The main PID of the job process that was spawned. |
progress |
Current progress of the job, from 0.0 to 1.0, as reported by the Plugin (optional). |
complete |
Will be set to 1 when the job is complete, omitted if still in progress. |
code |
A code representing job success (0) or failure (any other value). Only applicable for completed jobs. |
description |
If the job failed, this will contain the error message. Only applicable for completed jobs. |
perf |
Performance metrics for the job, if reported by the Plugin (optional). Only applicable for completed jobs. |
time_start |
A Unix Epoch timestamp of when the job started. |
time_end |
A Unix Epoch timestamp of when the job completed. Only applicable for completed jobs. |
elapsed |
The elapsed time of the job, in seconds. |
cpu |
An object representing the CPU use of the job. See below. |
mem |
An object representing the memory use of the job. See below. |
Throughout the course of a job, its process CPU and memory usage are measured periodically, and tracked in these objects:
{
	"cpu": {
		"min": 19,
		"max": 19,
		"total": 19,
		"count": 1,
		"current": 19
	},
	"mem": {
		"min": 214564864,
		"max": 214564864,
		"total": 214564864,
		"count": 1,
		"current": 214564864
	}
}
The CPU is measured as percentage of one CPU core, so 100 means that a full CPU core is in use. It may also go above 100, if multiple threads or sub-processes are in use. The current value can be found in current, and the minimum (min) and maximum (max) readings are also tracked. To compute the average, divide the total value by the count.
The memory usage is measured in bytes. The current value can be found in current, and the minimum (min) and maximum (max) readings are also tracked. To compute the average, divide the total value by the count.
get_active_jobs
/api/app/get_active_jobs/v1
This fetches status for all active jobs, and returns them all at once. It takes no parameters (except an API Key of course). The response format is as follows:
{
	"code": 0,
	"jobs": {
		"jk6lmar4c01": {
			...
		},
		"jk6lmar4d04": {
			...
		}
	}
}
In addition to the Standard Response Format, the response object will contain a jobs object. This object will have zero or more nested objects, each representing one active job. The inner property names are the Job IDs, and the contents are the status, progress, and other information about the active job. For details on the job objects, see the get_job_status API call above, as the parameters of each job will be the same as that API.
update_job
/api/app/update_job/v1
This updates a job that is already in progress. Only certain job properties may be changed when the job is running, and those are listed below. This is typically used to adjust timeouts, resource limits, or user notification settings. API Keys require the edit_events privilege to use this API. Only HTTP POST (JSON data) is acceptable. The parameters are as follows:
| Parameter Name | Description |
|---|---|
id |
(Required) The ID of the job you wish to update. |
timeout |
(Optional) The total run time in seconds to allow, before the job is aborted. |
retries |
(Optional) The number of retries before the job is reported a failure. |
retry_delay |
(Optional) The number of seconds between retries. |
chain |
(Optional) Launch another event when the job completes successfully (see Chain Reaction). |
chain_error |
(Optional) Launch another event when the job fails (see Chain Reaction). |
notify_success |
(Optional) A comma-separated list of e-mail addresses to notify on job success. |
notify_fail |
(Optional) A comma-separated list of e-mail addresses to notify on job failure. |
web_hook |
(Optional) A fully-qualified URL to ping when the job completes. |
cpu_limit |
(Optional) The maximum allowed CPU before the job is aborted (100 = 1 CPU core). |
cpu_sustain |
(Optional) The number of seconds to allow the max CPU to be exceeded. |
memory_limit |
(Optional) The maximum allowed memory usage (in bytes) before the job is aborted. |
memory_sustain |
(Optional) The number of seconds to allow the max memory to be exceeded. |
log_max_size |
(Optional) The maximum allowed job log file size (in bytes) before the job is aborted. |
As shown above, you can include some of the properties from the Event Data Object to customize the job in progress. Example request:
{
	"id": "j3c182051",
	"timeout": 300,
	"notify_success": "[email protected]"
}
Example response:
{
	"code": 0
}
See the Standard Response Format for details.
abort_job
/api/app/abort_job/v1
This aborts a running job given its ID. API Keys require the abort_events privilege to use this API. Only HTTP POST (JSON data) is acceptable. The parameters are as follows:
| Parameter Name | Description |
|---|---|
id |
(Required) The ID of the job you wish to abort. |
Example request:
{
	"id": "jiinxhh5203"
}
Example response:
{
	"code": 0
}
See the Standard Response Format for details.
Event Data Format
Here are descriptions of all the properties in the event object, which is common in many API calls:
| Event Property | Format | Description |
|---|---|---|
algo |
String | Specifies the algorithm to use for picking a server from the target group. See Algorithm. |
api_key |
String | The API Key of the application that originally created the event (if created via API). |
catch_up |
Boolean | Specifies whether the event has Run All Mode enabled or not. |
category |
String | The Category ID to which the event is assigned. See Categories Tab. |
chain |
String | The chain reaction event ID to launch when jobs complete successfully. See Chain Reaction. |
chain_error |
String | The chain reaction event ID to launch when jobs fail. See Chain Reaction. |
cpu_limit |
Number | Limit the CPU to the specified percentage (100 = 1 core), abort if exceeded. See Event Resource Limits. |
cpu_sustain |
Number | Only abort if the CPU limit is exceeded for this many seconds. See Event Resource Limits. |
created |
Number | The date/time of the event's initial creation, in Epoch seconds. |
detached |
Boolean | Specifies whether Detached Mode is enabled or not. |
enabled |
Boolean | Specifies whether the event is enabled (active in the scheduler) or not. |
id |
String | A unique ID assigned to the event when it was first created. |
log_max_size |
Number | Limit the job log file size to the specified amount, in bytes. See Event Resource Limits. |
max_children |
Number | The total amount of concurrent jobs allowed to run. See Event Concurrency. |
memory_limit |
Number | Limit the memory usage to the specified amount, in bytes. See Event Resource Limits. |
memory_sustain |
Number | Only abort if the memory limit is exceeded for this many seconds. See Event Resource Limits. |
modified |
Number | The date/time of the event's last modification, in Epoch seconds. |
multiplex |
Boolean | Specifies whether the event has Multiplexing mode is enabled or not. |
notes |
String | Text notes saved with the event, included in e-mail notifications. See Event Notes. |
notify_fail |
String | List of e-mail recipients to notify upon job failure (CSV). See Event Notification. |
notify_success |
String | List of e-mail recipients to notify upon job success (CSV). See Event Notification. |
params |
Object | An object containing the Plugin's custom parameters, filled out with values from the Event Editor. See Plugins Tab. |
plugin |
String | The ID of the Plugin which will run jobs for the event. See Plugins Tab. |
queue |
Boolean | Allow jobs to be queued up when they can't run immediately. See Allow Queued Jobs. |
queue_max |
Number | Maximum queue length, when queue is enabled. See Allow Queued Jobs. |
retries |
Number | The number of retries to allow before reporting an error. See Event Retries. |
retry_delay |
Number | Optional delay between retries, in seconds. See Event Retries. |
stagger |
Number | If Multiplexing is enabled, this specifies the number of seconds to wait between job launches. |
target |
String | Events can target a Server Group (Group ID), or an individual server (hostname). |
timeout |
Number | The maximum allowed run time for jobs, specified in seconds. See Event Timeout. |
timezone |
String | The timezone for interpreting the event timing settings. Needs to be an IANA timezone string. See Event Timing. |
timing |
Object | An object describing when to run scheduled jobs. See Event Timing Object below for details. |
title |
String | A display name for the event, shown on the Schedule Tab as well as in reports and e-mails. |
username |
String | The username of the user who originally created the event (if created in the UI). |
web_hook |
String | An optional URL to hit for the start and end of each job. See Event Web Hook. |
Event Timing Object
The timing object describes the event's timing settings (when and how frequent it should run jobs). It works similarly to the Unix Cron system, with selections of years, months, days, weekdays, hours and/or minutes. Each property should be an array of numerical values. If omitted, it means the same as "all" in that category (i.e. asterisk * in Cron syntax).
For example, an event with this timing object would run once per hour, on the hour:
{
	"minutes": [0]
}
It essentially means every year, every month, every day, every hour, but only on the "0" minute. The scheduler ticks only once a minute, so this only results in running one job for each matching minute.
For another example, this would run twice daily, at 4:30 AM and 4:30 PM:
{
	"hours": [4, 16],
	"minutes": [30]
}
For a more complex example, this would run only in year 2015, from March to May, on the 1st and 15th of the month (but only if also weekdays), at 6AM to 10AM, and on the :15 and :45 of those hours:
{
	"years": [2015],
	"months": [3, 4, 5],
	"days": [1, 15],
	"weekdays": [1, 2, 3, 4, 5],
	"hours": [6, 7, 8, 9, 10],
	"minutes": [15, 45]
}
Here is a list of all the timing object properties and their descriptions:
| Timing Property | Range | Description |
|---|---|---|
years |
∞ | One or more years in YYYY format. |
months |
1 - 12 | One or more months, where January is 1 and December is 12. |
days |
1 - 31 | One or more month days, from 1 to 31. |
weekdays |
0 - 6 | One or more weekdays, where Sunday is 0, and Saturday is 6 |
hours |
0 - 23 | One or more hours in 24-hour time, from 0 to 23. |
minutes |
0 - 59 | One or more minutes, from 0 to 59. |
Development
Cronicle runs as a component in the pixl-server framework. It is highly recommended to read and understand that module and its component system before attempting to develop Cronicle. The following server components are also used:
| Module Name | Description | License |
|---|---|---|
| pixl-server-api | A JSON API component for the pixl-server framework. | MIT |
| pixl-server-storage | A key/value/list storage component for the pixl-server framework. | MIT |
| pixl-server-user | A basic user login system for the pixl-server framework. | MIT |
| pixl-server-web | A web server component for the pixl-server framework. | MIT |
In addition, Cronicle uses the following server-side PixlCore utility modules:
| Module Name | Description | License |
|---|---|---|
| pixl-args | A simple module for parsing command line arguments. | MIT |
| pixl-class | A simple module for creating classes, with inheritance and mixins. | MIT |
| pixl-config | A simple JSON configuration loader. | MIT |
| pixl-json-stream | Provides an easy API for sending and receiving JSON records over standard streams (pipes or sockets). | MIT |
| pixl-logger | A simple logging class which generates bracket delimited log columns. | MIT |
| pixl-mail | A very simple class for sending e-mail via SMTP. | MIT |
| pixl-perf | A simple, high precision performance tracking system. | MIT |
| pixl-request | A very simple module for making HTTP requests. | MIT |
| pixl-tools | A set of miscellaneous utility functions for Node.js. | MIT |
| pixl-unit | A very simple unit test runner for Node.js. | MIT |
For the client-side, the Cronicle web application is built on the pixl-webapp HTML5/CSS/JavaScript framework:
| Module Name | Description | License |
|---|---|---|
| pixl-webapp | A client-side JavaScript framework, designed to be a base for web applications. | MIT |
Installing Dev Tools
For Debian (Ubuntu) OSes:
apt-get install build-essential
For RedHat (Fedora / CentOS):
yum install gcc-c++ make
For Mac OS X, download Apple's Xcode, and then install the command-line tools.
Manual Installation
Here is how you can download the very latest Cronicle dev build and install it manually (may contain bugs!):
git clone https://github.com/jhuckaby/Cronicle.git
cd Cronicle
npm install
node bin/build.js dev
This will keep all JavaScript and CSS unobfuscated (original source served as separate files).
I highly recommend placing the following .gitignore file at the base of the project, if you plan on committing changes and sending pull requests:
.gitignore
/node_modules
/work
/logs
/queue
/data
/conf
htdocs/index.html
htdocs/js/common
htdocs/js/external/*
htdocs/fonts/*
htdocs/css/base.css
htdocs/css/c3*
htdocs/css/font*
htdocs/css/mat*
Starting in Debug Mode
To start Cronicle in debug mode, issue the following command:
./bin/debug.sh
This will launch the service without forking a daemon process, and echo the entire debug log contents to the console. This is great for debugging server-side issues. Beware of file permissions if you run as a non-root user. Hit Ctrl-C to shut down the service when in this mode.
Also, you can force it to become the primary server right away, so there is no delay before you can use the web app:
./bin/debug.sh --master
Do not use the --master switch on multiple servers in a cluster. For multi-server setups, it is much better to wait for Cronicle to decide who should become primary (~60 seconds after startup).
Please note that when starting Cronicle in debug mode, all existing events with Run All Mode set will instantly be "caught up" to the current time, and not run any previous jobs. Also, some features are not available in debug mode, namely the "Restart" and "Shut Down" links in the UI.
Running Unit Tests
Cronicle comes with a full unit test suite, which runs via the pixl-unit module (which should be installed automatically). To run the unit tests, make sure Cronicle isn't already running, and type this:
npm test
If any tests fail, please open a GitHub issue and include the full unit test log, which can be found here:
/opt/cronicle/logs/unit.log
Companies Using Cronicle
Cronicle is known to be in use by the following companies:
Colophon
We stand on the shoulders of giants. Cronicle was inspired by a PHP application called Ubercron, which was designed and programmed by Larry Azlin. Cheers Larry!
Cronicle was built using these awesome Node modules:
| Module Name | Description | License |
|---|---|---|
| async | Higher-order functions and common patterns for asynchronous code. | MIT |
| bcrypt-node | Native JS implementation of BCrypt for Node. | BSD 3-Clause |
| chart.js | Simple HTML5 charts using the canvas element. | MIT |
| daemon | Add-on for creating *nix daemons. | MIT |
| errno | Node.js libuv errno details exposed. | MIT |
| font-awesome | The iconic font and CSS framework. | OFL-1.1 and MIT |
| form-data | A library to create readable "multipart/form-data" streams. Can be used to submit forms and file uploads to other web applications. | MIT |
| formidable | A Node.js module for parsing form data, especially file uploads. | MIT |
| glob | Filesystem globber (*.js). |
ISC |
| jstimezonedetect | Automatically detects the client or server timezone. | MIT |
| jquery | JavaScript library for DOM operations. | MIT |
| mdi | Material Design Webfont. This includes the Stock and Community icons in a single webfont collection. | OFL-1.1 and MIT |
| mkdirp | Recursively mkdir, like mkdir -p. |
MIT |
| moment | Parse, validate, manipulate, and display dates. | MIT |
| moment-timezone | Parse and display moments in any timezone. | MIT |
| netmask | Parses and understands IPv4 CIDR blocks so they can be explored and compared. | MIT |
| node-static | A simple, compliant file streaming module for node. | MIT |
| nodemailer | Easy as cake e-mail sending from your Node.js applications. | MIT |
| shell-quote | Quote and parse shell commands. | MIT |
| socket.io | Node.js real-time framework server (Websockets). | MIT |
| socket.io-client | Client library for server-to-server socket.io connections. | MIT |
| uglify-js | JavaScript parser, mangler/compressor and beautifier toolkit. | BSD-2-Clause |
| zxcvbn | Realistic password strength estimation, from Dropbox. | MIT |
License
The MIT License (MIT)
Copyright (c) 2015 - 2018 Joseph Huckaby
Permission is hereby granted, free of charge, to any person obtaining a copy of this software and associated documentation files (the "Software"), to deal in the Software without restriction, including without limitation the rights to use, copy, modify, merge, publish, distribute, sublicense, and/or sell copies of the Software, and to permit persons to whom the Software is furnished to do so, subject to the following conditions:
The above copyright notice and this permission notice shall be included in all copies or substantial portions of the Software.
THE SOFTWARE IS PROVIDED "AS IS", WITHOUT WARRANTY OF ANY KIND, EXPRESS OR IMPLIED, INCLUDING BUT NOT LIMITED TO THE WARRANTIES OF MERCHANTABILITY, FITNESS FOR A PARTICULAR PURPOSE AND NONINFRINGEMENT. IN NO EVENT SHALL THE AUTHORS OR COPYRIGHT HOLDERS BE LIABLE FOR ANY CLAIM, DAMAGES OR OTHER LIABILITY, WHETHER IN AN ACTION OF CONTRACT, TORT OR OTHERWISE, ARISING FROM, OUT OF OR IN CONNECTION WITH THE SOFTWARE OR THE USE OR OTHER DEALINGS IN THE SOFTWARE.