All Projects → gmamaladze → D3 Dot Graph

gmamaladze / D3 Dot Graph

Licence: mit
This module provides D3js compatible library to parse and load files in graphviz DOT (.dot) (graph description language) format.

Projects that are alternatives of or similar to D3 Dot Graph

D3js doc
D3js中文文档 D3中文 📊 📈 🎉
Stars: ✭ 1,599 (+6852.17%)
Mutual labels:  d3, d3js, d3v4
d3.geometer
[NOT MAINTAINED] A D3js library for drawing polytopes, angles, coordinates, geometries and more.
Stars: ✭ 18 (-21.74%)
Mutual labels:  d3, d3v4, d3js
D3
This is the repository for my course, Learning Data Visualization with D3.js on LinkedIn Learning and Lynda.com.
Stars: ✭ 64 (+178.26%)
Mutual labels:  d3, d3js, d3v4
D3 Es6
D3 力导向图 增删改动态更新数据 点击生成节点 拖拽生成连线...
Stars: ✭ 155 (+573.91%)
Mutual labels:  d3, d3js, d3v4
D3tutorial
📊📈 A D3 v6 tutorial - interactive bar chart and multiple coordinated views (MCV)
Stars: ✭ 163 (+608.7%)
Mutual labels:  d3, d3js, d3v4
k8s-graph
Visualize your Kubernetes (k8s) cluster
Stars: ✭ 23 (+0%)
Mutual labels:  d3, d3v4, d3js
V Chart Plugin
Easily bind a chart to the data stored in your Vue.js components.
Stars: ✭ 188 (+717.39%)
Mutual labels:  d3, d3js, d3v4
D3 Graphviz
Graphviz DOT rendering and animated transitions using D3
Stars: ✭ 901 (+3817.39%)
Mutual labels:  graphviz, d3, d3v4
leaflet heatmap
简单的可视化湖州通话数据 假设数据量很大,没法用浏览器直接绘制热力图,把绘制热力图这一步骤放到线下计算分析。使用Apache Spark并行计算数据之后,再使用Apache Spark绘制热力图,然后用leafletjs加载OpenStreetMap图层和热力图图层,以达到良好的交互效果。现在使用Apache Spark实现绘制,可能是Apache Spark不擅长这方面的计算或者是我没有设计好算法,并行计算的速度比不上单机计算。Apache Spark绘制热力图和计算代码在这 https://github.com/yuanzhaokang/ParallelizeHeatmap.git .
Stars: ✭ 13 (-43.48%)
Mutual labels:  d3, d3js
turkeyvisited
Mark the cities you have visited in Turkey and share the map!
Stars: ✭ 82 (+256.52%)
Mutual labels:  d3, d3js
Party Mode
An experimental music visualizer using d3.js and the web audio api.
Stars: ✭ 690 (+2900%)
Mutual labels:  d3, d3js
game of life-elixir
An implementation of Conway's Game of Life in Elixir
Stars: ✭ 22 (-4.35%)
Mutual labels:  d3, d3js
flask-react-d3-celery
A full-stack dockerized web application to visualize Formula 1 race statistics from 2016 to present, with a Python Flask server and a React front-end with d3.js as data visualization tool.
Stars: ✭ 20 (-13.04%)
Mutual labels:  d3v4, d3js
D3fc
A collection of components that make it easy to build interactive charts with D3
Stars: ✭ 898 (+3804.35%)
Mutual labels:  d3, d3js
align covid
Coronavirus time series aligned by number of cases, not date.
Stars: ✭ 22 (-4.35%)
Mutual labels:  d3, d3js
multi-verse
lit-element components for fast and modular multivariate analysis
Stars: ✭ 34 (+47.83%)
Mutual labels:  d3, d3v4
d3-ng2-demo
Reusable visual power? A demo of using D3 version 4 with Angular 2+.
Stars: ✭ 53 (+130.43%)
Mutual labels:  d3, d3v4
billboard
🎤 Lyrics/associated NLP data for Billboard's Top 100, 1950-2015.
Stars: ✭ 53 (+130.43%)
Mutual labels:  d3, d3js
d3-sankey-circular
A fork of the d3-sankey library to allow circular links.
Stars: ✭ 65 (+182.61%)
Mutual labels:  d3, d3v4
D3.v4 Api Translation
D3.js 4.x 中文手册
Stars: ✭ 751 (+3165.22%)
Mutual labels:  d3js, d3v4

d3-dot-graph

This module provides D3js compatible library to parse and load files in graphviz DOT (.dot) (graph description language) format.

why?

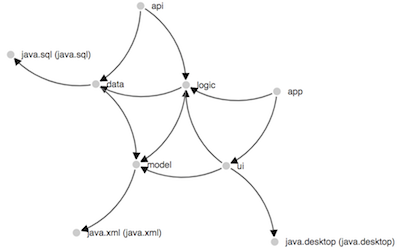
While working on Java Platform Module System migration projects coming with Java 9 (as of August 2017), I am heavily using jdeps which is generating DOT (.dot) files. These are usually visualised using dot tool of graphviz.

In most cases it is enough, but I wanted to have nicer D3js visualisation and interaction.

example

See sample summary.dot file generated by jdeps visualised using D3js here: index.html

Inspired by Mike Bostock's Mobile Patent Suits

usage

d3.dot(url, callback);

Usage is identical with well known d3.json([url], [callback]) or d3.csv([url], [callback]).

<script src="https://cdn.jsdelivr.net/gh/gmamaladze/[email protected]/build/d3-dot-graph.min.js"></script>
<script>

d3.dot("/path/to/graph.dot", function(error, graph) {
  if (error) throw error;
  console.log(JSON.stringify(graph, null, true));
  //{
  //  "nodes": [ {"id": "Myriel"}, {"id": "Napoleon"}],
  //  "links": [ {"source": "Myriel"}, {"target": "Napoleon"}]
  //}  
});

</script>

parser

The parser was generated using PEG.js. The grammer is taken from here cpettitt/graphlib-dot. Thanks to Chris Pettitt.

You can also use parser independently from loader and converter.

build

npm install     #install dependencies and build
npm run build   #generate parser, and rollup

rollup -c -w (rollup --config --watch) #very convenient rolls the whenever sources are changed
Note that the project description data, including the texts, logos, images, and/or trademarks, for each open source project belongs to its rightful owner. If you wish to add or remove any projects, please contact us at [email protected].