jiangtiantu / Factorhub
Labels
Projects that are alternatives of or similar to Factorhub

factorhub 因子交换小组
factorhub这个小组可能只适合做过多因子组合或因子挖掘的朋友。
我做了大半年的因子挖掘,然后总结出一个规律,没有好的数据,没有丰富的因子库是做不出好的超额的。所以我有个野一点的想法。我想建立一个小组,大家互相认可的话,可以交换下自己手上的因子,你们自己组队,沟通。或者我来介绍沟通都行,平等自愿。我微信debin16
我这边的话,开源了自己的因子框架,从数据库,到因子分析,都开源了(虽然是个小辣鸡)。但因子定义文件,我想以交换的方式互相交流。我愿意拿自己手上的3个因子换对方1个因子。每个因子的分层曲线,和多空收益我放在了factorfig 文件夹里。大家想要哪些因子可以挑。互相认可,我们就交换。
千粉大佬们愿意帮我推荐分享的话,我也愿意把因子文件直接送给您;有大佬愿意一起参与这个项也非常欢迎,互通有无。
因子框架
我代码很烂,水平也差。大佬们有意见随意提,我后面学习了就改进,也怕自己误人子弟。
**1.data:**一个简陋的数据库,以hdf5文件保存。提供基础数据,用于因子计算,和回测计算收益。建议自己本地安装好quantaxis,即可自行下载数据。 https://github.com/QUANTAXIS/QUANTAXIS
2.factor: 计算好的因子数据,以pkl 文件保存,文件太大,我上传到了百度网盘 链接: https://pan.baidu.com/s/1HcRxXkHZ6ytyx6UThR5tcg 提取码: cust
3.analysis:因子分析工具,目前只开源了两个功能,分层画图,和计算超额
具体流程是:
#读取数据
datapath='E:\\Users\\Desktop\\factorhub\\data\\'
factorpath='E:\\Users\\Desktop\\factorhub\\factors\\'

data_hfq=pd.read_hdf(datapath+'data_hfq.h5','data_hfq')
data_bfq=pd.read_hdf(datapath+'data_bfq.h5','data_bfq')
`#对数据进行基本的处理`
`Open     = data_hfq["open"].unstack()`
`Close    = data_hfq["close"].unstack()`
`High     = data_hfq["high"].unstack()`
`Low      = data_hfq["low"].unstack()`
`Vol      = data_hfq["volume"].unstack()`
`Amount   = data_hfq["amount"].unstack()`
`chg_1_d  = Close.pct_change()`
`stock_info=QA.QA_fetch_stock_info(code=Open.columns.to_list())`
`sz       = data_bfq['close'].unstack().mul(stock_info["zongguben"],axis=1)`
`ltsz     = data_bfq['close'].unstack().mul(stock_info["liutongguben"],axis=1)`
`vwap     = Amount/Vol/100`
#去除涨跌停,去除停牌股
tradeable=data_bfq['amount'].apply(lambda x :1 if x>0 else np.nan)*(data_bfq['high']-data_bfq['low']).apply(lambda x :1 if x!=0 else np.nan)*chg_1_d.stack().apply(lambda x :1 if x<0.100 else np.nan)
tradeable=tradeable.unstack()
#获取基准
Benchmark=QA.QA_fetch_index_day_adv('000905',tradeable.index[0],tradeable.index[-1]).close
Benchmark.index=(Benchmark.index).get_level_values(0)
Benchmark=(Benchmark.pct_change(1)).shift(-1)
megedata=pd.DataFrame()
# megedata["period"]=Close.pct_change(1).shift(-1).stack()#以收盘价交易
megedata["period"]=Open.pct_change().shift(-2).stack()#以开盘价交易
#定义一个因子
def factor_simple():
    factor=-1*Close.pct_change(5)
 return factor
test_factor=factor_simple()
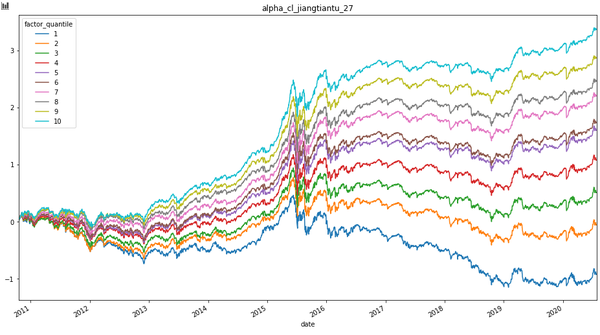
#分层画图
test_factor=test_factor.replace([np.inf, -np.inf], np.nan)
clean_factor_data=megedata
input_factor= test_factor*tradeable
input_factor=input_factor.stack()
clean_factor_data["factor"]=input_factor
clean_factor_data=clean_factor_data.dropna()

clean_factor_data["factor_quantile"]=clean_factor_data["factor"].groupby(level=0).apply(lambda x :((pd.qcut(x.rank(), 10, labels=False,duplicates='drop') + 1)))
df_factor_quantile=clean_factor_data.reset_index().groupby(['date','factor_quantile'])["period"].mean().unstack().cumsum()
df_factor_quantile.plot(figsize=(16,9),title="test_factor")
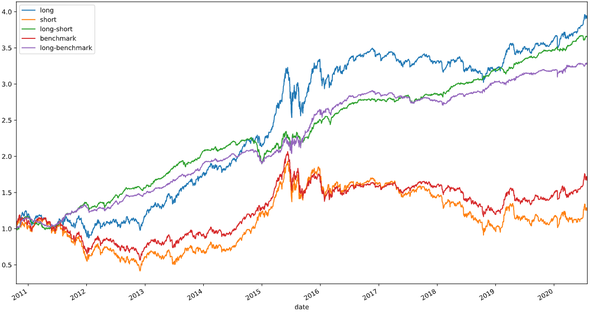
#不算复利,计算对冲收益
group_num=10
commision_fee=0.0

test_factor=test_factor.replace([np.inf, -np.inf], np.nan)
clean_factor_data=megedata
input_factor= test_factor*tradeable
input_factor=input_factor.stack()


clean_factor_data["factor"]=input_factor
clean_factor_data=clean_factor_data.dropna()
clean_factor_data["factor_quantile"]=clean_factor_data["factor"].groupby(level=0).apply(lambda x :((pd.qcut(x.rank(), 10, labels=False,duplicates='drop') + 1)))

long_portfolio_data = clean_factor_data[clean_factor_data['factor_quantile'] == group_num]
short_portfolio_data = clean_factor_data[clean_factor_data['factor_quantile'] == 1]

long_portfolio_rate_of_return = long_portfolio_data['period'].mean(level=0) - commision_fee
short_portfolio_rate_of_return = short_portfolio_data['period'].mean(level=0) - commision_fee
hedged_rate_of_return = long_portfolio_rate_of_return - short_portfolio_rate_of_return - 2 * commision_fee
hedged_with_Benchmark_return = long_portfolio_rate_of_return - Benchmark - commision_fee

long_cumulative_return = 1+long_portfolio_rate_of_return.cumsum()
short_cumulative_return = 1+short_portfolio_rate_of_return.cumsum()
hedged_cumulative_return = 1+hedged_rate_of_return.cumsum()
Benchmark_cumulative_return = 1+Benchmark.cumsum()
hedged_with_Benchmark_cumulative_return = 1+hedged_with_Benchmark_return.cumsum()

Return = pd.concat([long_cumulative_return,short_cumulative_return, hedged_cumulative_return, Benchmark_cumulative_return,hedged_with_Benchmark_cumulative_return], axis=1)
Return.columns = ['long','short','long-short','benchmark','long-benchmark']

Return=Return.dropna()
Return.plot(figsize=(16,9),title="test—factor")
基本上你自己定义一个因子,之后就直接开始研究了。我这个框架是学习alphalens 写的,因为alphalens 太慢了,所以,就自己实现了,要快些。没有做任何封装,理解起来容易些。虽然代码懒,但大概的步骤是没有错的,所有曲线没有计算手续费,没有计算对冲成本。
4.factor_born: 因子自动生成算法,基于deap,暂未开源 5.factor_fig: 因子分层曲线和超额收益曲线(全部按照单利计算) **6.mfm_operator:**一个算子文件,定义了些常见的算子
And More ?
欢迎加入quanthub 社区