jrochkind / Fake_work_app
Programming Languages
Comparing MRI Rails App Server Performance on Heroku
- Or, Comparing request concurrency models
- Or, How I learned to stop worrying about the GIL and love multi-threaded concurrent request dispatch
by Jonathan Rochkind, http://bibwild.wordpress.com
Benchmarking of this sort can be tricky to do validly, and ends up depending on assumptions -- explicit and implicit -- of your model and environment. Even trickier when concurrency is involved. This should be considered preliminary results, here submitted for peer review to the community. (hackernews thread)
I was interested in
- MRI 1.9.3 (yes, MRI, with the GIL),
- Rails 3.2 with
config.threadsafe!set, so the app can have requests dispatched with multi-threaded concurrency. The equivalent toconfig.threadsafe!is always on in Rails 4. - Testing a Rails app that is heavily I/O bound rather than CPU bound -- most of my web apps are such.
- Testing performance under relatively heavy concurrent load, to get at the limits of how much a dyno can handle under alternate scenarios.
- On a single free heroku dyno (cause I didn't want to pay for time for this experiment)
It appears that Puma provides the best performance characteristics. By far. Especially under puma 2.x "clustered" hybrid multi-process/multi-threaded mode, but even under single-process multi-threaded mode. Yes, even for MRI with the GIL, for an IO-bound app.
- For IO-bound apps, you can likely get a lot more out of your heroku web dynos with multi-threaded request dispatch -- that is, puma and (rails3) config.threadsafe! , using puma's new clustered mode for multiple workers as well. The more I/O-waiting your app does as a proportion of its response time, the higher the likely advantage; advantage doesn't disappear unless you have really minimal iowait.
Multi-threaded request dispatch is not just for jruby. I am hoping this discussion increases interest and experimentation with multi-threading under MRI, especially multi-threaded request dispatch of web apps.
Read on for details.
Background
- In the 'traditional' means of deploying a Rails app, an individual Rails process can only handle one request at a time. From when the request comes in until the response is delivered -- that's all the app can do. If other requests come in during this time, they need to be kept in a queue waiting, and then they are handled one at a time, serially.
This is not a very efficient use of CPU resources, it does not maximize work for given available CPU -- especially when some of that 'blocked' time is spent waiting on external I/O, as is typical in a web app.
It also can lead to very uneven response times, as some requests end up spending a lot of time on a queue waiting to be processed, and others don't. Uneven response times can provide bad experiences for users in near the upper end of waiting, and uneven response times at the level of individual rails processes due to queuing can become even more uneven under round robin or random load balancing between processes, as in the heroku routing debacle.
-
The oldest way of dealing with this is in Rails Land is with a multi-process concurrency model. Each Rails process can still only handle one request at a time, serially, but you run multiple processes (aka, multiple workers). Perhaps as many workers as you have CPU cores, perhaps even more than that -- if you can afford the RAM.
- This is the model Heroku currently recommends, post-debacle: Using Unicorn to run 2-4 rails processes per dyno, then of course scaling out multiple web dynos as well.
-
Another request-dispatching concurrency model is multi-threaded concurrency. Allow an individual Rails process to actually handle multiple requests concurrently, each in a separate thread. This has recently started to receive more attention, although has historically received less attention in Rails Land.
- Because back in the bad old days, MRI handled threads rather inefficiently. No longer so much of an issue with MRI 1.9.x using OS-native threads, or other ruby interpreters like jruby.
- Because back in the bad old days, Rails wasn't thread-safe under multi-threaded request dispatching: At first by lack of design, later by lack of robust bug-free code. This isn't so much true anymore either, recent Rails is much more robust under multi-threaded request dispatching. In Rails 3.2, you still need to set
config.threadsafe!to allow this, in Rails 4.x it's always on -- if the app server supports it. - Because in MRI, the most popular ruby interpreter, there is the "Global Interpreter Lock" -- which keeps more than one ruby thread from executing simultaneously on more than one CPU core. And the misconception that this means there is no purpose to multi-threaded request dispatching under MRI. But there still is: a thread waiting on I/O can still be switched out to allow another thread to do work on the single core, making better use of CPU and evening out response times. And many web apps spend a lot of time waiting on I/O for the database, other local services, or third party APIs. Multi-threading and OS level threads were invented in a largely single CPU world, they still have a use there; just like the original multi-process OS model.
Both multi-process model and multi-thread model have plusses and minuses.
- The multi-thread model does require the application code itself to be thread-safe under multi-threaded request dispatching. Which basically just means avoiding or synchronizing on writing to any global/class-level state. And the multi-thread model can only make use of one CPU under MRI.
- But the multi-process model can't handle nearly as much concurrency without using gigantic amounts of RAM. Threads were originally invented as a lighter-weight method of concurrency than processes, even in a single-CPU-core world.
Additionally, there is what one of the authors of Phusion Passenger called a "hybrid model", where you have multiple worker processes, each of which dispatches multi-threaded. This has its own plusses and minuses -- but may make a lot of sense for MRI with the GIL specifically, as you can have one process per core to try and maximize use of cores even under MRI; but then have each process dispatching multi-threaded, to maximize throughput under I/O waiting, and even out response times.
- That link above is worth following up for another explanation of all this, if you're still confused and want it in someone else's words.
- Since that Stack Overflow answer above was written, a major player using this 'hybrid' model in addition to Phusion Passenger Enterprise has arrived: Puma 2.x with "clustered" mode, puma 2.0 released april 29 2013. In Phusion Passenger, the hybrid model is only available in the non-free Enterprise variant; Puma is in general more realistic to run on heroku. (I do not believe you can run passenger on heroku, at least not in any way that would make sense). Puma's new support for this mode hasn't gotten as much attention as I would have expected.
While Heroku is currently recommending a multi-process model with Unicorn, I suspected that, if your app can be run safely under multi-threaded request dispatch, a multi-threaded model would actually provide better throughput -- and the 'hybrid' model best of all, under MRI or any other interpreter with a GIL. That prompted this benchmarking.
The demo app and load
This repo holds the demo app I deployed to heroku, to benchmark under different app server scenarios.
It's set up to fake a response with certain characteristics:
- Tightly looping until 50 ms to simulate around 50ms of CPU activity.
- Sleeping for 250 ms to simulate around 250 ms of waiting on I/O
- Then returning an approximately 20k byte response. (Text-only, no JS/CSS assets, asset pipeline or otherwise)
This might seem a fairly slow app, but is basically representative of many of my apps, which are this slow or slower, and spend most of their time in iowait. It's possible in retrospect I overestimated the iowait/cpu proportion or total time of response for modeling real apps, I'm not sure.
The app doesn't use and doesn't even load ActiveRecord, it just simulates work as above.
I deployed this app to a single (free) heroku web dyno under a variety of app server scenarios -- there is a branch in the repo for each scenario benchmarked.
While the heroku routing debacle really depends on multiple web dynos to fully exhibit, I didn't want to pay for it or deal with the added complexity. One step at a time; I think one dyno still is illustrative and can be extrapolated; I hope someone else (such as heroku themselves, who can have people do this as part of their well-compensated day jobs!) takes more steps.
I used ab to benchmark, in part because it was the only simple tool I found that reported percentiles and standard deviations and such, not just means. And it supports concurrency -- when executing concurrent benchmarking tests, I had ab at a concurrency level of 10, which is definitely pretty high for a single heroku dyno regardless of app server -- I'm testing at a pretty high level of load, maybe an overwhelming one. In retrospect, maybe it would have made sense to test at less concurrency? I didn't have the time/energy to test each scenario at multiple levels -- yet, anyway (you interested, dear reader?).
My hypothesis was definitely that the 'hybrid'/'clustered' mode puma was going to be surprisingly good, and indeed I had an agenda here, to increase discussion of this hybrid concurrency model for MRI Rails apps. Hopefully my methodology is still a fairly reasonable model of a typical rails app, but feedback welcome.
Case by case results
Base case, simple non-concurrent WEBrick.
Just to get a starting point control sanity-check, deployed to heroku without any specified app server at all, which means just using the not-considered-production-ready WEBrick server. And without actually putting config.threadsafe! in the Rails 3.2 app. There should be no concurrency at all. (This code without config.threadsafe! isn't actually in a branch, but it was at commit 21b2e2997b309)
And in fact, run ab without concurrency either -- just get our feet wet with a baseline.
(In this and all others, some text excerpted from ab output)
$ ab -n 500 -c 1 http://sleepy-stream-3236.herokuapp.com/fake_work

Concurrency Level:      1
Time taken for tests:   193.269128 seconds
Complete requests:      500
Failed requests:        0
Write errors:           0
Total transferred:      10247500 bytes
HTML transferred:       10045500 bytes
Requests per second:    2.59 [#/sec] (mean)
Time per request:       386.538 [ms] (mean)
Time per request:       386.538 [ms] (mean, across all concurrent requests)
Transfer rate:          51.78 [Kbytes/sec] received

Connection Times (ms)

              min  mean[+/-sd] median   max

Connect:        7    7   0.3      7      10
Processing:   326  378  84.0    353    1178
Waiting:      319  368  83.5    342    1170
Total:        333  385  84.0    360    1185

Percentage of the requests served within a certain time (ms)

  50%    360
  66%    374
  75%    386
  80%    395
  90%    453
  95%    537
  98%    696
  99%    739
 100%   1185 (longest request)
As our app fakes 50ms of cpu + 250ms of iowait == 300ms, we get the approximately 300ms times we expect at the median. An extra 60ms is presumably Rails and heroku and network overhead.
I'm honestly not quite sure why the 90th and above percentiles are slower, I'd expect even more consistent response times here, since we don't have ab executing concurrent requests, just one at a time, you'd expect each one to just take the standard time. Not really sure. Environmental (eg network) variation?
WEBrick, no config.threadsafe, but have ab be concurrent
The app is still handling requests totally serially, one at a time, but we have ab executing 10 concurrent requests at a time. We expect the app to get crushed, and it does.
$ ab -n 500 -c 10 http://sleepy-stream-3236.herokuapp.com/fake_work

Concurrency Level:      10
Time taken for tests:   50.796689 seconds
Complete requests:      500
Failed requests:        0
Write errors:           0
Total transferred:      10247500 bytes
HTML transferred:       10045500 bytes
Requests per second:    9.84 [#/sec] (mean)
Time per request:       1015.934 [ms] (mean)
Time per request:       101.593 [ms] (mean, across all concurrent requests)
Transfer rate:          197.00 [Kbytes/sec] received


Connection Times (ms)
              min  mean[+/-sd] median   max
Connect:        6    6   0.7      6      13
Processing:   446 1001 474.8    852    3892
Waiting:      439  990 474.9    844    3885
Total:        452 1008 474.8    858    3898

Percentage of the requests served within a certain time (ms)
  50%    858
  66%   1031
  75%   1155
  80%   1227
  90%   1569
  95%   2002
  98%   2570
  99%   2964
 100%   3898 (longest request)
Even the median is over 2x as long as under serial load, and the results are highly uneven, with the slowest results being horribly slow. This is what happens when you throw a bunch of concurrent requests at a single one-request-at-a-time rails process.
WEBRick under multi-threaded concurrency, really?
Turning on config.threadsafe! in the app (master branch), with the same ab, we are reminded that, oh hey, what do you know, WEBRick can do multi-threaded concurrency, wow!
$ ab -n 500 -c 10 http://sleepy-stream-3236.herokuapp.com/fake_work

Concurrency Level:      10
Time taken for tests:   35.717240 seconds
Complete requests:      500
Failed requests:        0
Write errors:           0
Total transferred:      10247500 bytes
HTML transferred:       10045500 bytes
Requests per second:    14.00 [#/sec] (mean)
Time per request:       714.345 [ms] (mean)
Time per request:       71.434 [ms] (mean, across all concurrent requests)
Transfer rate:          280.17 [Kbytes/sec] received

Connection Times (ms)
              min  mean[+/-sd] median   max
Connect:        7    7   0.9      7      21
Processing:   393  702 226.3    662    2046
Waiting:      385  691 224.7    651    2010
Total:        400  709 226.3    669    2053

Percentage of the requests served within a certain time (ms)
  50%    669
  66%    725
  75%    762
  80%    795
  90%    908
  95%   1033
  98%   1563
  99%   1887
 100%   2053 (longest request)
A surprising improvement over WEBrick without config.threadsafe!, but still not all that great. And even if we liked the performance characteristics, nobody considers WEBrick reliable and secure enough for production.
These WEBrick tests were just the pre-game, getting some baseline numbers.
Thin
Heroku used to recommend thin, I think? Let's see how thin does. No heroku Procfile, heroku will just pick up and use thin under default arguments when we've added it to the Gemfile. Under these default arguments, thin won't do multi-threaded request dispatch either....
$ ab -n 500 -c 10 http://sleepy-stream-3236.herokuapp.com/fake_work

Concurrency Level:      10
Time taken for tests:   152.551544 seconds
Complete requests:      500
Failed requests:        0
Write errors:           0
Total transferred:      10234069 bytes
HTML transferred:       10045500 bytes
Requests per second:    3.28 [#/sec] (mean)
Time per request:       3051.031 [ms] (mean)
Time per request:       305.103 [ms] (mean, across all concurrent requests)
Transfer rate:          65.51 [Kbytes/sec] received

Connection Times (ms)
              min  mean[+/-sd] median   max
Connect:        6    6   0.4      6       8
Processing:   919 3030 121.7   3036    3675
Waiting:      332 3008 179.9   3027    3657
Total:        926 3036 121.6   3042    3681

Percentage of the requests served within a certain time (ms)
  50%   3042
  66%   3048
  75%   3054
  80%   3059
  90%   3098
  95%   3133
  98%   3156
  99%   3170
 100%   3681 (longest request)
Well, it's consistent, we can say that for it, it's successfully evening out the response times. longest request isn't that much longer than median.
Each one is around 10x the single request time -- which makes a certain sense, cause we've sent 10 concurrent requests at a time against a server that can only handle one-by-one serially. If our app was cpu-bound, this would make perfect sense, and maybe even be considered a feature to keep response times so even under load (this consistency is what I'd expect, but am not getting, from multi-threaded solutions below). But our app isn't cpu bound, so i'm not quite sure what leads to this kind of performance.
Apart from explanations, as far as actual use would be concerned -- yeah, this is pretty bad performance characteristics compared to our other options, for this mock demo app anyway.
Not interested: thin with an evented web app
Thin is really made for another concurrency mode, 'evented'. If our simulated I/O with 'sleep' used an EventMachine loop to implement its sleep instead, I'd predict thin would shine.
But that's the thing, to apply the evented concurrency model at the application level though, to make our Rails app actually benefit from it in these terms -- it requires every part of the app that deals with I/O to be written specially. Not just the actual HTTP client/server interactions, but database queries, third party API's, etc. For instance using alternate versions of various gems, which can go wrong in novel and unfamiliar ways. I don't consider this feasible for a Rails app, and think that's why despite some attention over the last few years, it hasn't caught on much for Rails apps, and some have changed their minds about its general utility. I am not interested in it. It's a non-starter for me. (But others have disagreed; feel free to benchmark it yourself if you like!)
Don't get me wrong, there's a place for reactor-evented code in ruby, mainly in specialized, technical, encapsulated places. For instance, Passenger 3.x now uses an "evented I/O core"; bully for it; but it's basically a hidden implementation detail, designed to improve performance of the internal passenger request queue -- but invisible to the app you are deploying and requiring no changes in it. Celluloid similarly uses a reactor pattern 'under the hood' for performance of it's internals, in ways kept invisible to actual Celluloid client code. thin might do the same thing... but if it does, it hasn't helped our ordinary non-rewritten-with-EventMachine Rails app much, has it?
Okay, let's try thin threaded
Our first foray (not counting WEBrick!) into an actual multi-threaded concurrent request dispatching app server -- it turns out thin has a threaded mode too. It's not documented well, and it's unclear if it's considered ready-for-prime-time. I could swear I had a listserv post from thin developers saying they thought threaded mode was ready for production in recent thins, but now I can't find it, maybe I was wrong. But let's try it anyway, just for kicks. I'm not really sure how many threads are in thin's threadpool by default, it's not documented well.
A heroku procfile like: web: bundle exec thin start --threaded -p $PORT
$ ab -n 500 -c 10 http://sleepy-stream-3236.herokuapp.com/fake_work


Concurrency Level:      10
Time taken for tests:   74.921631 seconds
Complete requests:      500
Failed requests:        0
Write errors:           0
Total transferred:      10234056 bytes
HTML transferred:       10045500 bytes
Requests per second:    6.67 [#/sec] (mean)
Time per request:       1498.433 [ms] (mean)
Time per request:       149.843 [ms] (mean, across all concurrent requests)
Transfer rate:          133.39 [Kbytes/sec] received

Connection Times (ms)
              min  mean[+/-sd] median   max
Connect:        6    6   1.1      7      13
Processing:   366 1449 2271.6    638   12268
Waiting:      358 1440 2271.1    630   12260
Total:        373 1456 2271.6    645   12275

Percentage of the requests served within a certain time (ms)
  50%    645
  66%    743
  75%    856
  80%    947
  90%   5444
  95%   7081
  98%  11705
  99%  11995
 100%  12275 (longest request)
The median is not great, at 2x serial response time, about the same as WEBrick. But Holy Standard Deviation Batman, how about that variation, the 80th percentile, 90th percentile, and up, just get truly awful. Okay, maybe thin threaded mode isn't ready for production.
Unicorn: Multi-process
We're going to use Heroku's recommended Unicorn configuration with 3 worker processes.
Unicorn can't do multi-threaded request dispatch, so while we left config.threadsafe! on in our app, it won't actually do anything, each Unicorn worker will still keep requests in a queue and only let the app have them one at a time, serially. yeah, that kind of shows.
$ ab -n 500 -c 10 http://sleepy-stream-3236.herokuapp.com/fake_work

Concurrency Level:      10
Time taken for tests:   50.863931 seconds
Complete requests:      500
Failed requests:        0
Write errors:           0
Total transferred:      10220000 bytes
HTML transferred:       10045500 bytes
Requests per second:    9.83 [#/sec] (mean)
Time per request:       1017.279 [ms] (mean)
Time per request:       101.728 [ms] (mean, across all concurrent requests)
Transfer rate:          196.21 [Kbytes/sec] received

Connection Times (ms)
              min  mean[+/-sd] median   max
Connect:        6    6   0.5      6      14
Processing:   326 1001 119.3    971    1514
Waiting:      318  993 118.8    962    1505
Total:        332 1007 119.3    977    1520

Percentage of the requests served within a certain time (ms)
  50%    977
  66%   1003
  75%   1118
  80%   1125
  90%   1157
  95%   1181
  98%   1213
  99%   1240
 100%   1520 (longest request)
Nearly 1 second -- 3x the straight serial response time -- at the median. Not too great, 50% worse than thin threaded, about the same as WEbrick. Although the variation is relatively tight, much better than thin, with 99th percentile being less than 1.5 median. But not necessarily awful -- we are throwing a whole bunch of load at this poor dyno, with 10 concurrent requests at a time.
But we definitely see here the limits of pure multi-process model under very heavy concurrent IO-bound load. Yep. If we had 10 unicorn processes that would probably handle our 10 concurrent requests a lot better, but that would require more heroku dynos, one dyno isn't going to have the RAM for that. (In our io-bound simulation, RAM is the limiting factor here, not so much cores)
Unicorn with 4 workers?
How many workers you can fit in a heroku dyno depends on the app. You might not always even be able to fit 3. But in our tiny app, we can probably fit 4, even in a standard size dyno (Heroku introduced 'large' sized dynos with more RAM, just for this case of fitting more workers in one dyno).
And while it's not documented, heroku dynos seem to have 4 CPU cores. (Try a heroku run cat /proc/cpuinfo). So let's try 4 unicorn workers, to at least try to use all 4 cores despite our MRI GIL.
$ ab -n 500 -c 10 http://sleepy-stream-3236.herokuapp.com/fake_work

Concurrency Level:      10
Time taken for tests:   39.410287 seconds
Complete requests:      500
Failed requests:        0
Write errors:           0
Total transferred:      10220115 bytes
HTML transferred:       10045500 bytes
Requests per second:    12.69 [#/sec] (mean)
Time per request:       788.206 [ms] (mean)
Time per request:       78.821 [ms] (mean, across all concurrent requests)
Transfer rate:          253.23 [Kbytes/sec] received

Connection Times (ms)
              min  mean[+/-sd] median   max
Connect:        6    6   0.6      6      10
Processing:   324  775  94.2    766    1252
Waiting:      317  766  93.4    758    1222
Total:        331  781  94.1    773    1258

Percentage of the requests served within a certain time (ms)
  50%    773
  66%    816
  75%    834
  80%    849
  90%    892
  95%    925
  98%    975
  99%   1031
 100%   1258 (longest request)
Yeah, it's better than 3-worker Unicorn, although not stupendously so. 4 workers is 33% more workers than 3 workers... and our median response time isn't even really 33% better under 4 workers than 3. Hmm. Variance is still relatively nice and small.
Puma threaded
Okay, let's go back to a multi-threaded request model.
The new threaded server kid on the block: Puma! We'll do with the default 16 threads, but set min threads same as max threads to create all 16 right away for more consistency. Heroku Procfile: bundle exec puma -t 16:16 -p $PORT -e production
$ ab -n 500 -c 10 http://sleepy-stream-3236.herokuapp.com/fake_work

Concurrency Level:      10
Time taken for tests:   31.196023 seconds
Complete requests:      500
Failed requests:        0
Write errors:           0
Total transferred:      10223500 bytes
HTML transferred:       10045500 bytes
Requests per second:    16.03 [#/sec] (mean)
Time per request:       623.920 [ms] (mean)
Time per request:       62.392 [ms] (mean, across all concurrent requests)
Transfer rate:          320.01 [Kbytes/sec] received

Connection Times (ms)
              min  mean[+/-sd] median   max
Connect:        6    7   0.6      7      16
Processing:   325  611 157.9    589    1358
Waiting:      317  596 157.1    577    1351
Total:        332  618 157.9    596    1365

Percentage of the requests served within a certain time (ms)
  50%    596
  66%    663
  75%    719
  80%    741
  90%    825
  95%    888
  98%    994
  99%   1191
 100%   1365 (longest request)
Wow, a lot better than unicorn, eh? Even Unicorn with 4 workers. Median at around 2x serial response time, better than unicorn's around 3x.
Even though under MRI, this is only using one CPU core. It's because our app is so heavily IO-bound, and we have it under such high concurrency for one dyno, this modern robust multi-threaded server allows more efficient use of the CPU, switching out threads that are waiting on I/O. (Or, okay, in our mock app, just plain waiting on sleep).
And much lower standard deviation/variation than thin-threaded's unexplainably huge variation -- although honestly still more variation than I'd expect for a multi-threaded server, and somewhat more than unicorn's. I expected a robust multi-threaded server to have almost no variation, with 90th percentile not much different than median, as the multi-threaded architecture allows all incoming requests to share CPU fairly. I'm not quite sure what's going on. An artifact of my testing setup? Something else?
Puma Hybrid Model: 3 Multi-Threaded Workers
Oh boy, it's the new hotness. 3 worker processes, just like the first Unicorn test, but unlike unicorn each worker is multi-threaded too. Heroku Procfile: web: bundle exec puma -w 3 -t 16:16 -p $PORT -e production
$ ab -n 500 -c 10 http://sleepy-stream-3236.herokuapp.com/fake_work

Concurrency Level:      10
Time taken for tests:   22.653957 seconds
Complete requests:      500
Failed requests:        0
Write errors:           0
Total transferred:      10223500 bytes
HTML transferred:       10045500 bytes
Requests per second:    22.07 [#/sec] (mean)
Time per request:       453.079 [ms] (mean)
Time per request:       45.308 [ms] (mean, across all concurrent requests)
Transfer rate:          440.67 [Kbytes/sec] received

Connection Times (ms)
              min  mean[+/-sd] median   max
Connect:        6    6   0.8      6      14
Processing:   324  441 135.1    399    1189
Waiting:      316  432 134.6    389    1182
Total:        330  448 135.1    406    1195

Percentage of the requests served within a certain time (ms)
  50%    406
  66%    451
  75%    484
  80%    506
  90%    594
  95%    692
  98%    940
  99%   1100
 100%   1195 (longest request)
Wow, that's what we're talking about. Median response time is fastest we've seen yet, only ~30% penalty vs non-loaded serial response time! There's still more variation than I'd expect (and I still can't explain why), but the max request is still way faster than unicorn's.
Now, here are some numbers we can live with, even under the ridiculous 10-concurrent-request load we're putting on it.
Puma, hybrid 4 workers, multi-threaded
Okay, just like we did for unicorn, let's increase to 4 worker threads --one per core -- but now each multi-threaded. Could a real-world Rails app fit 4 workers (Puma or Unicorn) in a single standard-size Heroku dyno? I'm not really sure. But puma claims to be more memory efficient than unicorn, for what it's worth.
$ ab -n 500 -c 10 http://sleepy-stream-3236.herokuapp.com/fake_work

Concurrency Level:      10
Time taken for tests:   17.509404 seconds
Complete requests:      500
Failed requests:        0
Write errors:           0
Total transferred:      10223500 bytes
HTML transferred:       10045500 bytes
Requests per second:    28.56 [#/sec] (mean)
Time per request:       350.188 [ms] (mean)
Time per request:       35.019 [ms] (mean, across all concurrent requests)
Transfer rate:          570.15 [Kbytes/sec] received

Connection Times (ms)
              min  mean[+/-sd] median   max
Connect:        5    6   1.2      6      24
Processing:   320  339  30.4    329     652
Waiting:      313  331  30.3    321     645
Total:        327  346  30.4    335     658

Percentage of the requests served within a certain time (ms)
  50%    335
  66%    343
  75%    352
  80%    357
  90%    378
  95%    388
  98%    410
  99%    478
 100%    658 (longest request)
Holy cow, it's out of the ballpark! Median response time equivalent to no-load-serial response time! Extremely low variation (at least relative to the other scenarios), with 99th percentile less than 2x median.
Now those are some good looking numbers. Why did adding an extra worker to hybrid puma have so much more effect than adding an extra worker to unicorn? I can't entirely explain it. Of course, adding an extra puma worker is adding 16 more threads.
There's probably some formula involving cpu and iowait time, number of cores available, number of workers, with number of threads each, etc. In each of these scenarios, if you varied the amount of concurrent requests (which I did not), and you graphed number of concurrent requests vs transactions-per-second, the results would probably look like the first graph on this page -- a curve that flattens out. Once it's flattened out, you've 'topped out'. The question is where you top out -- I suspect for puma hybrid/clustered mode, our 10 concurrent requests has not yet reached 'top out' point, while for the others it probably did.
Okay, okay, some charts with varying concurrency
After the last paragraph, I realized I really wanted the perspective you can get by doing what Ylan Segal did, using siege, varying the amounts of concurrency and graphing it.
So I worked out a buncha_sieges.rb script to run a whole buncha sieges like Ylan did. Hacked it until it worked. Waited a couple hours for it to run all its cases. Took me a few (lengthy) iterations to get it working as expected.
In which I noticed that running the same load at different times can indeed produce different numbers, confirming results that variance in environment (network, herkou/aws load, etc) can produce variance in results. Perhaps ideally one would need to run even longer tests, or multiple tests at different times and aggregate them, to try and reduce this variance. But I choose not to spend the extra time on that at present.
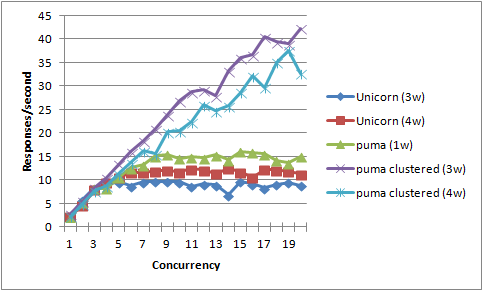
Some odd things I can't explain: Why does puma with 3 workers seem to perform better than puma with 4 workers? That is odd. (As far as I can tell, there were no excessive memory consumption errors in heroku logs). Why so much job on the curves? Why the drop around concurrency=14 across many of them?
The vertical line at "concurrency=10" is the scenario we were testing above with ab, or is supposed to be.
Under this alternate load methodology using siege and varying concurrency, puma clustered still hugely outperforms the others, whether 3 or 4 worker. And perhaps hasn't even 'topped out' at 20 concurrent requests, eh? Even (multi-threaded) puma with only one worker seems to outperform (single-threaded) unicorn with multiple workers.
Recall that all these scenarios are MRI 1.9.3, we are not doing jruby or anything. Multi-threaded concurrency is such a big win anyway in part because the app we are testing is simulating a heavily I/O-bound app, with 250ms of sleeping, simulating 250ms of iowait.
So, the way I've set up the testing instruments, with buncha_sieges.rb now, makes it pretty easy to simulate a somewhat different app (although I've still got to wait an hour+ for it to complete)....
Charting a simulation of a higher performance app
Let's simulate a higher performance app than the dog we've been simulating, with 50ms of simulated cpu load, and only 50ms of simulated iowait (still ~20k response size). We expect the benefits of multi-threaded request dispatch in puma will be less in this scenario, although likely still of value.
$ QUERY="cpu_ms=50&iowait_ms=50" ./buncha_sieges.rb
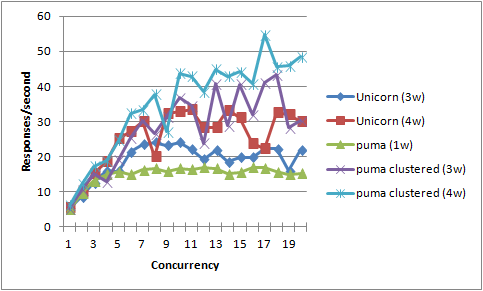
Since the app under load has entirely different response-time characteristics, you can't compare the actual y-axis numbers between the two graphs; it's the shapes and relationships of the lines that interest us.
Our expectation was correct, puma lead narrows a lot. The puma 1 worker now does worse than unicorn multi-worker, which makes sense. However, the puma 3 or 4 worker still does better than the unicorn 3 or 4 worker.
It is interesting to note the lines, especially for puma, are much more jaggedy and less smooth under this test. I can't really explain why.
Chart a heavily CPU-bound app under varying concurrency
For completeness and curiosity, let's do one that has nearly no simulated iowait; a heavily CPU-bound, fairly speedy, app that spends 100ms in simulated cpu work and 1ms in simulated iowait (mainly cause I was too lazy to make sure the code would work if I specified 0!).
We expect puma to do even much worse comparatively. But will it still outperform unicorn? Will multi-threaded request dispatch, on MRI with the GIL, help at all in an app that is almost entirely cpu-bound?
$ QUERY="cpu_ms=100&iowait_ms=1" ./buncha_sieges.rb
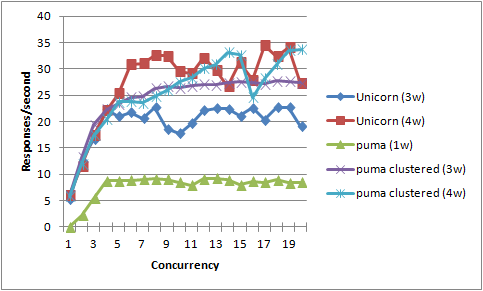
And indeed the advantages of multi-threaded request dispatch disappear under completely cpu-bound app, and puma loses its advantage. The results here are such a mish-mash that we can't say much more than "puma loses its advantage," it's not clear that unicorn takes any advantage either. (Puma 3 workers seems to beat Unicorn 3 workers, but Unicorn 4 workers seems to beat--or is that just be even with--puma 4, what?)
Of course, it is going to be the rare web app that is so thoroughly cpu-bound as our simulation app here.
I suggest this loss of utility of multi-threaded request dispatch under an entirely cpu-bound load is not about the MRI GIL. The MRI GIL keeps a single MRI worker from using more than one core simultaneously. However, under the 4-worker scenarios we are running a worker per core. Our testing instruments apply a pretty steady firehose of real load, and under these conditions I'd fully expect to see near 100% CPU utilization of all four cores (anyone know how to measure this on heroku?).
Under real world conditions of more uneven request load, and more uneven response work per-request, the GIL might be more of a penalty. And without the GIL, in an interpreter like Jruby, you could probably get away with one worker, there'd be less reason to create the (RAM-hungry) multiple workers.
But under our actual testing conditions, I'd expect even if you ran under jruby, if you ran 4 workers, you'd find that turning off multi-threaded request dispatch (say, avoid config.threadsafe! in rails 3) didn't make much of a difference under a cpu-bound app.
(And yes, there are a bunch more possible experiments suggested here if anyone wants to do them; but at the moment I'm getting tired, aren't you?)
The real advantage of multi-threaded request dispatch, under these tests, is handling those moments of iowaiting, making sure the worker process can switch out an iowaiting thread and meanwhile handle another request, instead of having each worker process being entirely locked up until the response is done, even on iowait. And the GIL does not interfere with that.
Multi-threaded request dispatch may also even out variation in response times. Okay, let's take a look at one more thing then....
Response time variation between multi-worker puma vs unicorn
We started out ab testing an app that simulated heavy IO-dependent. Then we moved to siege, and eventually moved to a simulated app that was heavy CPU-dependent. Let's finish things off returning to ab, with concurrency of 10, to give us more details on variation, but with our cpu-dependent app this time. We'll increase the count to 1500 total requests.
I'm not going to include the charts here, we're already getting to information overload in this report, aren't we? But they looked pretty similar, similar median response times, with unicorn having somewhat-but-not-drastically better response times towards the 90th+ percentile.
Discussion/Caveats
- There are still some unexplainable phenomenon above, which make us wonder what we're not understanding.
- There are many more experiments that could be done, varying even more factors.
- Have I really simulated cpu and iowait effectively?
- What are actual realistic/typical iowait/cpu ratios, and overall response times, for real world apps? Have I spent too much time on unrealistically slow app profiles
- Is unrelated environmental variation (network, physical host load, etc) too much of a problem affecting our results? One might have to run tests over a much longer period of time, or multiple times across days and aggregate results, to try and even out background variation.
- I think maybe I made a mistake having simulator app return 20k response, which is going to end up making it more susceptible to network variation. Perhaps it should have just returned a super short response?
- For really testing a scenario similar to the 'heroku routing debacle', you need uneven application response time, but my mock app takes pretty much the same amount of time (~300ms plus overhead) every time. I didn't have the gumption to rig up a test where it varied, but still averaged out as expected, or whatever.
- Not to mention more than one heroku dyno to actually bring the heroku router into play.
- And uneven request loads, rather than a steady firehose.
And probably more I haven't thought of.
But I'm kind of worn out already, and you probably are too reading all of this!
So feedback is very welcome, on potential problems, improvements, etc. (hackernews thread) -- but I might not have the energy to do more tests myself. I tried to make everything I've done here both transparent and as easily reproducible-with-improvements by someone else as possible: Take my code, please! (I wonder if heroku would be interested in spending their paid staff time on further investigations using more complex heroku stacks?)
But at least, this makes puma awfully enticing doesn't it? It sure looks like hybrid/clustered/multi-worker puma is likely to provide significant advantage for an io-bound app, as most web apps are. Yes, even, or maybe especially under GIL'd MRI -- at least if your app is mostly IO-bound, and can run safely under multi-threaded dispatch. And especially with puma's hybrid/clustered mode, multiple worker processes each of which is multi-threaded, which is pretty optimal for a GIL'd server, it turns out. puma: ain't just for jruby!
- Yes, this is a fairly new mode in puma that it's possible may not be entirely robust yet (although it's already up to puma 2.1). Yes, running a Rails app under multi-threaded request handling can sometimes have gotchas -- although I think most of the bugs in Rails itself under multi-threaded concurrency have been fixed at this point (I have historically run into some with ActiveRecord, but none outstanding I know about, in Rails4 anyway). It's not as tricky as you think though, mostly just be careful with global/class variable state. (And if using ActiveRecord, set connection pool size to the number of threads in your app server).
- But the possible performance gains are so great (yeah, even under MRI), that it's worth investigating. The more people that go down this road, the more bugs will be found and fixed, the more best practices will be established, the more stable all of this will get.
I am hoping to raise the level of discussion and interest in multi-threaded rails dispatch in general, and the 'hybrid' dispatch mode offered by Passenger Enterprise and puma in particular. multi-threaded request dispatch can definitely matter, even in MRI (Thanks to evanphx for writing puma giving us a robust modern multi-threaded rack server; and the puma clustered/hybrid mode, giving us a free app server that does it! And rails team for making rails4 always-on suitable for multi-threaded request dispatch)