crapp / Geomandel
Labels
Projects that are alternatives of or similar to Geomandel
Geomandel

![]()

- Introduction
- Features
- Setting up geomandel
- Usage
- Color
- Performance and Memory usage
- Development
- Bugs, feature requests, ideas
- ToDo
- License
Introduction
geomandel is a command line application that allows you to calculate and render fractals using different image formats, or export the calculated data as csv.
A fractal is a natural phenomenon or mathematical set that display self-similarity at various scales. It is also known as expanding symmetry or evolving symmetry. Benoit Mandelbrot, the person who discovered the Mandelbrot Set characterized Fractals as "beautiful, damn hard, increasingly useful. That's fractals.".
One can define the Mandelbrot Set as the set of complex numbers (complex plane) for whom the progression

converges to. This is a rather complicated subset of the complex plane. If you try to plot this set, you will find areas that are similar to the main area. You can zoom into this figure as much as you want. You will discover new formations as well as parts with self similarity.
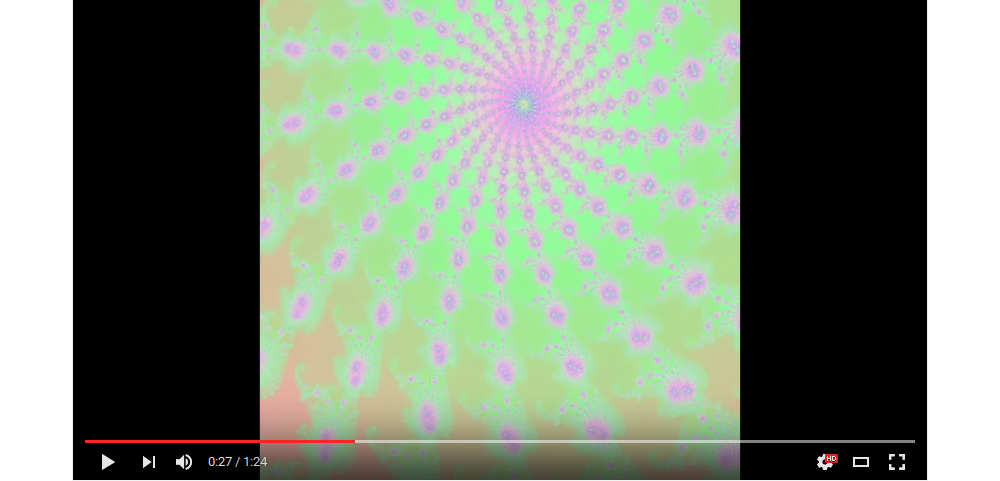 Mandelbrot Fractal animated Zoom
Besides the Mandelbrot Fractal geomandel supports the following other fractals:
You may ask yourself how I came up with the name geomandel for this fractal generator. Well my original plan was to play with fractals and GeoTIFFs to see what kind of effects I could achieve with spatial geographic data. This is still on my list of todos...
I also want to make you aware of the Mandelbrot project a friend of mine started. He uses Rust for his project and it motivated me to see how a C++11 solution would perform in comparison to his solution. I will provide some comparison charts in the future.
Features
- Generate Julia Sets, Tricorn, Burning Ship or Mandelbrot Fractals
- Set complex plane, bailout, and zoom coordinates / level
- Output calculated data as images (PNM / JPEG / PNG) or export as csv
- Different coloring algorithms
- Fast platform independent code written in C++11 using the cmake build system
Setting up geomandel
In order to run the application on your system you either have to compile the source code or use precompiled packages/installers.
Source Code
To get the source code of the application you may either download the latest release or you can check out the code from the repository on github. Please use the master branch or one of the release branches.
In order to compile the source code on your machine the following requirements have to be met:
- cmake >= 3.2
- C++11 compliant compiler with proper
std::regexsupport- gcc >= 4.9
- clang >= 3.4
- MSVC >= 14 (Visual Studio 2015)
- MinGW >= 4.9
- Simple and Fast Multimedia Library for png/jpg support (optional)
The following external libraries are used by geomandel and are part of the applications source code:
- cxxopts - Lightweight C++ command line option parser
- CTPL - Modern and efficient C++ Thread Pool Library
- Catch - A modern, C++-native, header-only, framework for unit-tests, TDD and BDD
Linux / OS X
Download and extract the source code. Enter the source code directory and use the following commands to compile the application
# create a build directory and enter it
mkdir build
cd build
# run cmake to generate unix make files. Use -DUNIT_TEST=ON to build the
# unit tests application
cmake -DCMAKE_BUILD_TYPE=Release ../
# now compile the source code to create the geomandel executable. You can speed
# up compilation with the j option.
make
# optional run make install if you want to install the executable
make install
Windows
You can use the cmake Visual Studio Solution generator to compile the application.
# create build directory and enter it
mkdir build
cd build
# assuming you are using Visual Studio 2015 on a 64bit Windows installation
# please change these options so they suit your build environment
cmake -G"Visual Studio 14 2015 Win64" ../
Open the solution file and compile the application.
Another possibility is to use the cmake NMake generator.
# create build directory and enter it
mkdir build
cd build
# check the prefix path so it matches your Qt installation
cmake -G"NMake Makefiles" ../
# build the application
nmake
Precompiled packages, Installer
Precompiled Linux packages are available for
- Archlinux

Usage
The command line application has sane default values for all options and you only have to specify what kind of output you want to have. When the application is started it will calculate the iteration count for all complex numbers in the complex plane you defined. The iteration count can then be used to visualize the fractal or the values can be exported to csv files. This is useful if you want to test your own visualization algorithms.
Command line options
geomandel uses the header only C++ command line parser cxxopts
The following command line options are available
Usage:
  geomandel [OPTION...] - command line options

      --help              Show this help
  -m, --multi [=arg(=2)]  Use multiple cores
  -q, --quiet             Don't write to stdout (This does not influence
                          stderr)

 Fractal options:

  -f, --fractal arg     Choose which kind of fractal you want to compute and
                        render (default:0)
  -b, --bailout arg     Bailout value for the fractal algorithm
                        (default:1000)
      --creal-min arg   Real part minimum (default:-2.0)
      --creal-max arg   Real part maximum (default:1.0)
      --cima-min arg    Imaginary part minimum (default:-1.5)
      --cima-max arg    Imaginary part maximum (default:1.5)
      --julia-real arg  Julia set constant real part (default:-0.8)
      --julia-ima arg   Julia set constant imaginary part (default:0.156)

 Image options:

      --image-file arg  Image file name pattern. You can use different printf
                        like '%' items interspersed with normal text for the
                        output file name. Have a look in the README for more
                        instructions. (default:geomandel)
  -w, --width arg       Image width (default:1000)
  -h, --height arg      Image height (default:1000)
      --image-pnm-bw    Write Buffer to PBM Bitmap
      --image-pnm-grey  Write Buffer to grey scale PGM
      --image-pnm-col   Write Buffer to PPM Bitmap
      --image-jpg       Write Buffer to JPG image
      --image-png       Write Buffer to PNG image
      --col-algo arg    Coloring algorithm 0->Escape Time Linear,
                        1->Continuous Coloring Sine, 2->Continuous Coloring
                        Bernstein (default:1)
      --grey-base arg   Base grey color between 0 - 255 (default:55)
      --grey-freq arg   Frequency for grey shade computation (default:0.01)
      --rgb-base arg    Base RGB color as comma separated string
                        (default:128,128,128)
      --rgb-freq arg    Frequency for RGB computation as comma separated
                        string. You may use doubles but no negative values
                        (default:0.01,0.01,0.01)
      --rgb-phase arg   Phase for Sine Wave RGB computation as comma separated
                        string
                        (default:0,2,4)
      --rgb-amp arg     Amplitude for Bernstein RGB computation as comma
                        separated string (default:9,15,8.5)
      --set-color arg   Color for pixels inside the set (default:0,0,0)
      --zoom arg        Zoom level. Use together with xcoord, ycoord
      --xcoord arg      Image X coordinate where you want to zoom into the
                        fractal
      --ycoord arg      Image Y coordinate where you want to zoom into the
                        fractal

 Export options:

  -p, --print           Print Buffer to terminal
      --csv             Export data to csv files
Fractal Options
In order to choose the fractal that will be computed the --set parameter exists.
The parameter has the following options:
--fractal=0   Mandelbrot Set (Default)
--fractal=1   Julia Set
--fractal=2   Tricorn
--fractal=3   Burning Ship
The complex plane is defined with these options:
--creal-min   arg (-2.0)
--creal-max   arg ( 1.0)
--cima-min    arg (-1.5)
--cima-max    arg ( 1.5)
You might need to adjust these values if you want to generate tricorn or julia fractals.
In order to calculate the Julia Set a fixed constant is needed which you may provide
with julia-real and julia-ima (Default (-0.8+0.156i)).
The bailout value bailout defines the maximum amount of iterations used to
check whether a complex number is inside the Fractal. The higher you set
this value the more precise the predictions of the algorithm will be. But
computation time will also be significantly higher. The escape criterion, shown in
the pseudo code example below for the mandelbrot set, is not yet definable by a
command line parameter
(defaults to 2.0)
while ( x*x + y*y <= ESCAPE  AND  iteration < BAILOUT  )
{
    xtemp = x*x - y*y + x0
    y = 2*x*y + y0
    x = xtemp

    iteration = iteration + 1
}
Computation speed can be reduced by using the multi option. This will
distribute the workload on different threads. See the Performance section for
more details.
One of the best features of Fractals is the possibility to zoom in indefinitely. geomandel has specific convenient options to achieve this.
--zoom   arg      Zoom level. Use together with xcoord, ycoord
--xcoord arg      Image X coordinate where you want to zoom into the fractal
--ycoord arg      Image Y coordinate where you want to zoom into the fractal
The coordinates are image coordinates and describe the point where you want to zoom into the fractal. Based on the coordinates and the zoom level a new complex plane will be calculated. You can achieve the same effect if you use the complex plane options directly but I think it is much easier to get the coordinates from an image viewer and let geomandel do the math. All values can be decimals.
Image Options
geomandel is able to generate different image formats from the image algorithms. How this images are generated can be influenced by command line parameters.
File name
The default output file name is geomandel + appropriate image format file extension.
You can use the img-file command line option which provides highly customizable
file names.
You can use different printf like '%' items interspersed with normal text for the output file name. These items will be replaced by the application with the values you chose.
%f     Fractal name
%b     Bailout value
%Zr    Complex number real minimum
%ZR    Complex number real maximum
%Zi    Complex number imaginary minimum
%ZI    Complex number imaginary maximum
%w     Image width
%h     Image height
%z     Zoom level
%x     Zoom x coordinate
%y     Zoom y coordinate
If you have set a bailout value of 2048 and are using the default values for the complex plane you could use a file name pattern like this
my_fractals_%bb_z(%Zr, %Zi)_z(%ZR, %ZI) -> my_fractals_2048b_z(-2.0, -1.5)_z(1.0, 1.5).[pgm|pbm|ppm|png|jpg]
Please note the naming scheme used for image files also applies for csv files
that will be generated when you use the csv command line option.
Image size
Use the following parameters to control the image size
-w, --width
-h, --height
These parameters have a large impact on memory footprint and computation time
Image formats
The application can generate images in the portable anymap format (PNM). The big advantage of this format it is easy to implement and doesn't need any external libraries. The downside is large files, as geomandel does not use a binary format, and low writing speed.
You can choose between img-pnm-bw a simple black and white image, img-pnm-grey
using grey scale to render the fractal and img-pnm-col that generates
a RGB color image.
Additionally SFML can be used to generate jpg/png images. These image formats use very little space on your disk and the library is quite fast. You have to install the library and recompile geomandel if you want this kind of images.
Color Options
This is just a brief introduction into color command line options. See the Color section for more information on this topic.
The col-algo parameter determines which coloring algorithm to use. Continuous
coloring can produce images without visible color bands. Computation time might
increase slightly though.
--col-algo arg    Coloring algorithm 0->Escape Time Linear,
                  1->Continuous Coloring Sine, 2->Continuous Coloring Bernstein
Grey scale fractals are a nice alternative to colored ones. These parameters control how the pgm images look like. The default value for grey scale frequency is meant to be used with the linear escape time coloring algorithm.
--grey-base arg   Base grey shade between 0 - 255
--grey-freq arg   Frequency for grey shade computation
The RGB options apply to PPM as well as to PNG and JPG images. The base color
(background color) is set with --rgb-base. The distribution of the colors in
the color spectrum for the escape time or continuous index can be defined with
--rgb-freq, --rgb-phase and --rgb-amp. These options do different things
depending on the chosen coloring algorithm.
--rgb-base  arg    Base RGB color as comma separated string
--rgb-freq  arg    Frequency for RGB computation as comma separated
                   string. You may use decimals but no negative values
--rgb-phase arg    Phase for Sine Wave RGB computation as comma separated string
--rgb-amp   arg    Amplitude for Bernstein RGB computation as comma separated string
The color of the pixels inside the fractal can be set with set-color command
line option.
Examples
This section shows some examples of generated fractals and the command line parameters necessary. Default values are used if not mentioned otherwise.
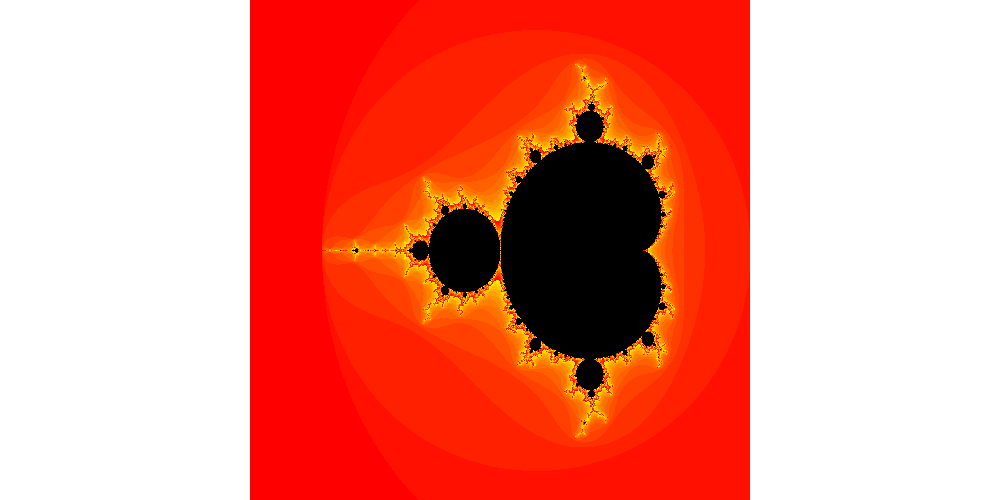
Mandelbrot fractal using linear escape time coloring
geomandel --col-algo=0 --rgb-freq=0,16,0 --rgb-base=255,0,0
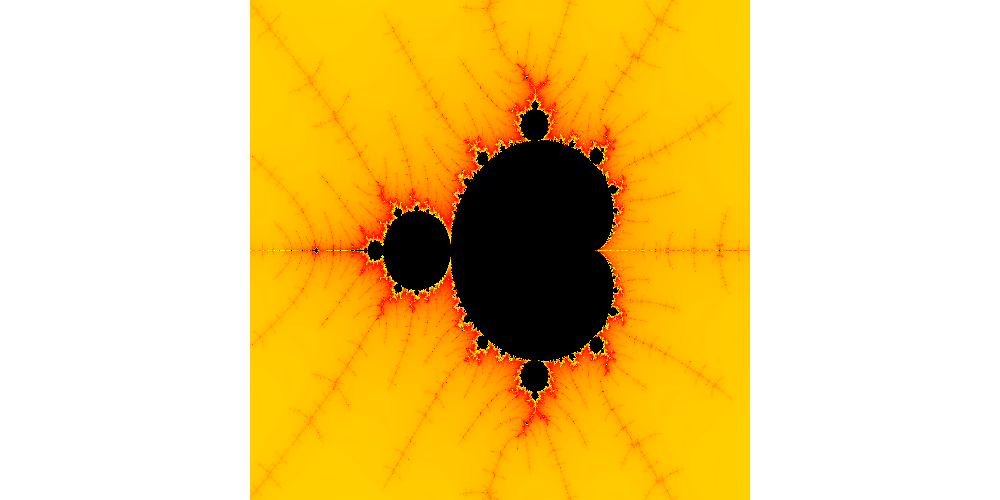
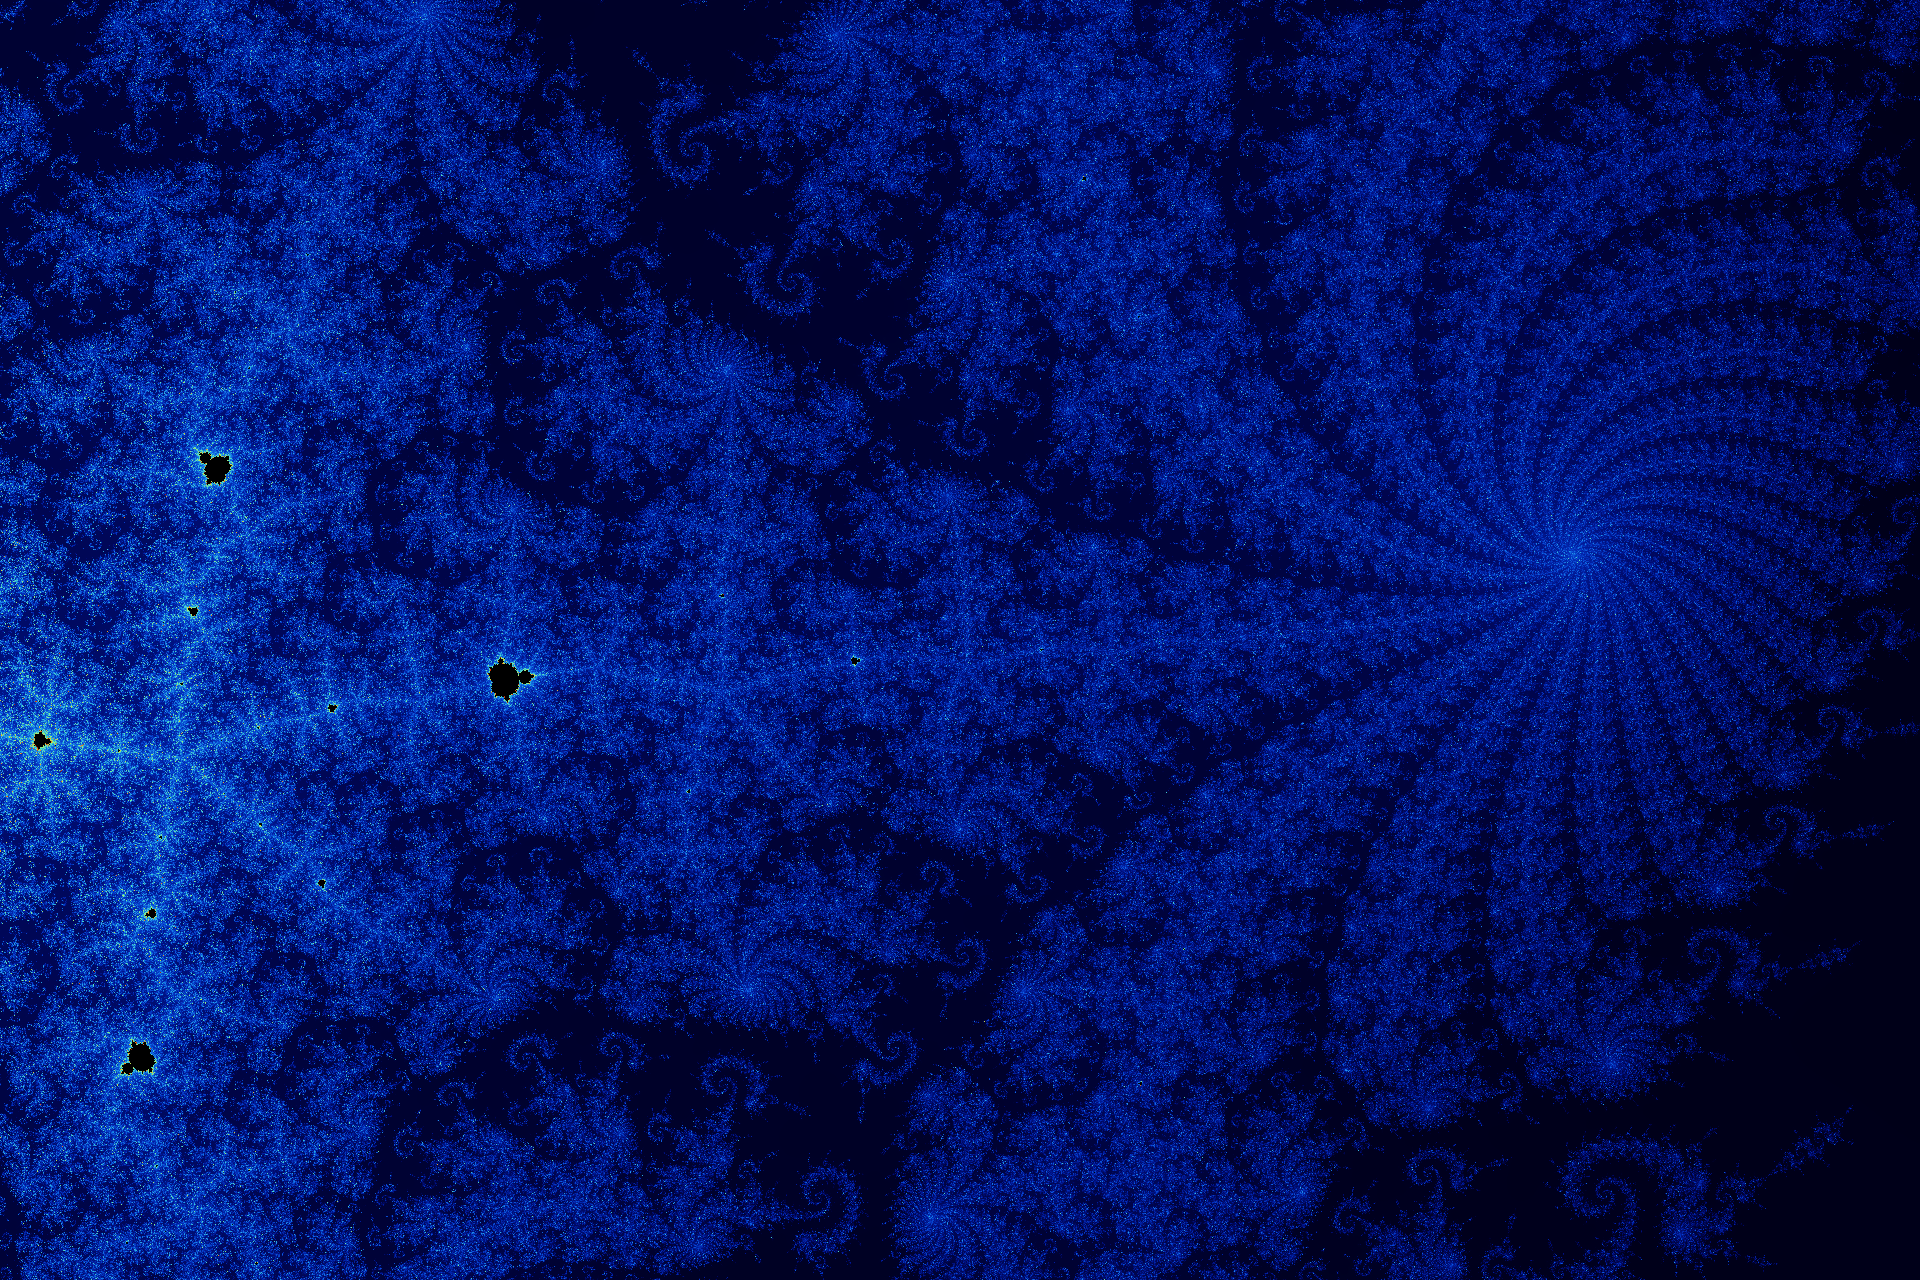
Mandelbrot fractal sine wave continuous coloring zoomed (200x)
geomandel --rgb-freq=0,0.01,0 --rgb-base=255,0,0 \
--xcoord=146 --ycoord=250 --zoom=200
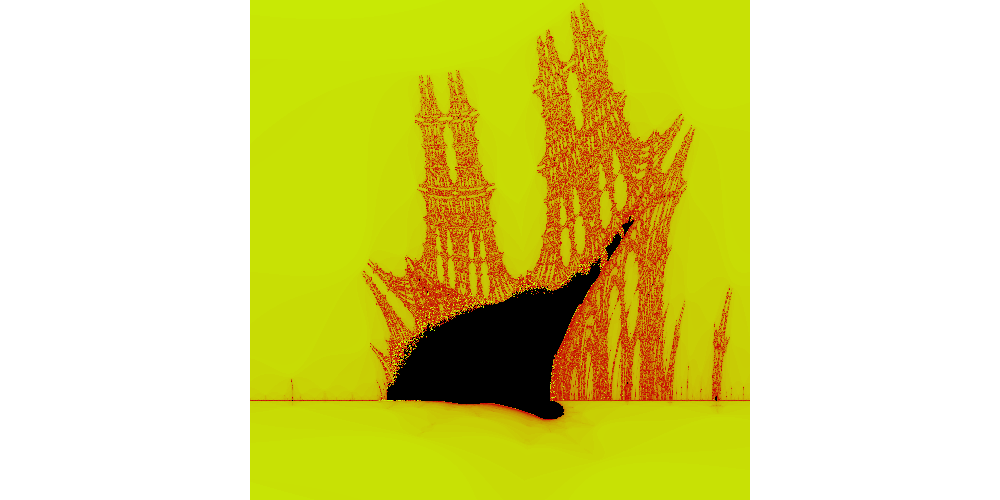
Burning Ship fractal sine wave
geomandel --fractal=3 --col-algo=1 \
--rgb-amp=0,7,0 --rgb-base=200,100,5 --rgb-freq=0,0.03,0 --rgb-phase=4,2,0 \
 --xcoord=105.5 --ycoord=245 --zoom=30
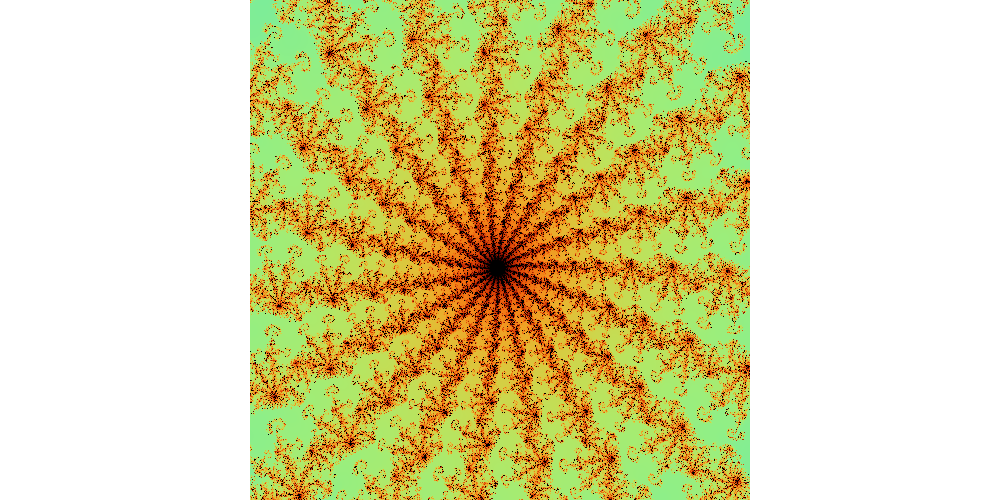
Zoomed Julia Fractal using continuous coloring based on Bernstein Polynomials
geomandel --fractal=2 --col-algo=2 --rgb-base=0,0,0 \
--creal-min=-1.5 --creal-max=1.8 \
--xcoord=253.5 --ycoord=289.7 --zoom=300
Full HD zoomed Mandelbrot Fractal, colored using Bernstein Polynomials
src/geomandel -w 1920 -h 1280 --image-png -m 4 -b 28000 \
--cima-min=-1.0 --cima-max=1.0 --creal-min=-2.0 \
--zoom=55250 --xcoord=471.42 --ycoord=615.681
 Warning large image
Color
The fractal algorithms are well known and easy to implement. The more challenging
part is to draw beautiful fractals using different coloring algorithms. geomandel
offers different color strategies, escape time based linear and continuous coloring.
You can use the col-algo parameter too chose which one you want to apply.
Escape Time Linear
The Escape Time linear algorithm is the most common method to color fractals. This is because the method is fast, easy to understand and there are a lot of implementations in the wild one can build on.
The pseudo code example in command line options section shows how the escape time is calculated. geomandel takes this value and calculates a RGB tuple or a grey scale value using the following formula

Grey Scale
Lets have a look at grey scale PGM images first. You can provide a base grey
shade with grey-base and a frequency value grey-freq which determines
how often sequences of grey shades repeat and their grading. This is best explained
with some images and plots.
The following Images and Plots were generated with grey-base=55
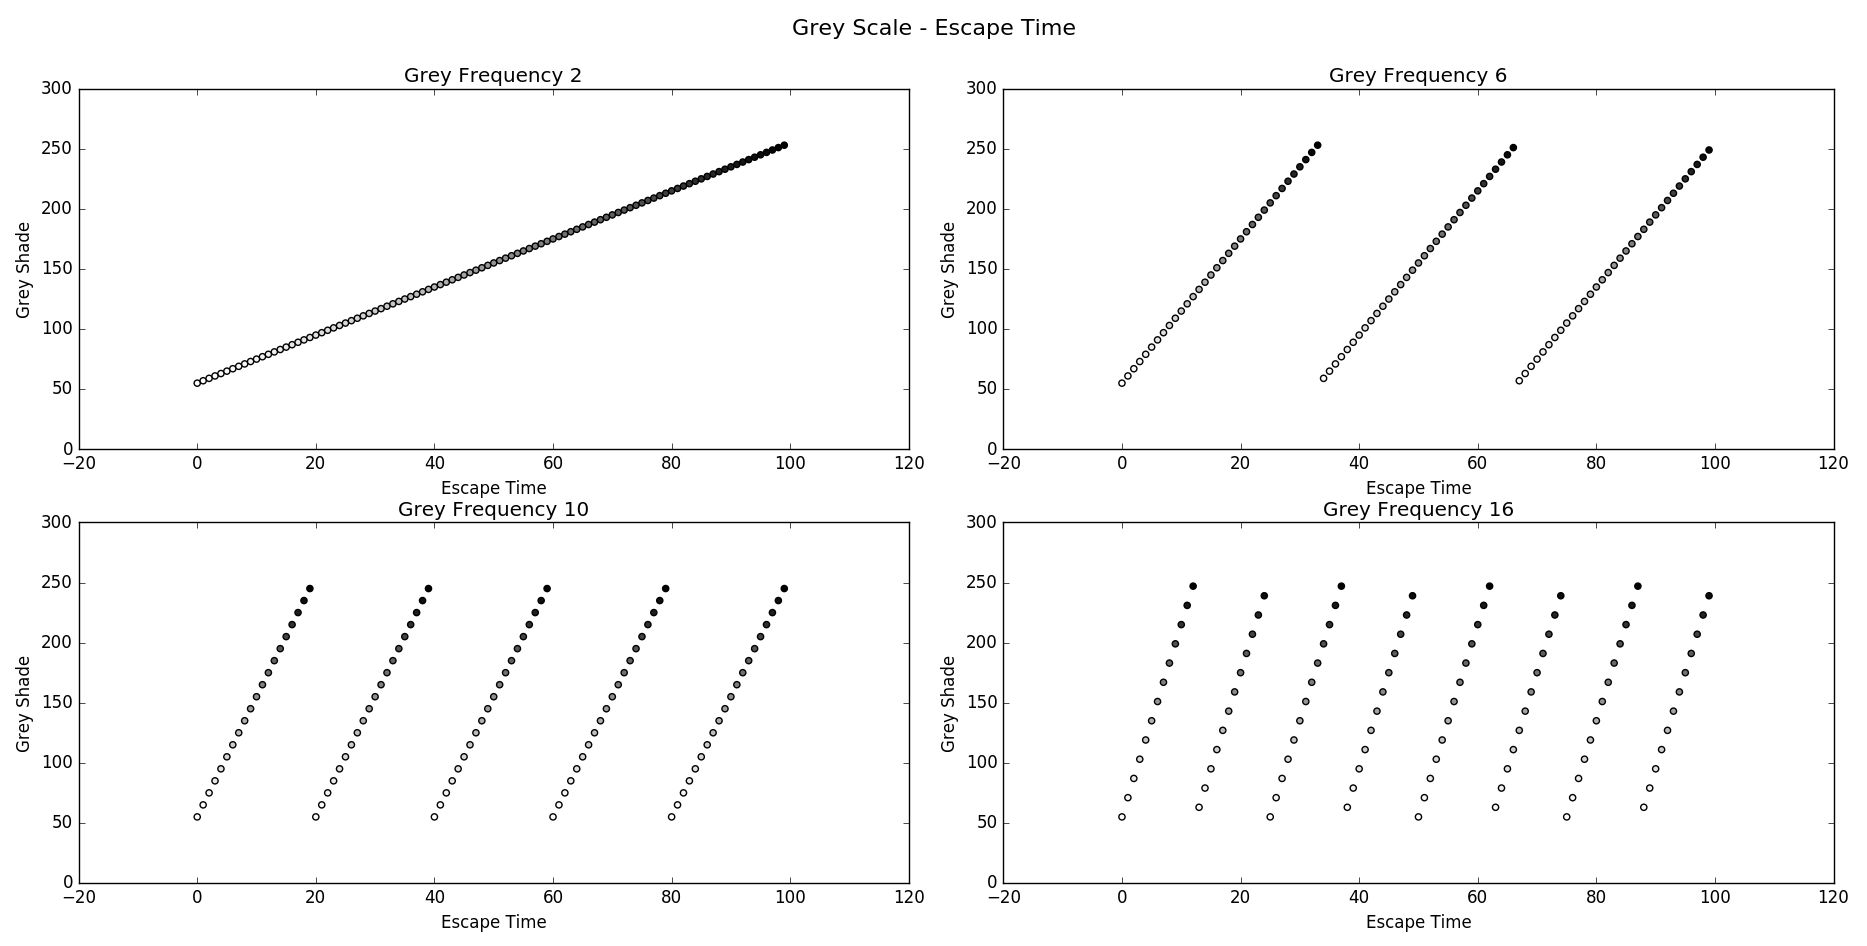
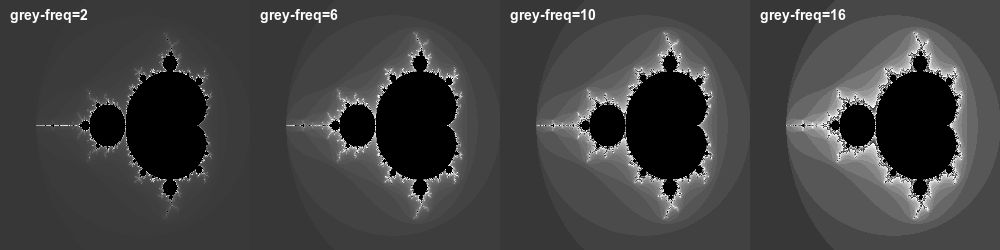
As you can see increasing the frequency will add better visual effects but also worsens the problem of color banding.
RGB Images
Generating RGB images with the Escape Time algorithm works similar to grey scale
images. You now have to use rgb-base=R,G,B to provide a base color and
rgb-freq=FREQ_R,FREQ_G,FREQ_B to determine the frequencies. Setting a
frequency to 0 will leave the respective color channel untouched.
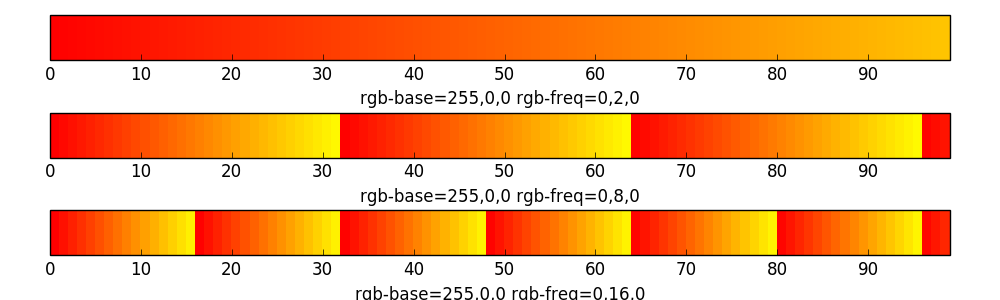
The first three colorbars were created with a base color of 255,0,0 and a
RGB frequency of 0,2,0;0,8,0;0,16,0. So only the green color component will
be changed.
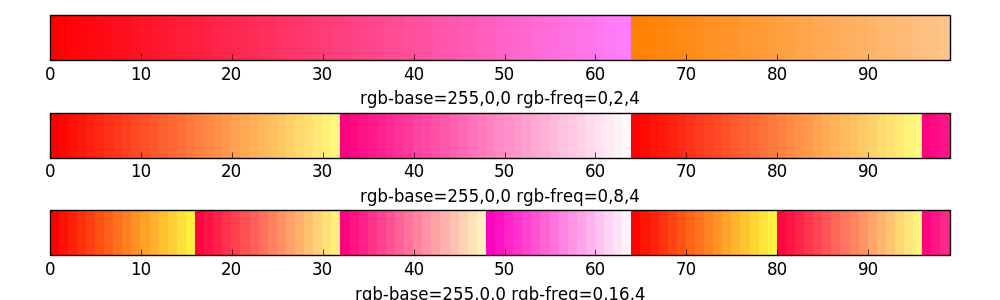
The next three colorbars were created with the same base color and the same frequency values for the green channel. Additionally I have added a frequency of 4 for the blue channel.
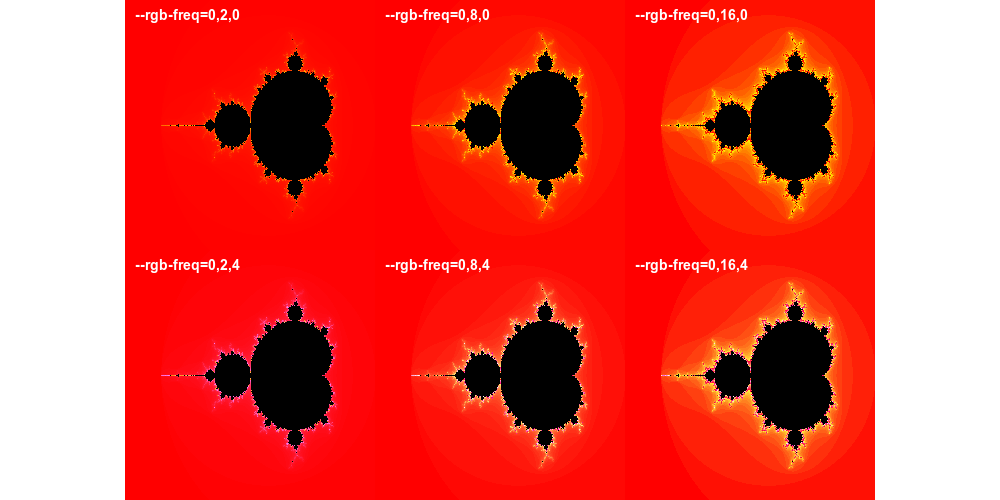
Here is what these values will look like as mandelbrot fractals.
Feel free to experiment with these values to get the result you want. There is a
jupyter notebook EscapeTimeRGB in the resources folder that makes it easy to
visualize different values for RGB fractals generated with the escape time
algorithm.
Continuous Coloring
Computing RGB values from the escape time in the fractal algorithms is easy but has the disadvantage to produce visible color bands. This is because integer based escape time consists of discrete values and this will result in a discrete color scale. If the escape time is increased by 1 step we omit all values in between and thus loosing the precision to color the fractal in a continuous way. Getting around this is a bit more tricky and needs some additional computation steps.
Mathematical Bases
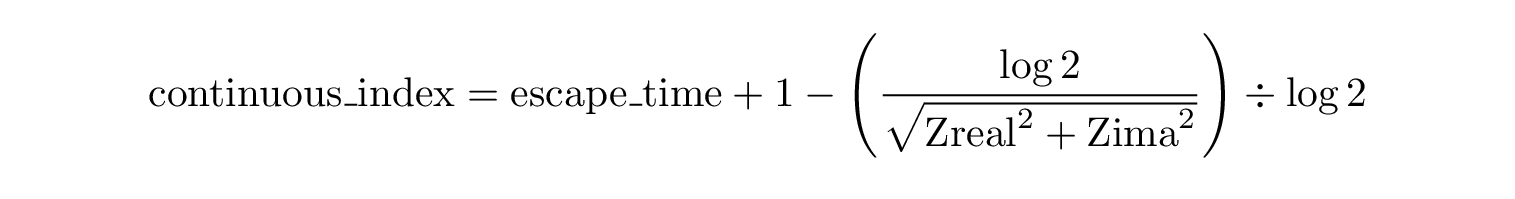
A well known method is mapping the escape time on a logarithmic scale which will give us a continuous gradient. Using a natural logarithm allows us to transform the magnitude of every escaped pixel into a value between 0 and 1. Here is the formula I use to calculate a continuous index for every complex number of the complex plane.
Next step involves finding a good color map which colors blend smoothly and of course endlessly as we can zoom a fractal indefinitely. Mathematical functions used to model periodic and repeating phenomenas are the sine and cosine functions. So a formula that uses out of phase sine functions to generate real-time color blending could look like this:

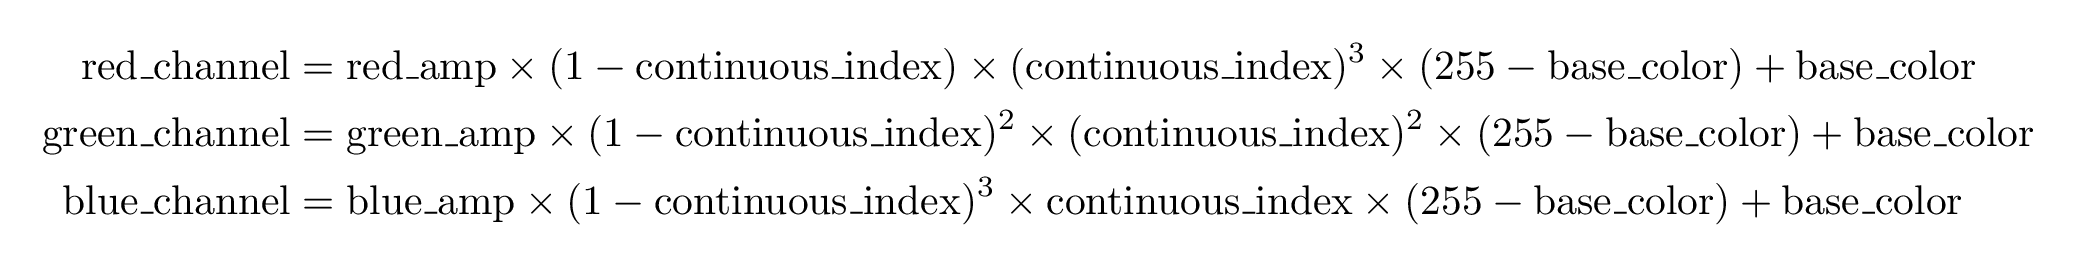
Another method is to use a smooth polynomial that is defined on the unit interval and has appropriate values. Slightly modified versions of the Bernstein polynomials can be used as they are continuous, smooth and have values in the [0, 1] interval.
Sine wave based coloring
If you are interested in how this exactly works I highly recommend to read the article
about generating color sequences using sine and cosine by Jim Bumgardner. Reading this will help you understand how to use the options
rgb-base, rgb-freq and rgb-phase with the continuous sine coloring algorithm
to get the result you want.
As with escape time coloring using a frequency of 0 for a color component will leave the appropriate base color channel untouched.
Here are some examples that show what you can achieve using this type of coloring.
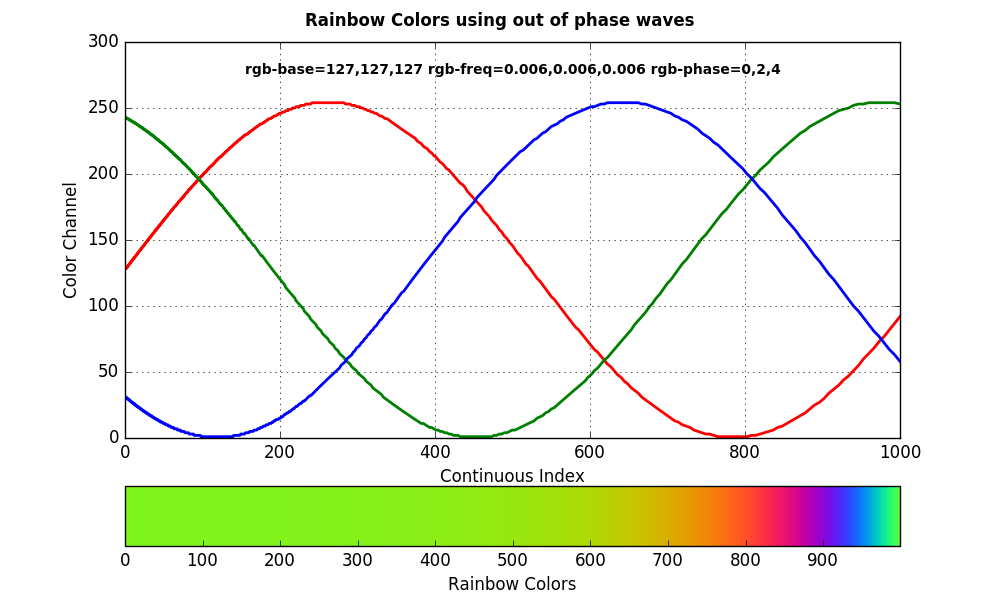
The first graph and colorbar show how you can get rainbow colors by using out of phase color channel waves. If you would use the same phase and the same frequency this would produce grey shades.
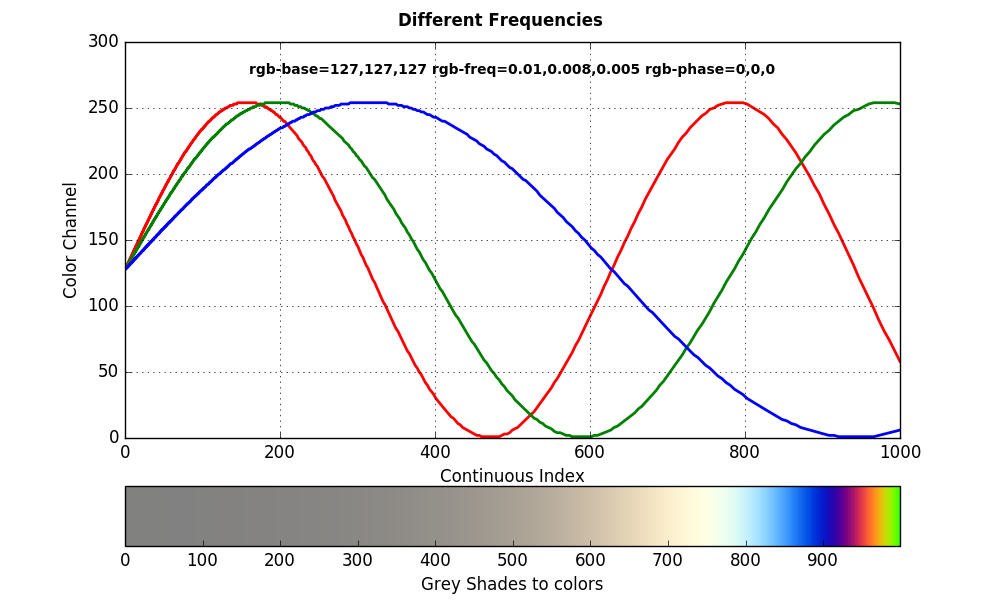
In the second example I used the same phase but different frequencies. If the base color for all color channels is the same this will lead to a transition from grey shades to colors.
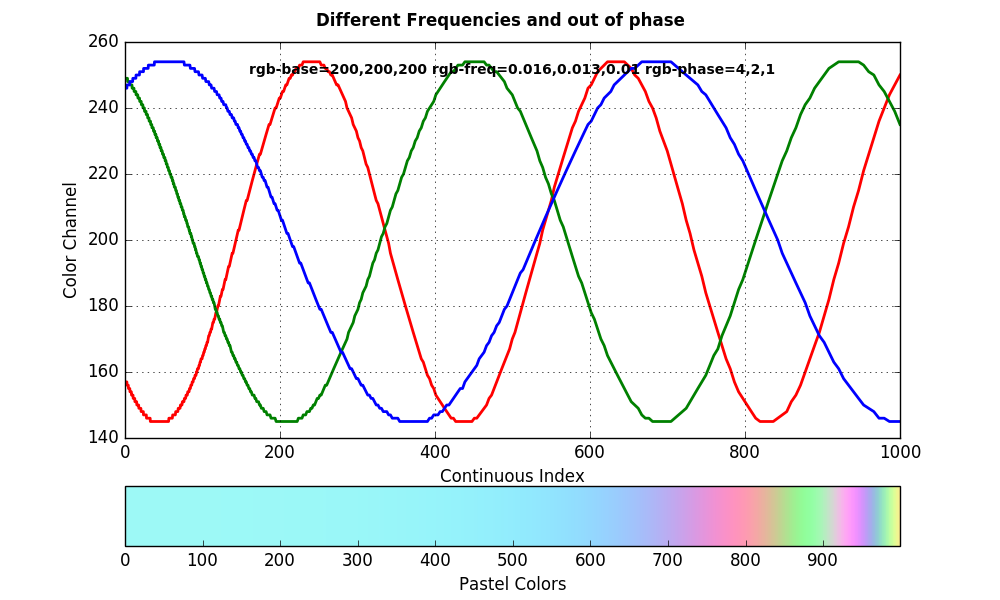
Interested in pastel colors? The last example shows exactly this using a higher base color, different frequencies for the color channels and they are out of phase.
Choosing the right frequencies is highly dependent on the bailout value you used for the fractal algorithm. If the frequencies are to high you will get color bands.
Bernstein polynomial based coloring
As I already mentioned Bernstein polynomials are continuous, smooth and have values
in the interval we need. Making them a good match to create RGB colors that blend
smoothly. You can use the parameters rgb-base and rgb-ampto influence this
coloring algorithm.
The base color is the background and starting color for this algorithm.
If you set the amplitude for a color channel to 0 the base color will not be
changed.
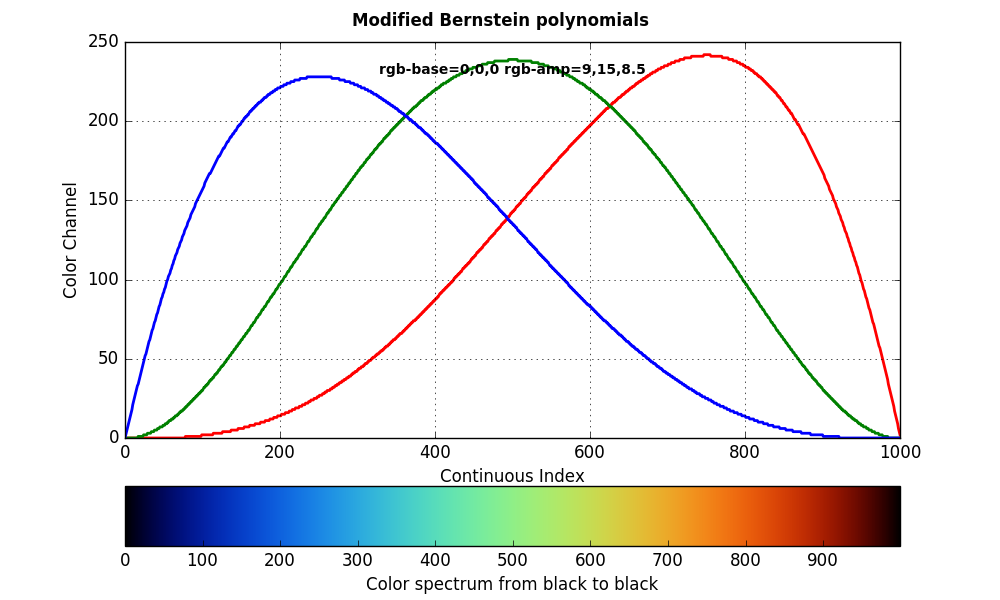
This graph shows you what colors you will get with a base color of 0, 0, 0
and an amplitude of 9, 15, 8.5
There is a jupyther notebook BernsteinContinuousColoring covering this coloring
algorithm in the resources folder.
Performance and Memory usage
Calculating the escape time for a Mandelbrot Set is costly and may consume large
amounts of RAM. The computation benefits greatly from parallelism and it is easy
to distribute the workload accordingly. You can do this with the --multi
Parameter. geomandel will create the amount of threads specified by the multi
Parameter and uses the modern and efficient thread pool library
CTPL to distribute the workload.
Benchmarks

The chart shows how geomandel performs on different CPUs. The overhead seems to be pretty small as doubling the number of threads nearly halves the time needed for the computation.
While the Apple clang compiler generated binary performed as good as the gcc binary on OS X (and even slightly better) the clang compiler on Linux is outperformed by gcc by a factor of 2:1.
Performance breakdown
Calculating the mathematical set of a fractal seems to be costly. But how much time is really spend on computation? In order to answer this question it is necessary to look at an application with a performance analyzing tool. Luckily we have perf on Linux.

Graph generated from perf data with gprof2dot
As you can see ~97% of the applications CPU cycles were used to calculate a
mandelbrot set. Only one CPU core was used in this example.
So if you want to speed up this application this is the place to
start. I will try to maximize parallel computation with the use of GPUs in the
future for now you can use the multi option if your CPU offers multiple cores or
threads.
Memory Footprint
The amount of memory used by geomandel is mostly dependant from image size and image format. The internal buffer that stores the results of the fractal number cruncher is preallocated at the beginning of the application. Therefor it is simple to calculate the minimum amount of free memory you need to run geomandel. The internal Buffer stores the modulus of the complex numbers (double) and the escape time (int32).

As you can see in this equation you need around 12.6 MB for an image of the size 1024x1024. Of course this will be more in real life as I did not account for padding space between data members that is inserted by compilers to meet platform alignment requirements. In this case 16 Bytes will be used meaning the application needs around 16 MB of free memory.
Lets see if valgrinds memory profiler massif is showing us the same values that I just calculated
 Memory profile derived from valgrinds massif tool
Directly at the beginning the memory for the internal buffer is acquired and this is close to my 16 MB assumption. At the end you can see another sharp rise in memory usage. This is because I used SFML to generate a PNG image. SFML needs a uint8_t data structure consisting of 4 bytes per pixel (RGBA). This leads to another 12 MB of memory acquired by geomandel. That comes to a total of ~28 MB of memory. Please note this extra memory is only acquired when you use SFML (PNG/JPG).
Development
Brief overview over the development process.
Repositories
The github repository of geomandel has several different branches.
- master : Main development branch. Everything in here is guaranteed to compile and is tested. This is the place for new features and bugfixes. Pull requests welcome.
- dev : Test branch and wild west area. May not compile.
- release-x.x : Branch for a release. Only bugfixes are allowed here. Pull requests welcome.
- gh-pages : Special branch for static HTML content hosted by github.io.
Coding standards
The source code is formatted with clang-format using the following configuration
Language                            : Cpp,
BasedOnStyle                        : LLVM,
AccessModifierOffset                : -4,
AllowShortIfStatementsOnASingleLine : false,
AlwaysBreakTemplateDeclarations     : true,
ColumnLimit                         : 81,
IndentCaseLabels                    : false,
Standard                            : Cpp11,
IndentWidth                         : 4,
TabWidth                            : 4,
BreakBeforeBraces                   : Linux,
CommentPragmas                      : '(^ IWYU pragma:)|(^.*\[.*\]\(.*\).*$)|(^.*@brief|@param|@return|@throw.*$)|(/\*\*<.*\*/)'
Versioning
I decided to use semantic versioning
Unit Tests
I am using the great Catch automated test framework. Currently computation and command line parameters are covered by unit tests. This will be expanded on coloring algorithms in the future.
To build the unit tests application use the cmake option -DUNIT_TEST=ON
The unit tester can be run with geomandel_test. This will run all test cases and
output the result. See the Catch framework documentation for command line options
you can use to run only specific test cases, or change the application output.
Continuous Integration
Travis CI is used as continuous integration service. The geomandel github repository is linked to Travis CI. You can see the build history for the master branch and all release branches on the travis project page.
Besides testing compilation on different systems and compilers I also run the unit tests after the application was compiled successfully.
Bugs, feature requests, ideas
Please use the github bugtracker to submit bugs or feature requests
ToDo
Have a look in the todo folder. I am using the todo.txt format for my todo lists.
License
Copyright (C) 2015, 2016 Christian Rapp

This program is free software: you can redistribute it and/or modify
it under the terms of the GNU General Public License as published by
the Free Software Foundation, either version 3 of the License, or
(at your option) any later version.

This program is distributed in the hope that it will be useful,
but WITHOUT ANY WARRANTY; without even the implied warranty of
MERCHANTABILITY or FITNESS FOR A PARTICULAR PURPOSE.  See the
GNU General Public License for more details.

You should have received a copy of the GNU General Public License
along with this program.  If not, see <http://www.gnu.org/licenses/>.
Have a look into the license sub folder where license files of the used libraries are located.