NatelEnergy / Grafana Discrete Panel
Licence: mit
Show discrete events in grafana
Stars: ✭ 142
Programming Languages
typescript
32286 projects
Labels
Projects that are alternatives of or similar to Grafana Discrete Panel
Pi Hole Influx
A python daemon to send Pi-Hole stats for Grafana to InfluxDB
Stars: ✭ 126 (-11.27%)
Mutual labels: grafana
Grafana Rrd Server
A HTTP server that helps Grafana read RRD files via Grafana Simple JSON Datasource plugin
Stars: ✭ 117 (-17.61%)
Mutual labels: grafana
Globalnoc Networkmap Panel
A network map panel for Grafana
Stars: ✭ 121 (-14.79%)
Mutual labels: grafana
Grafana Import Export
shell scripts for importing and exporting Grafana's dashboards and datasources
Stars: ✭ 125 (-11.97%)
Mutual labels: grafana
Stagemonitor
an open source solution to application performance monitoring for java server applications
Stars: ✭ 1,664 (+1071.83%)
Mutual labels: grafana
Pepper Metrics
pepper metrics is a tool, it can helps you collect runtime performance use RED method, and then output as log / timeseries data, by default it use prometheus as datasource, grafana as UI
Stars: ✭ 119 (-16.2%)
Mutual labels: grafana
Grafana Influx Dashboard
Grafana InfluxDB scripted dashboard
Stars: ✭ 130 (-8.45%)
Mutual labels: grafana
Swarmprom
Docker Swarm instrumentation with Prometheus, Grafana, cAdvisor, Node Exporter and Alert Manager
Stars: ✭ 1,739 (+1124.65%)
Mutual labels: grafana
Kubernetes Book
Mastering Kubernetes with Real Life Lessons from Deploying Production Systems
Stars: ✭ 113 (-20.42%)
Mutual labels: grafana
Gpu monitor
Monitor your GPUs whether they are on a single computer or in a cluster
Stars: ✭ 133 (-6.34%)
Mutual labels: grafana
Docker Influxdb Grafana
A Docker container which runs InfluxDB and Grafana ready for persisting data
Stars: ✭ 130 (-8.45%)
Mutual labels: grafana
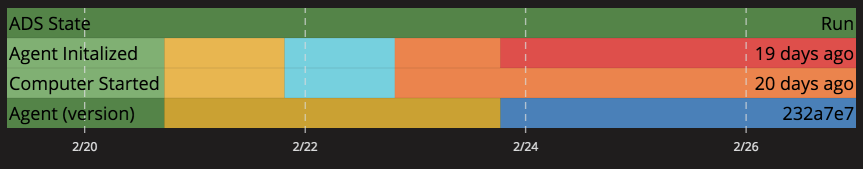
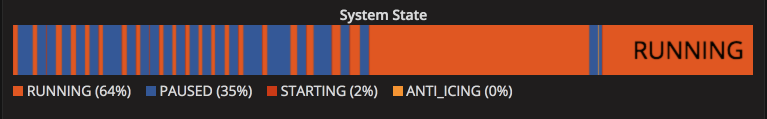
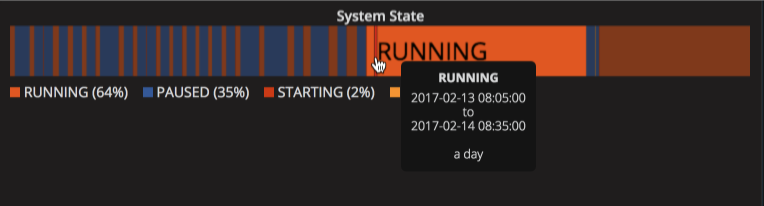
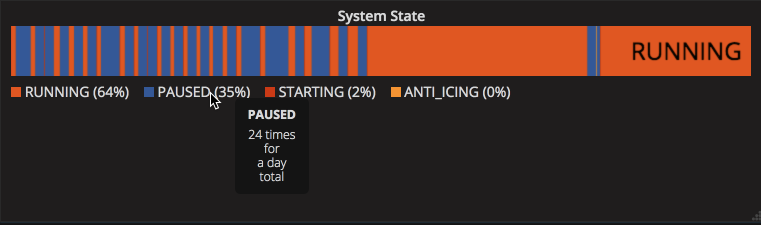
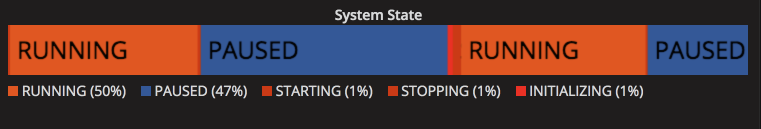
Discrete Panel


This panel shows discrete values in a horizontal graph. This lets show state transitions clearly. It is a good choice to display string or boolean data
Screenshots
Building
To complie, run:
yarn install
yarn build
Releasing
This plugin uses release-it to release to GitHub.
env GITHUB_TOKEN=your_token yarn release-it patch
Roadmap
- TODO: full annotation support
- TODO: better documentation
- release v1.0
Changelog
v0.1.0
- works with Grafana 7 (naming fixed)
- Building with
@grafana/toolkit - Supports DataFrame directly for 6.4+
v0.0.9
- Remove
distfrom master - Use webpack build
- FIX: Use background color to clear the background
- Configurable duration resolution option (thanks @clink-aaron)
- deploy using release-it
- Don't hide series names on hover
v0.0.8
- Support Snapshots (thanks @londonanthonyoleary)
- Direct link rendered image now works.
- Support UTC date display
- Fix display issue with 5.1
- Merge distinct values in legend unless showing the name
- Basic Annotation Support
- Fix mapping numeric data to text
v0.0.7
- Switch to typescript
- Override applyPanelTimeOverrides rather than issueQueries to extend time
- Support numeric unit conversion
- New rendering pipeline (thanks @jonyrock)
- Don't detect duplicate colors from metrics
- Formatting with prettier.js
- Only hide hover text when it collides
- Show time axis (copied from novatec-grafana-discrete-panel)
- Improved text collision behavior
v0.0.6
- Fix for grafana 4.5 (thanks @alin-amana)
v0.0.5
- Support results from the table format
- Support results in ascending or decending order
- Configure legend percentage decimal points
- Legend can show transition count and distinct value count
- Clamp percentage stats within the query time window
- Changed the grafana dependency version to 4.x.x, since 3.x.x was not really supported
- Fixed issues with tooltip hover position
- Option to expand 'from' query so the inital state can avoid 'null'
v0.0.4
- Support shared tooltips (not just crosshair)
v0.0.3
- Configure more colors (retzkek)
- Fix tooltips (retzkek)
- Configure Text Size
- Support shared crosshair
v0.0.2
- Use the panel time shift.
v0.0.1
- First working version
Note that the project description data, including the texts, logos, images, and/or trademarks,
for each open source project belongs to its rightful owner.
If you wish to add or remove any projects, please contact us at [email protected].