Grafana Plugin for TDengine
- Installation
- Usage
- Monitor TDengine Database with TDengine Data Source Plugin
- Docker Stack
- Dashboards
TDengine is open-sourced big data platform under GNU AGPL v3.0, designed and optimized for the Internet of Things (IoT), Connected Cars, Industrial IoT, and IT Infrastructure and Application Monitoring, developed by TAOS Data.
TDengine data source plugin is developed for Grafana. This document explains how to install and configure the data source plugin, and use it as a time-series database. We'll take a look at the data source options, variables, querying, and other options specific to this data source.
At first, please refer to Add a data source for instructions on how to add a data source to Grafana. Note that, only users with the organization admin role can add data sources.
Installation
We recommend you use the prebuilt package of the plugin in github latest release download page.
Option 1, you can install the TDengine data source plugin with grafana-cli.
sudo -u grafana grafana-cli \
  --pluginUrl https://github.com/taosdata/grafanaplugin/releases/download/v3.1.3/tdengine-datasource-3.1.3.zip \
  plugins install tdengine-datasource
Option 2, you can install the plugin manually.
# make sure to use the right plugins directory
GF_PLUGINS_DIR=/var/lib/grafana/plugins
# install plugin
V=3.1.3
wget -c https://github.com/taosdata/grafanaplugin/releases/download/v$V/tdengine-datasource-$V.zip
sudo -u grafana unzip -oq tdengine-datasource-$V.zip -d $GF_PLUGINS_DIR
sudo -u grafana sh -c "chmod +x $GF_PLUGINS_DIR/tdengine-datasource/tdengine-datasource*"
Here is a unified shell script to automatically download and install the latest plugin in a Grafana server.
# make sure to use the right plugins directory
GF_PLUGINS_DIR=/var/lib/grafana/plugins

get_latest_release() {
  curl --silent "https://api.github.com/repos/taosdata/grafanaplugin/releases/latest" |
    grep '"tag_name":' |
    sed -E 's/.*"v([^"]+)".*/\1/'
}
install_plugin() {
  V=$1
  [ -f tdengine-datasource-$V.zip ] ||
    wget -c https://github.com/taosdata/grafanaplugin/releases/download/v$V/tdengine-datasource-$V.zip
  sudo -u grafana unzip -oq tdengine-datasource-$V.zip -d $GF_PLUGINS_DIR
  sudo -u grafana sh -c "chmod +x $GF_PLUGINS_DIR/tdengine-datasource/tdengine-datasource*"
}

install_plugin $(get_latest_release)
Option 3, if you use the plugin in docker, just set the environment GF_INSTALL_PLUGINS like GF_INSTALL_PLUGINS=https://github.com/taosdata/grafanaplugin/releases/download/v3.1.3/tdengine-datasource-3.1.3.zip;tdengine-datasource, or refer to Build and run a Docker image with pre-installed plugins to pre-build a custom Grafana image with the TDengine data source plugin.
Option 4, build and install this plugin by yourself. You should following the CONTRIBUTING steps to setup develop environment and build the plugin.
yarn build:allThen copy the dist/ directory to Grafana plugin directory.
sudo -u grafana rsync -rlzP dist/ /var/lib/grafana/plugins/tdengine-datasourceIt will also generate a zipped package named tdengine-datasource-<version>.zip for distribution.
Note that the plugin has not been published to https://grafana.com officially (the plugin is under review, as if you want to know) - that means the plugin is unsigned for public use. So if you use it in 7.x and 8.x of grafana, you should configure in /etc/grafana/grafana.ini by add these lines to allow unsigned plugin before start the Grafana server.
[plugins]
allow_loading_unsigned_plugins = tdengine-datasource
Or use environment variable GF_ALLOW_LOADING_UNSIGNED_PLUGINS=tdengine-datasource in docker and other container-based environments.
In any particular scenario, if you need a signed plugin, please follow the Sign a plugin instructions to sign a private plugin. Commands may be like this:
export GRAFANA_API_KEY=<YOUR_API_KEY>
yarn run grafana-toolkit plugin:sign \
  --signatureType private \
  --rootUrls 'http://localhost:3000'
rootUrls is your local grafana server url.
The next step is restart the Grafana server. The new data source should now be available in the data source type dropdown in the Add Data Source view. For systemd based system, the restart command is:
sudo systemctl restart grafana-serverFor SysVInit based system (CentOS 6 etc.):
sudo service grafana-server restartUsage
Now it's ready for you to add your own TDengine data source and use it in a dashboard. Refer to Grafana Datasource documentations topic - Add a data source for a quick view.
Add Data Source
Point to Configurations -> Data Sources menu and then Add data source button.

Search and choose TDengine.

If TDengine is not in the list, please check the installation instructions for allowing loading unsigned plugins.
Configure TDengine data source.

Save and test it, it should say 'TDengine Data source is working'.

Import Dashboard
Point to + / Create - import (or /assets/import url).

Now you can import dashboard with JSON file or grafana dashboard id (please make sure your network is public to https://grafana.com).
Here is the first grafana dashboard you want to use for TDengine, the grafana dashboard id is 15146.
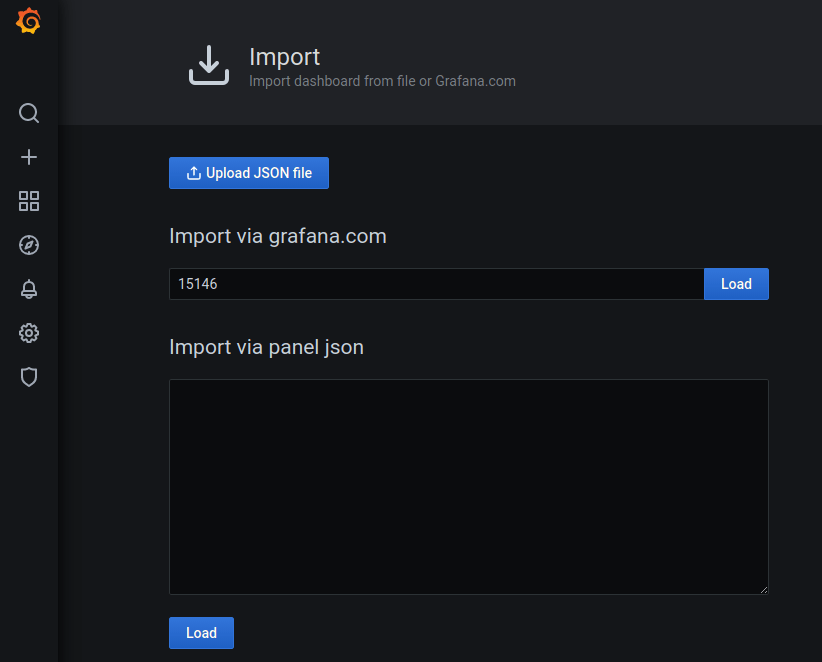
After load:
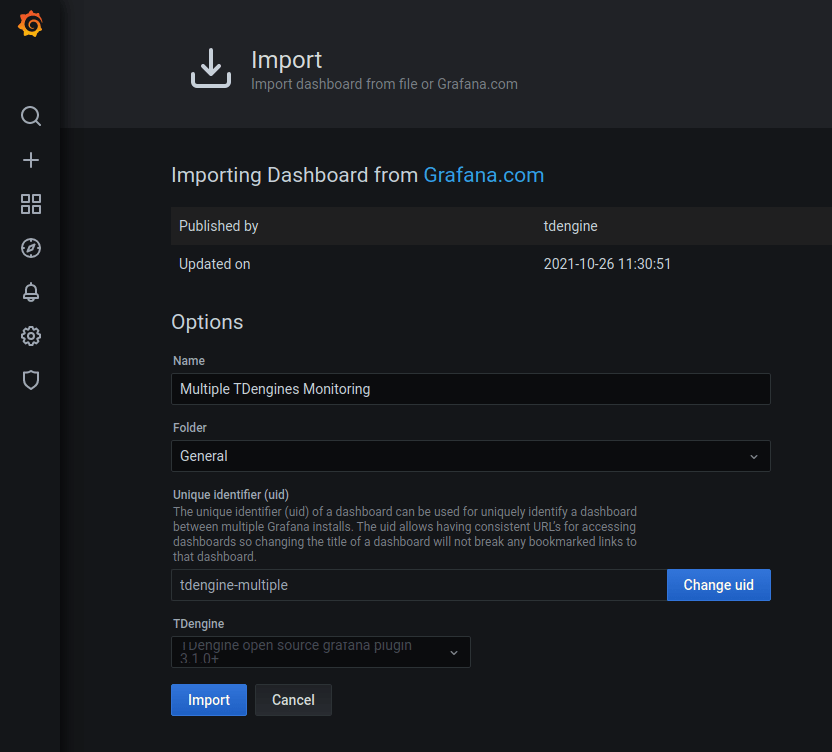
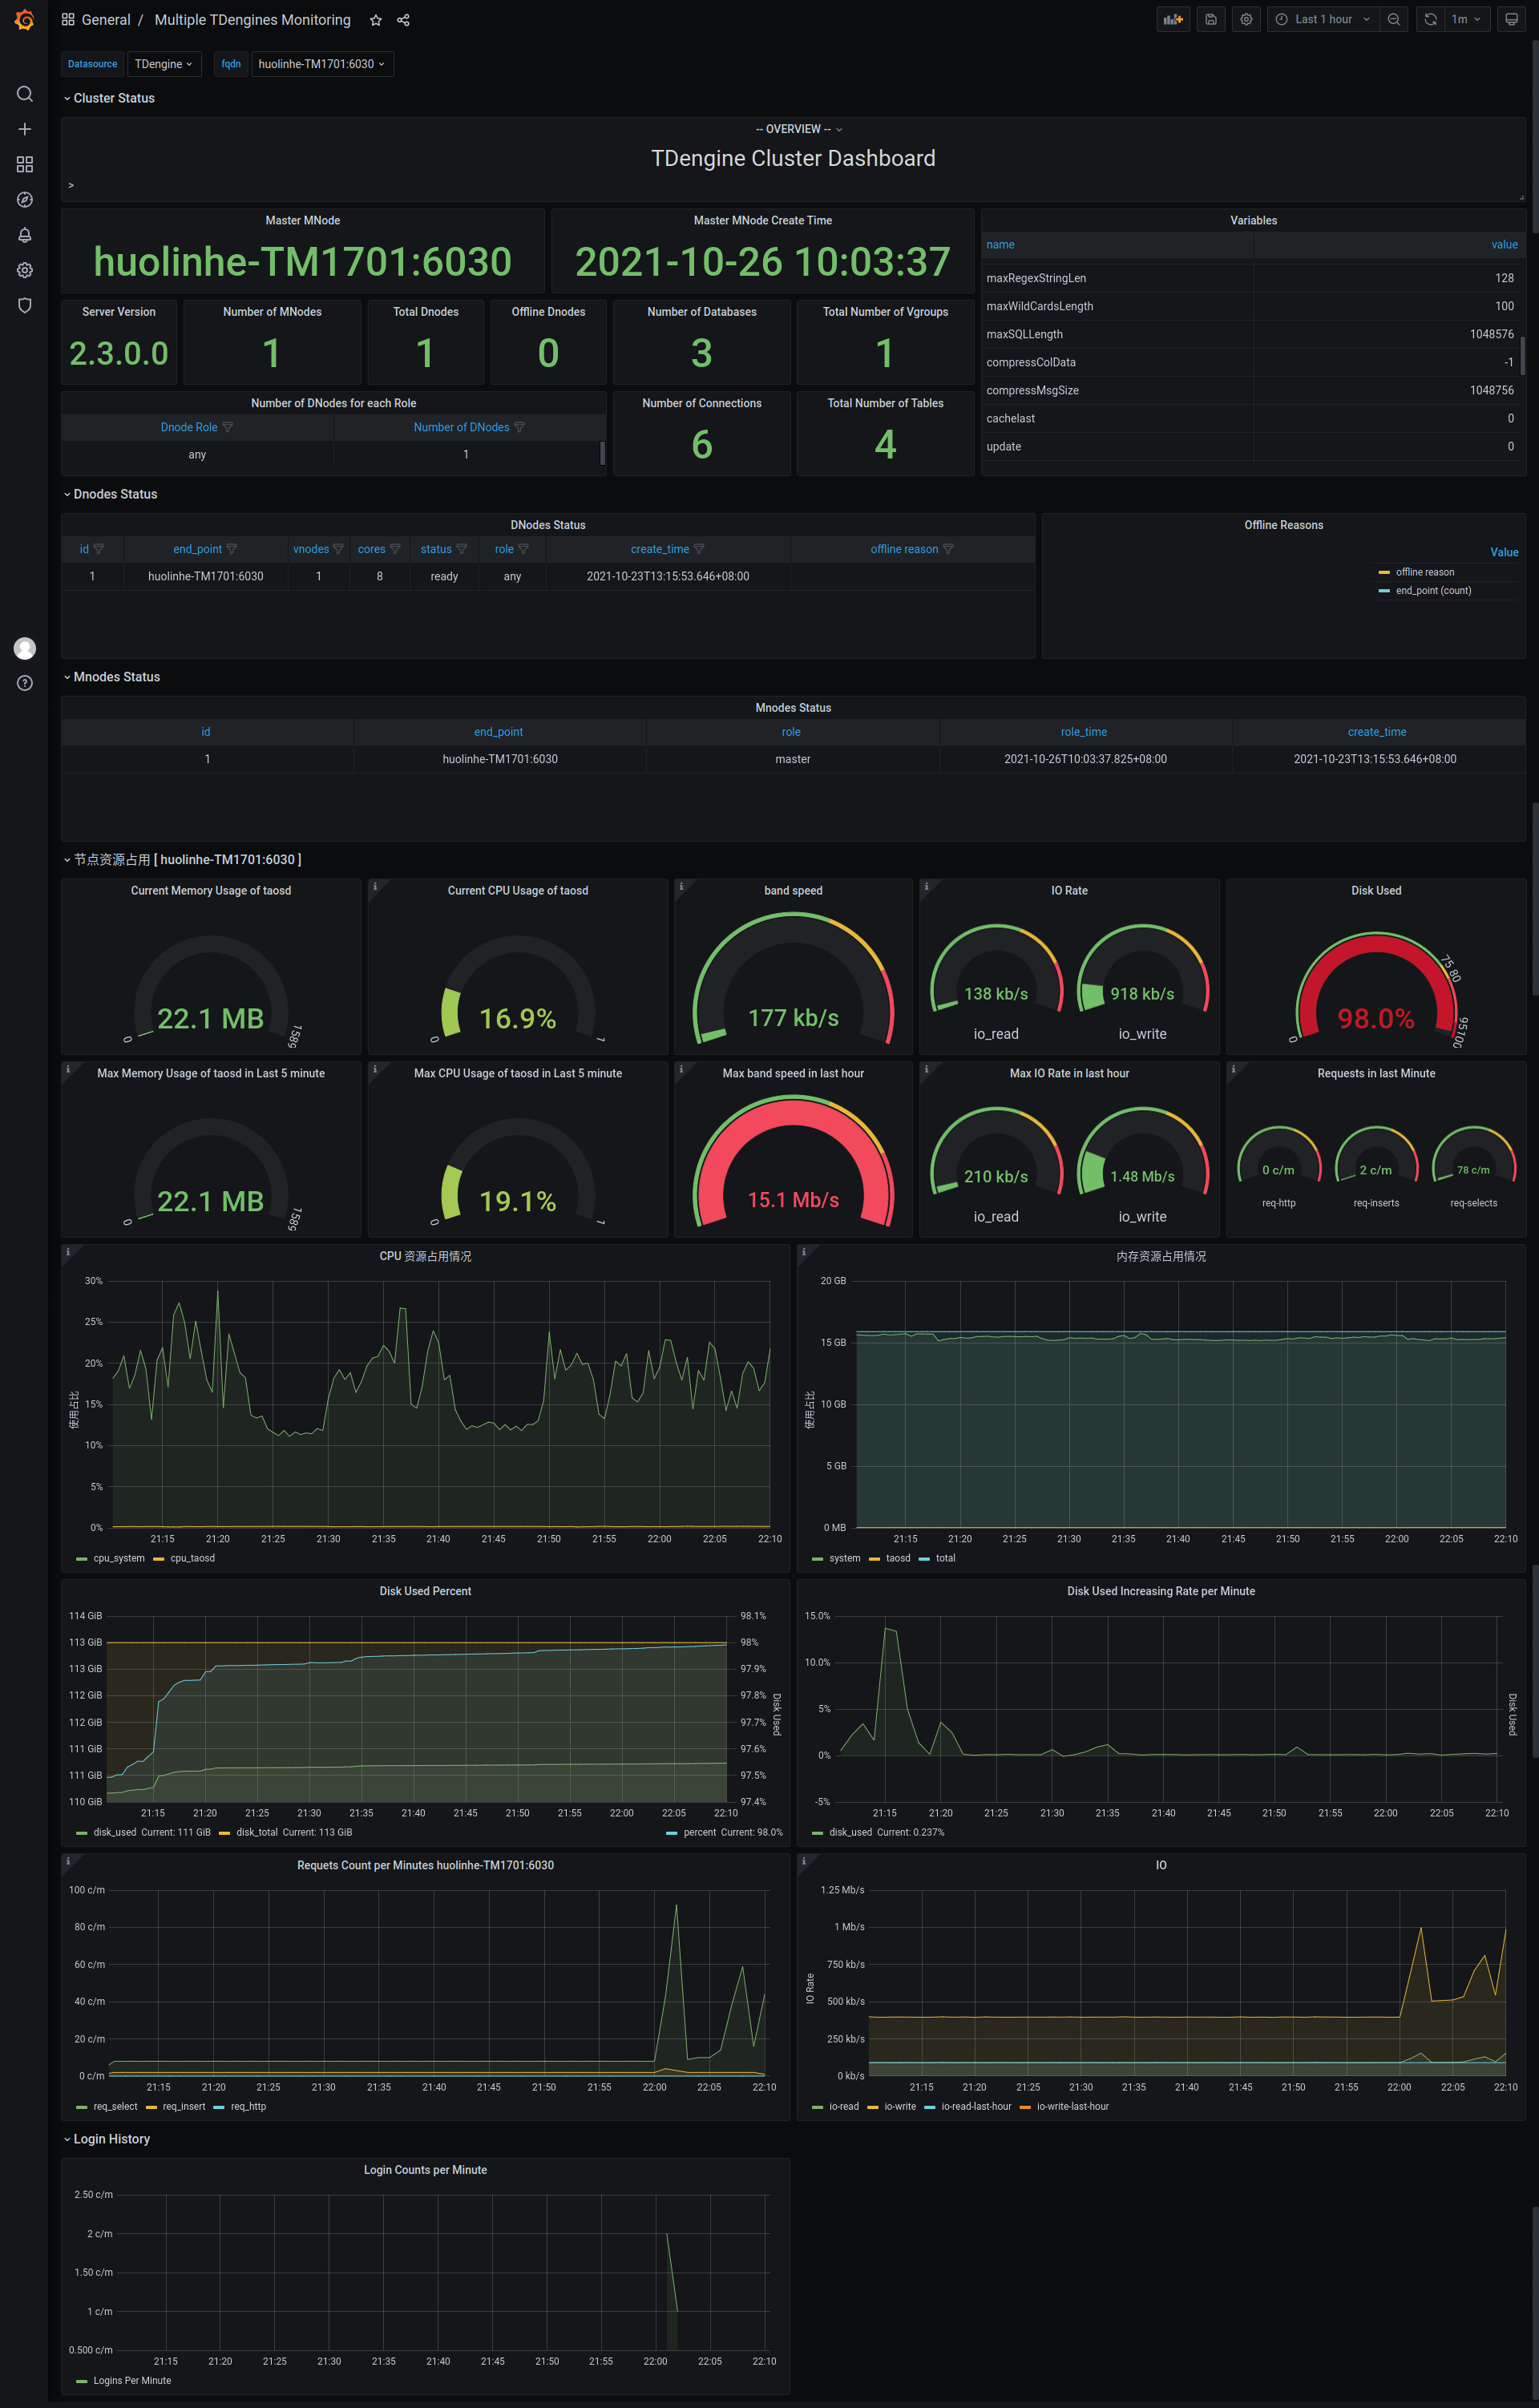
After import:
Alert Feature
Now TDengine data source plugin provides basic alert feature support by backend plugin since version 3.1.0. But it has some known limits currently:
- The sql statement only supports two variables:
$fromand$to. - When using grafana's alert function, you must use
SQLas theTypeoption. That means, arithmetic expression will not work as you expected for alert. - In addition, only
ALIAS BYandINPUT SQLare valid. So alert does not work if you requires the time-shift feature.
We've published a dashboard (15155) for you to under stand how alert working.
Here is the details:
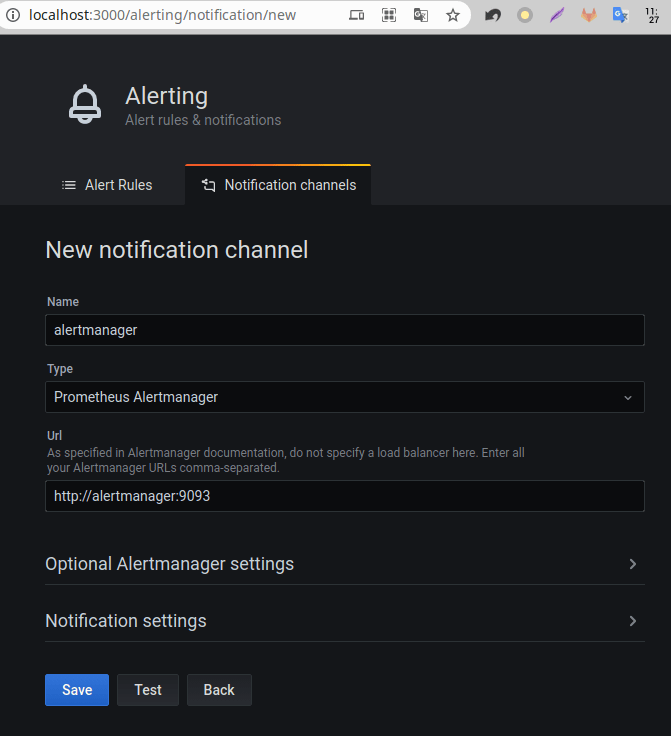
First, you should have a notification channel, if no, add a new one in http://localhost:3000/alerting/notification/new(here we use AlertManager for test, we also provides a webhook example here, in webhook/ directory)
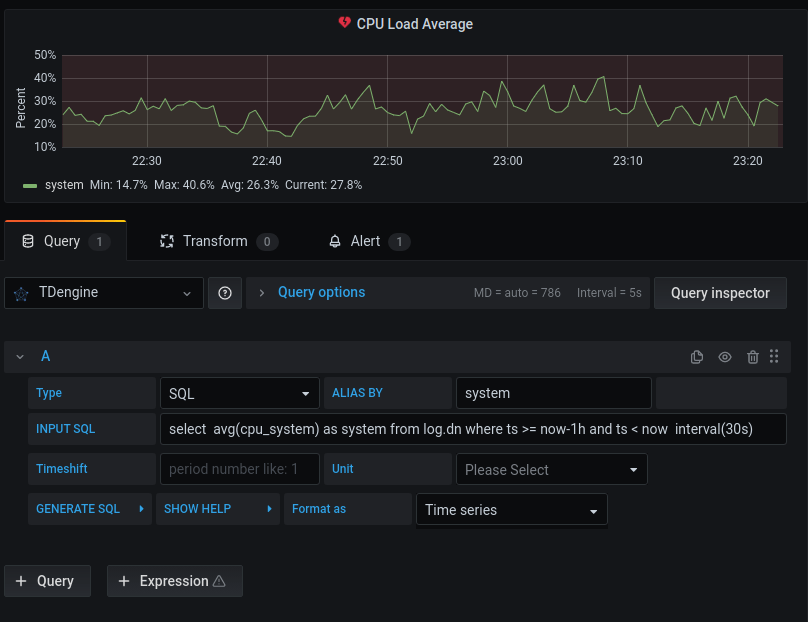
Second, set the alert query in panel like this:
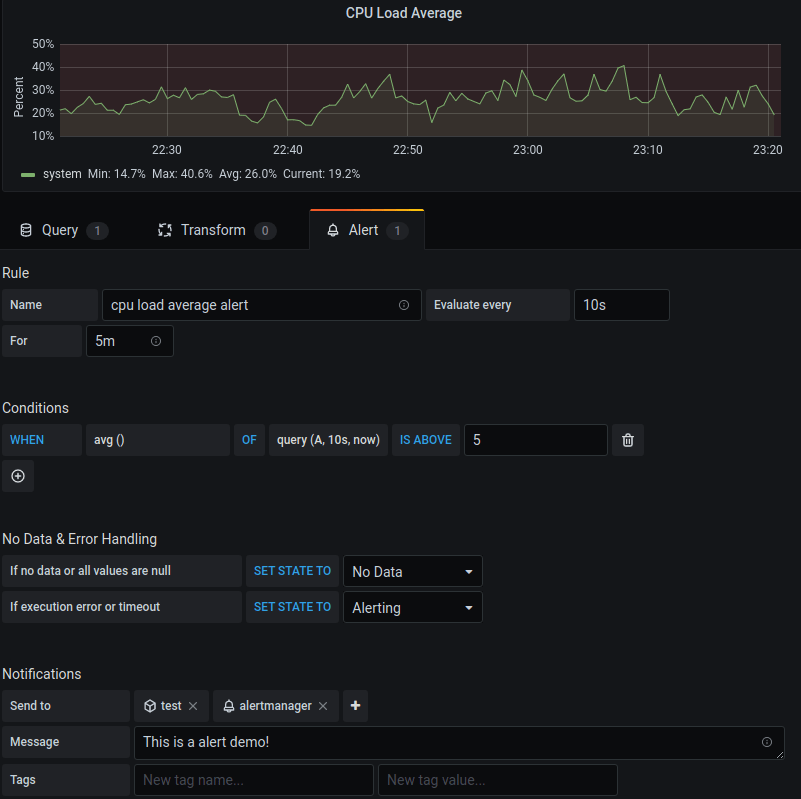
Config the alert rule and notifications:
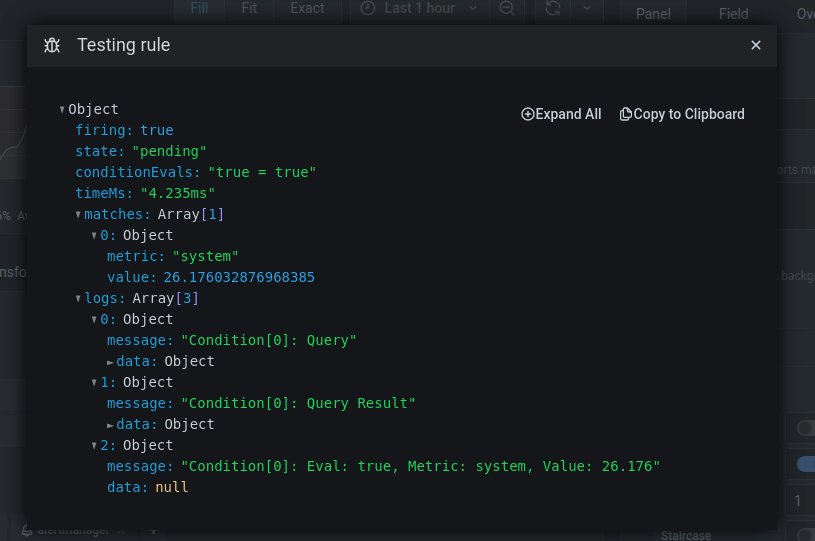
Test it with Test rule button, it should return firing: true:
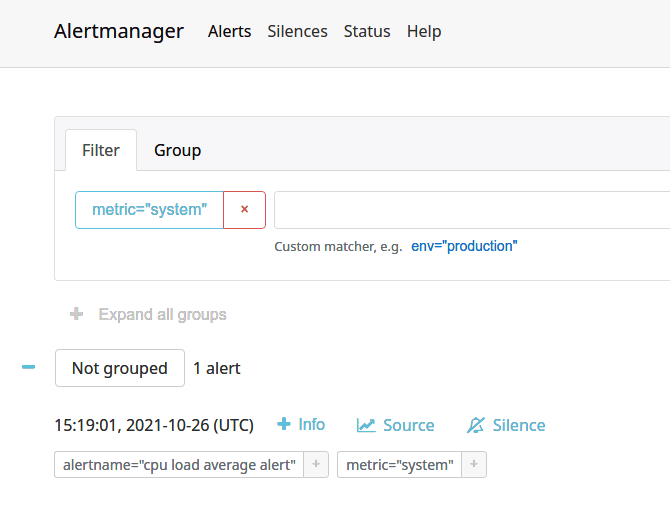
In alert manager dashboard, you could see the alert:
Monitor TDengine Database with TDengine Data Source Plugin
See How to Monitor TDengine Cluster with Grafana for the details.
TDinsight
TDinsight is a simple monitoring solution for TDengine database. See TDinsight README for the details.
Docker Stack
For a quick look and test, you can use docker-compose to start a full Grafana + AlertManager + Alert Webhook stack:
docker-compose up -dServices:
- Grafana: http://localhost:3000
- AlertManager: http://localhost:9093, in docker it's http://alertmanager:9010/sms
- Webhook: http://localhost:9010/sms, in docker it's http://webhook:9010/sms
Dashboards
You can get other dashboards in the examples directory, or search in grafana with TDengine datasource https://grafana.com/grafana/dashboards/?orderBy=downloads&direction=desc&dataSource=tdengine-datasource .
Here is a short list:
You could open a pr to add one if you want to share your dashboard with TDengine community, we appreciate your contribution!