GraphQL Data Source
![]()
Grafana datasource plugin that provides access to a GraphQL API for numerical timeseries data, general/tabular data, annotations, and dashboard variables.
- The GraphQL query must be structured so that the data of interest is returned
under the configurable data path (default
data) in the response. If the object at that path is an array it will be iterated over, with each object added as a row in the data frame, otherwise the result object will be the only row.- Can be separated by commas to use multiple data paths
- Timeseries data must include a timestamp field under the data path, default
Time, in ISO8601 or a configurable custom format. - Nested types will be flattened into dot-delimited fields.
- Grafana variables should be substituted directly in the query (instead of
using GraphQL variables). The dashboard time ranges are available in the
global variables
$__fromand$__toas millisecond epoch (or in whatever format is needed by the API in Grafana 7.1.2 or later). - Group by can be used to group elements into multiple data points.
- Alias by is used to alter the name of the field displayed in the legend.
$field_<field.name>is substituted with the values of the field and$fieldNameis substituted with the name of the field.
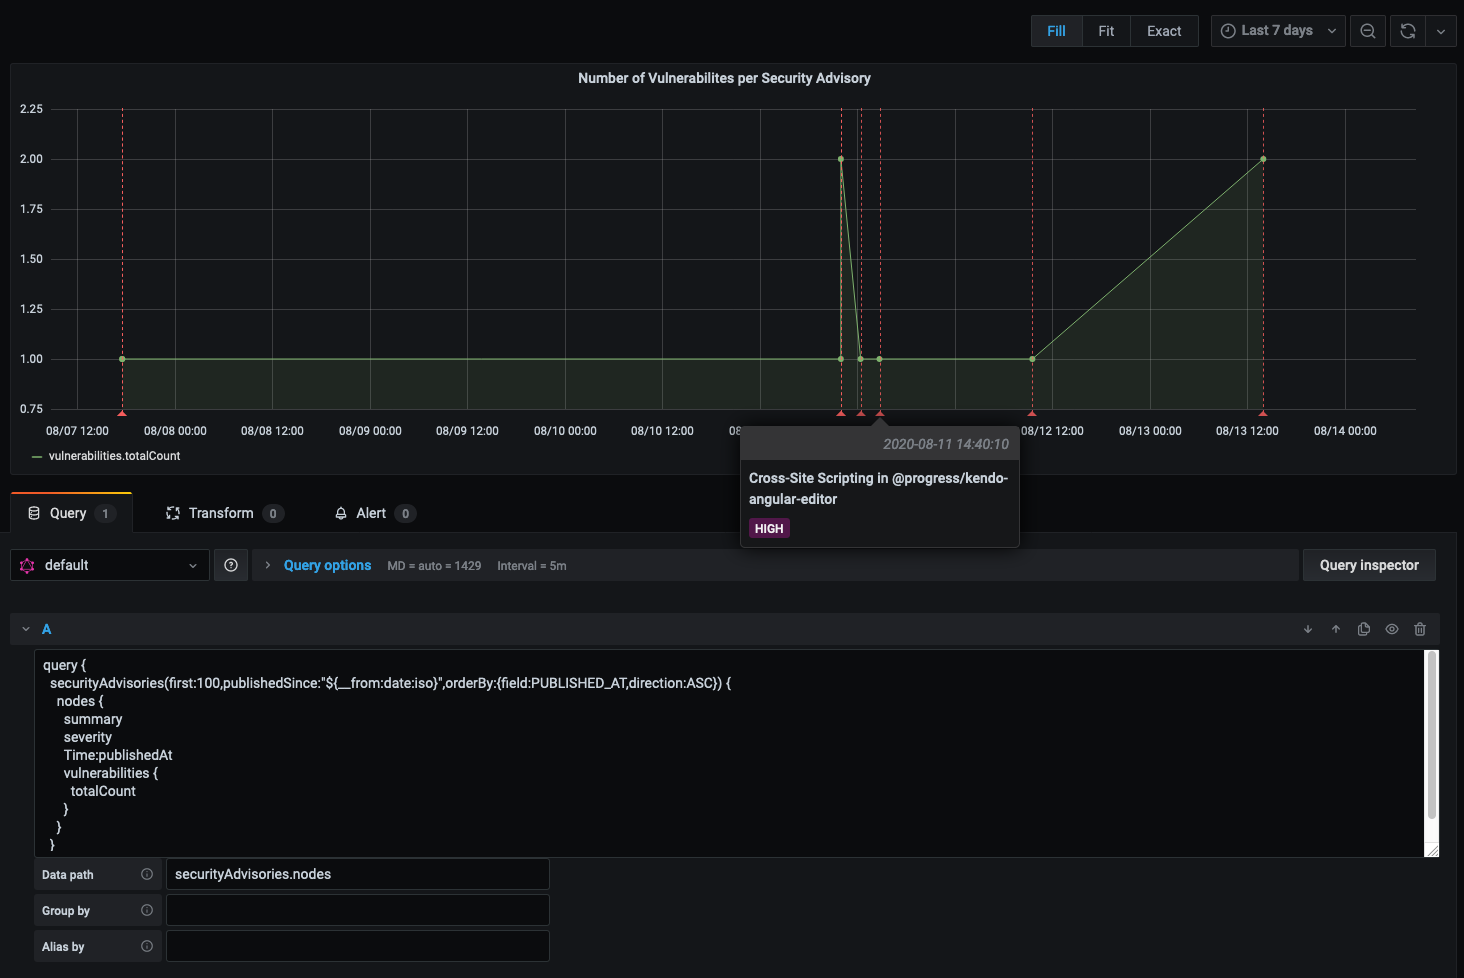
Screenshots
Examples
Below are some example queries demonstrating how to use the plugin, using the FIFEMon GraphQL test source server, which also includes a dashboard demonstrating these queries.
Basic timeseries
query {
  data: simple_series(from: "${__from:date:iso}", to: "${__to:date:iso}", interval_ms: $__interval_ms) {
    Time: timestamp
    value
  }
}
Note the use of the global $__from and $__to variables to insert the
dashboard time range into the query and the use of $__interval_ms to specify
the appropriate time interval for the graph.
Custom time format
query {
  simple_series(
    from: "${__from:date:iso}"
    to: "${__to:date:iso}"
    interval_ms: $__interval_ms
    format: "MM.dd.uuuu HHmmss"
  ) {
    timestamp
    value
  }
}- Data path:
simple_series - Time path:
timestamp - Time format:
MM.DD.YYYY HHmmss
Alias and group by
query {
  complex_series(from: "${__from:date:iso}", to: "${__to:date:iso}", interval_ms: $__interval_ms) {
    time {
      timestamp
    }
    value
    group {
      id
      name
    }
  }
}- Data path:
complex_series - Time path:
time.timestamp - Group by:
group.id - Alias by:
$field_group.name
In the above example, "Group by" and "Alias by" are defined. "Group by" allows
you to split up an array of data into multiple data points. "Alias by" is used
as the name of the data point. You can make alias use text from the query or
even the field name by using $field_<your.field.name> for the value of the
field, or $fieldName for the name of the field. If $fieldName was used, it
would be replaced by "value" because that's the name of the field. If
$field_group.name was used, it would be replaced with the value
of name. Using $fieldName can be useful if you're querying multiple
numeric fields that you want displayed in your graph.
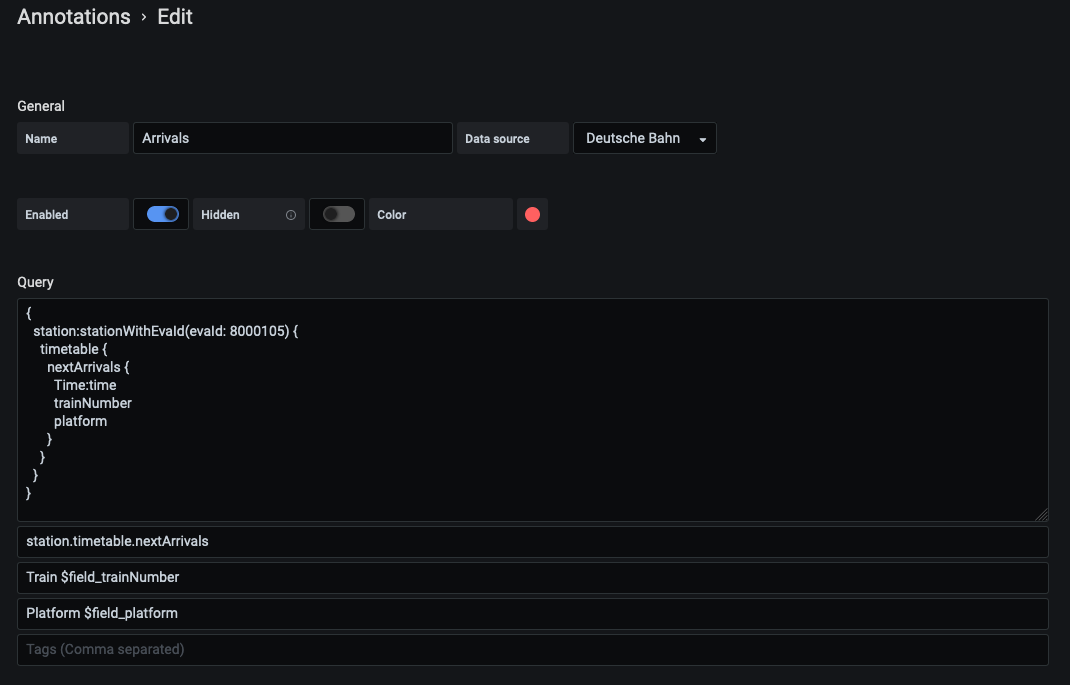
Annotations
query {
  events(from: "${__from:date:iso}", to: "${__to:date:iso}", end: true) {
    timestamp
    end_timestamp
    name
    description
    tags
  }
}- Data path:
events - Time path:
timestamp - End time path:
end_timestamp - Title:
$field_name - Text:
$field_description - Tags:
tag1, tag2
The above annotation example is similar to regular queries. You are able to
define a data path, time path, and time format. Similar to the last example, you
can also substitute values into the title, text, and tags by using
$field_<field name>. Tags are separated by commas. The above example has two
tags: "tag1" and "tag2".
If the optional end time field is defined and present, the annotation will be shown over a period of time.
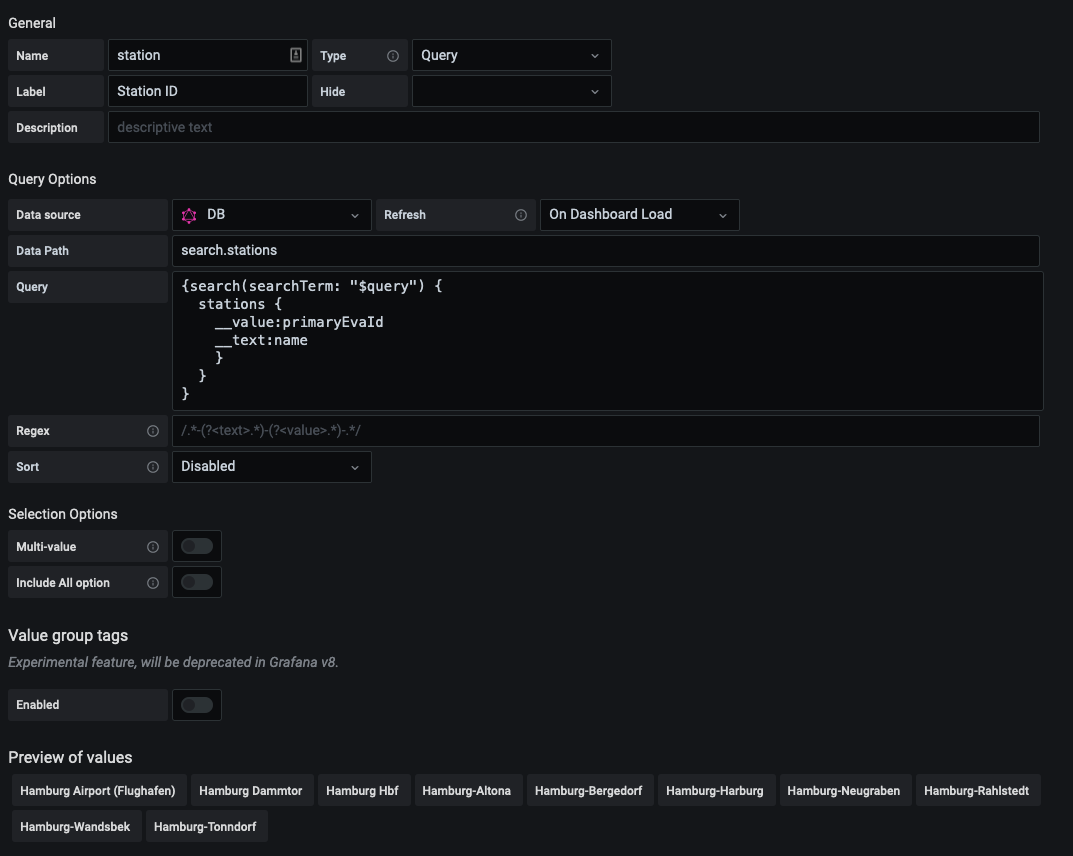
Dashboard Variable Queries
Dashboard variables can be populated by a GraphQL query that returns an array of
objects. If the objects contain both __text and __value fields then they
will be used (the __text field will be displayed, the __value field will be
used in substitutions). Otherwise the values of all fields will be appended to
the variable value list.
query {
  groups {
    __value: id
    __text: name
  }
}- Data path:
groups