AppDynamics Apache Hadoop Monitoring Extension
This extension works only with the standalone machine agent.
Use Case
The Hadoop monitoring extension captures metrics from Hadoop Resource Manager and/or Apache Ambari and displays them in AppDynamics Metric Browser.
Metrics include:
- Hadoop Resource Manager
- App status and progress
- Memory usage
- Container usage and status
- Node count and status
- Scheduler capacity, app and container count
- Ambari
- Individual host metrics including CPU, disk, memory, JVM, load, network, process, and RPC metrics
- Service metrics for HDFS, YARN, MapReduce, HBase, Hive, WebHCat, Oozie, Ganglia, Nagios, and ZooKeeper
Prerequisites
- Before the extension is installed, the prerequisites mentioned here need to be met. Please do not proceed with the extension installation if the specified prerequisites are not met.
- Hadoop distribution that features Hadoop YARN. Distributions based on Hadoop 2.x should include YARN
- Examples: hadoop-2.x, hadoop-0.23.x, CDH4 from Cloudera, HDP 2 from Hortonworks, and Pivotal HD from Pivotal
- Resource Manager hostname and port
OR - Any release of Apache Amabri
- Any version of Hadoop cluster installed via Ambari
- Ambari server hostname, port, username, and password
If the cluster version is 1.x and not installed by Ambari, no metrics can be gathered at this time.
Installation
Steps
- To build from source, clone this repository and run
mvn clean install. This will produce a HadoopMonitor-VERSION.zip in the target directory. - Unzip as "HadoopMonitor" and copy the "HadoopMonitor" directory to
<MACHINE_AGENT_HOME>/monitors. - Configure the extension by referring to the below section.
- Open
<MACHINE_AGENT_HOME>/monitors/HadoopMonitor/config.ymland configure the HRM and/or Ambari parameters. - Restart the machine agent.
Please place the extension in the "monitors" directory of your Machine Agent installation directory. Do not place the extension in the "extensions" directory of your Machine Agent installation directory.
Configuration
config.yml
Note : Please make sure to not use tab (\t) while editing yaml files. You may want to validate the yaml file using a yaml validator
Configure Metric Prefix
Please follow section 2.1 of the Document to set up metric prefix.
# Use this only if SIM is enabled
#metricPrefix: "Custom Metrics|Hadoop|"

# If SIM is not enabled, then use this
metricPrefix:  "Server|Component:<TIER_ID>|Custom Metrics|Hadoop|"
Configure servers section
#Please ensure that appropriate "type" is configured for all servers. "type" can be any of "resourceManagerMonitor" or "ambariMonitor" only.
servers:
 - uri: "http://localhost:8088"
   username: "admin"
   password: "admin"
   encryptedPassword: ""
   name: "RM Server"
   type: "resourceManagerMonitor"

#Ambari server can be configured with type as ambariMonitor
 - uri: "http://localhost:8088/api/v1"
   username: "admin"
   password: "admin"
   encryptedPassword: ""
   name: "Ambari Server"
   type: "ambariMonitor"

#Password Encryption Support.
#encryptionKey: welcome

connection:
socketTimeout: 20000
connectTimeout: 20000
sslCertCheckEnabled: false
sslVerifyHostname: false


#Please do not remove any of the below monitor. Just configure the appropriate applications/filters based on type specified for your server.
resourceManagerMonitor:
# This will monitor the type of applications in the monitoringTimePeriod
# Only the aggregate of State and Finished Status will be reported
applications:
 - type: "MAPREDUCE"
   names: [".*"]
#In Minutes
monitoringTimePeriod: 30


ambariMonitor:
# Regex expressions are supported in the filters
filters:
 clusters:
   includes: ['.*']
 hosts:
   includes: ['.*']
 services:
   includes: ['.*']
monitor.xml
Configure the path to the config.yml file by editing the in the monitor.xml file in the <MACHINE_AGENT_HOME>/monitors/HadoopMonitor/ directory.
Below is the sample
     <task-arguments>
         <!-- config file-->
         <argument name="config-file" is-required="true" default-value="monitors/HadoopMonitor/config.yml" />
          ....
     </task-arguments>
Note : By default, a Machine agent or a AppServer agent can send a fixed number of metrics to the controller. To change this limit, please follow the instructions mentioned here. For eg.
java -Dappdynamics.agent.maxMetrics=2500 -jar machineagent.jar
Metrics
Hadoop Resource Manager:
http://hadoop.apache.org/docs/current/hadoop-yarn/hadoop-yarn-site/ResourceManagerRest.html
ClusterMetrics
Nodes
SchedulerInfo
AggregatedApps
Metrics under AggregatedApps are aggregated metrics from all running and recently finished apps. To specify the period for which metrics are gathered, set aggregateAppPeriod in config.yml.
Ambari
https://github.com/apache/ambari/blob/trunk/ambari-server/docs/api/v1/index.md#monitoring
Host Metrics
| Metric Name | Description |
|---|---|
| cpu | CPU usage |
| disk | Disk usage (GB) |
| jvm | JVM log message count, memory usage, and thread count |
| load | Host load in 15, 5, and 1 min averages |
| memory | Memory usage (KB) |
| network | Bytes in/out, packets in/out |
| process | Process count |
| rpc | RPC process time, queue time, sent and received bytes |
| rpcdetailed | Additional RPC metrics |
| ugi | User Group Information |
| part_max_used | Percent disk usage |
| state | Host state |
Service Specific Metrics
| Metric Name | Description |
|---|---|
| dfs | HDFS specific metrics |
| yarn | YARN specific metrics |
| mapred | MapReduce specific metrics |
| hbase | HBase specific metrics |
Host States
| State | Value | Description |
|---|---|---|
| INIT | 0 | New host state. |
| WAITING_FOR_HOST_STATUS_UPDATES | 1 | Registration request is received from the Host but the host has not responded to its status update check. |
| HEALTHY | 2 | The server is receiving heartbeats regularly from the host and the state of the host is healthy. |
| HEARTBEAT_LOST | 3 | The server has not received a heartbeat from the host in the configured heartbeat expiry window. |
| UNHEALTHY | 4 | Host is in unhealthy state as reported either by the Host itself or via any other additional means ( monitoring layer ). |
Service, Service Component and Host Component States
| State | Value | Description |
|---|---|---|
| INIT | 0 | The initial clean state after the service is first created. |
| INSTALLING | 1 | In the process of installing the service. |
| INSTALL_FAILED | 2 | The service install failed. |
| INSTALLED | 3 | The service has been installed successfully but is not currently running. |
| STARTING | 4 | In the process of starting the service. |
| STARTED | 5 | The service has been installed and started. |
| STOPPING | 6 | In the process of stopping the service. |
| UNINSTALLING | 7 | In the process of uninstalling the service. |
| UNINSTALLED | 8 | The service has been successfully uninstalled. |
| WIPING_OUT | 9 | In the process of wiping out the installed service. |
| UPGRADING | 10 | In the process of upgrading the service. |
| MAINTENANCE | 11 | The service has been marked for maintenance. |
| UNKNOWN | 12 | The service state can not be determined. |
Service component
| Metric Name | Description |
|---|---|
| CPU | CPU usage |
| Disk | Disk usage (GB) |
| JVM | JVM log message count, memory usage, and thread count |
| Load | Component load in 15, 5, and 1 min averages |
| Memory | Memory usage (KB) |
| Network | Bytes in/out, packets in/out |
| Process | Process count |
| RPC | RPC process time, queue time, sent and received bytes |
| RPCdetailed | Additional RPC metrics |
| UGI | User Group Information |
| State | Component state |
Credentials Encryption
Please visit this page to get detailed instructions on password encryption. The steps in this document will guide you through the whole process.
Extensions Workbench
Workbench is an inbuilt feature provided with each extension in order to assist you to fine tune the extension setup before you actually deploy it on the controller. Please review the following document on How to use the Extensions WorkBench.
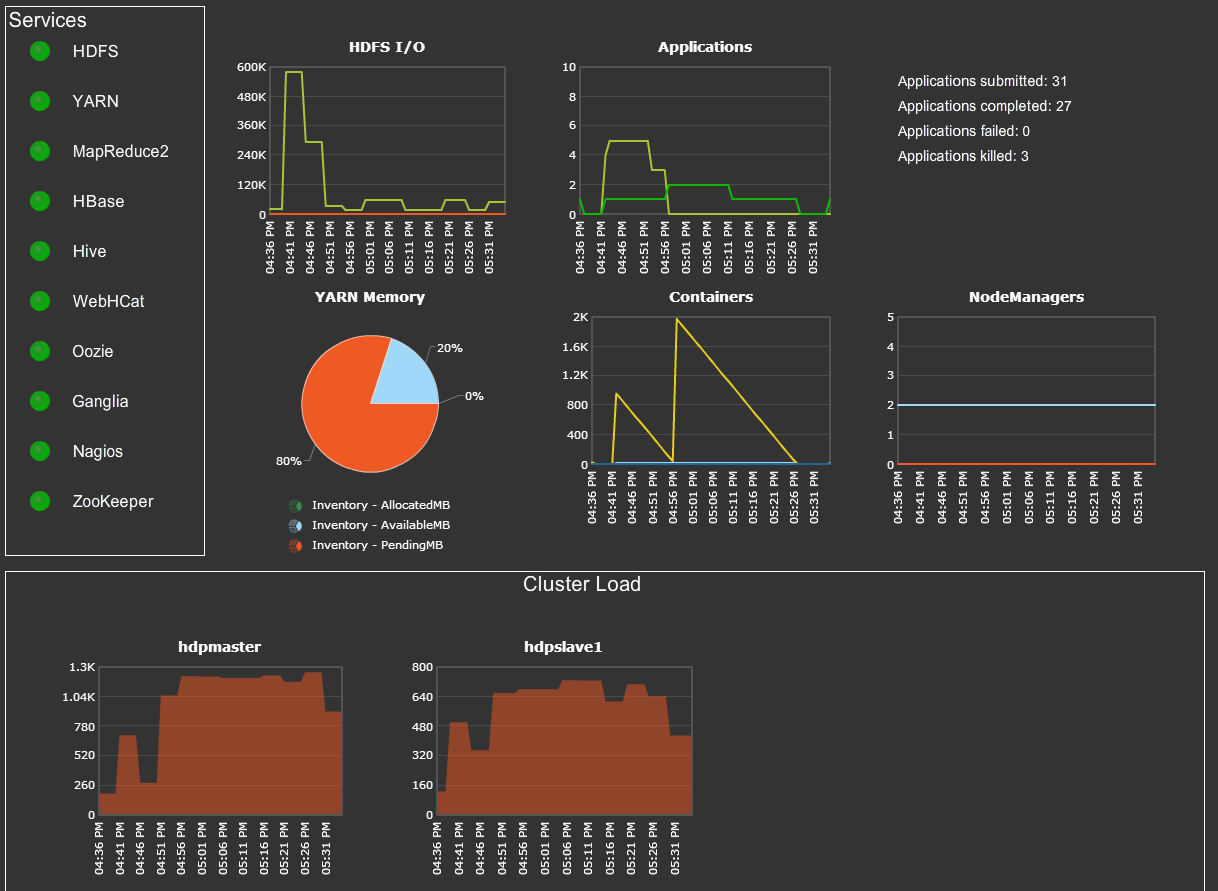
Custom Dashboard
Hadoop 1

Hadoop 2
Troubleshooting
Please follow the steps listed in this troubleshooting-document in order to troubleshoot your issue. These are a set of common issues that customers might have faced during the installation of the extension.
Contributing
Always feel free to fork and contribute any changes directly here on GitHub.
Version
| Name | Version |
|---|---|
| Extension Version | 3.0.0 |
| Product Tested on | 2.7.0 |
| Last Update | 21/06/2021 |
| Changes list | ChangeLog |
Note: While extensions are maintained and supported by customers under the open-source licensing model, they interact with agents and Controllers that are subject to AppDynamics’ maintenance and support policy. Some extensions have been tested with AppDynamics 4.5.13+ artifacts, but you are strongly recommended against using versions that are no longer supported.