All Projects → ilgizar → Ilgizar Candlestick Panel

ilgizar / Ilgizar Candlestick Panel

Licence: mit
Grafana candlestick panel plugin

Programming Languages

javascript
184084 projects - #8 most used programming language

Labels

Projects that are alternatives of or similar to Ilgizar Candlestick Panel

Pyecharts Snapshot
renders the output of pyecharts as png, jpeg, gif, svg, eps, pdf and raw base64
Stars: ✭ 142 (-18.86%)
Mutual labels:  chart
Vue Orgchart
🌿 Vue.js wrapper for OrgChart.js
Stars: ✭ 167 (-4.57%)
Mutual labels:  chart
Tcharts.js
📉 Lightweight and fast terminal ASCII charts for nodejs and browser.
Stars: ✭ 172 (-1.71%)
Mutual labels:  chart
Aachartkit Swift
📈📊📱💻🖥️An elegant modern declarative data visualization chart framework for iOS, iPadOS and macOS. Extremely powerful, supports line, spline, area, areaspline, column, bar, pie, scatter, angular gauges, arearange, areasplinerange, columnrange, bubble, box plot, error bars, funnel, waterfall and polar chart types. 极其精美而又强大的跨平台数据可视化图表框架,支持柱状图、条形图、…
Stars: ✭ 1,962 (+1021.14%)
Mutual labels:  chart
Android Linechart
📈一个简单的折线,贝塞尔曲线图表控件,高度可扩展,支持动态显示。
Stars: ✭ 157 (-10.29%)
Mutual labels:  chart
D3 Layout Narrative
A d3 layout for creating XKCD style narrative charts
Stars: ✭ 168 (-4%)
Mutual labels:  chart
Timeline Plus
Timeline - chronological visualization of your data
Stars: ✭ 140 (-20%)
Mutual labels:  chart
Picasso.js
A charting library streamlined for building interactive visualizations for the Qlik product suites.
Stars: ✭ 175 (+0%)
Mutual labels:  chart
Rings
A simple chart for Android with three indicators and one more to indicate overall summary. They get highlighted if you click on the ring or text.
Stars: ✭ 160 (-8.57%)
Mutual labels:  chart
Stock Chart
基于 canvas 的沪深两市股票分时 K 线图
Stars: ✭ 170 (-2.86%)
Mutual labels:  chart
Timechart
An chart library specialized for large-scale time-series data, built on WebGL.
Stars: ✭ 149 (-14.86%)
Mutual labels:  chart
Unity Ui Examples
📚 A collection of UI examples for Unity.
Stars: ✭ 152 (-13.14%)
Mutual labels:  chart
Fancygrid
FancyGrid - JavaScript grid library with charts integration and server communication.
Stars: ✭ 169 (-3.43%)
Mutual labels:  chart
Zeu
A JavaScript library for real-time visualization
Stars: ✭ 1,777 (+915.43%)
Mutual labels:  chart
K8s Wait For
A simple script that allows to wait for a k8s service, job or pods to enter a desired state
Stars: ✭ 172 (-1.71%)
Mutual labels:  chart
Sunburst Chart
A sunburst interactive chart web component for visualizing hierarchical data
Stars: ✭ 140 (-20%)
Mutual labels:  chart
Sensor Data Logger
Android Wear sensor data plotter
Stars: ✭ 166 (-5.14%)
Mutual labels:  chart
React Component Echarts
React component echarts. 组件式百度图表。
Stars: ✭ 175 (+0%)
Mutual labels:  chart
Graphic
A Flutter data visualization library based on Grammar of Graphics.
Stars: ✭ 173 (-1.14%)
Mutual labels:  chart
React Native Charts Wrapper
a react native charts wrapper (support android & iOS)
Stars: ✭ 2,111 (+1106.29%)
Mutual labels:  chart

Grafana Candlestick Panel

Install

Official Grafana Plugins install instruction

Usage

Four basic metrics should have aliases: open, close, high, low. The trade volume metric has alias volume. All other metrics are taken by indicators.

Work tested on Influx data source.

Examples of query on InfluxDB data source:

open: SELECT first("open") FROM "ticker" WHERE ("market" =~ /^$market$/ AND "pair" =~ /^$pair$/) AND $timeFilter GROUP BY time($__interval) fill(linear)

close: SELECT last("close") FROM "ticker" WHERE ("market" =~ /^$market$/ AND "pair" =~ /^$pair$/) AND $timeFilter GROUP BY time($__interval) fill(linear)

low: SELECT min("low") FROM "ticker" WHERE ("market" =~ /^$market$/ AND "pair" =~ /^$pair$/) AND $timeFilter GROUP BY time($__interval) fill(linear)

high: SELECT max("high") FROM "ticker" WHERE ("market" =~ /^$market$/ AND "pair" =~ /^$pair$/) AND $timeFilter GROUP BY time($__interval) fill(linear)

volume: SELECT max("volume") FROM "ticker" WHERE ("market" =~ /^$market$/ AND "pair" =~ /^$pair$/) AND $timeFilter GROUP BY time($__interval) fill(linear)

Screenshots

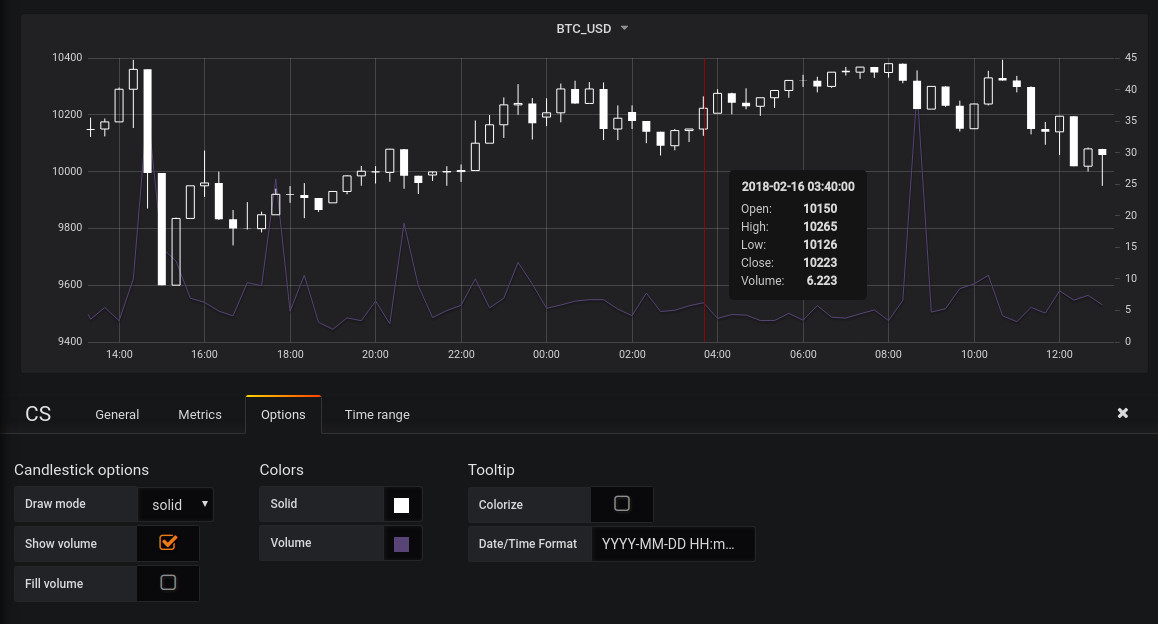
Main view with plugin options: example color chart

Solid view: example solid chart

Bar view: example bar chart

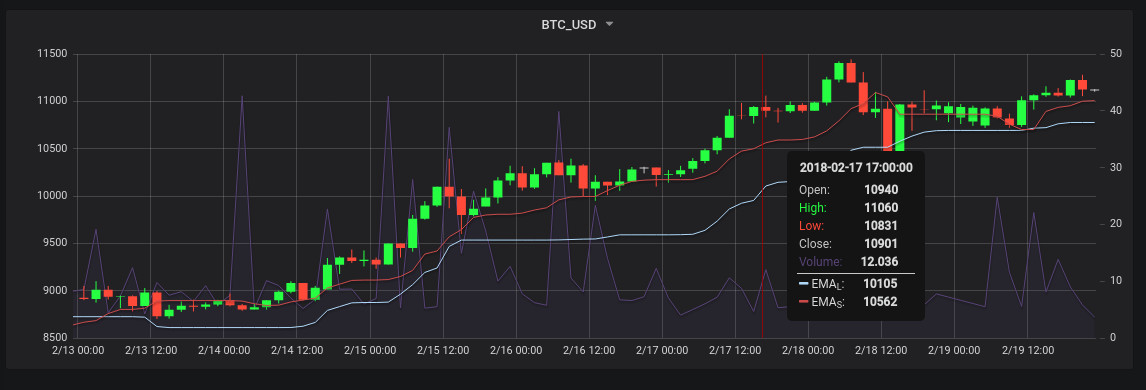
Chart with indicators: example chart with indicators

Changelog

v0.0.1
  • First working version
Note that the project description data, including the texts, logos, images, and/or trademarks, for each open source project belongs to its rightful owner. If you wish to add or remove any projects, please contact us at [email protected].