All Projects → lvwerra → Jupyterplot

lvwerra / Jupyterplot

Licence: apache-2.0
Create real-time plots in Jupyter Notebooks.

Projects that are alternatives of or similar to Jupyterplot

Decision Tree From Scratch
Stars: ✭ 62 (-3.12%)
Mutual labels:  jupyter-notebook
Speedchallenge
Stars: ✭ 62 (-3.12%)
Mutual labels:  jupyter-notebook
Ipython Notebooks
Stars: ✭ 62 (-3.12%)
Mutual labels:  jupyter-notebook
Python Hierarchical Clustering Exercises
Exercises for hierarchical clustering with Python 3 and scipy as Jupyter Notebooks
Stars: ✭ 62 (-3.12%)
Mutual labels:  jupyter-notebook
Ai Notebooks
Stars: ✭ 62 (-3.12%)
Mutual labels:  jupyter-notebook
Lenet In Tensorflow
Implementation of the LeNet-5 deep neural network model in Tensorflow. https://www.youtube.com/watch?v=ixkpBmKRZDw
Stars: ✭ 62 (-3.12%)
Mutual labels:  jupyter-notebook
Aiopen
AIOpen是一个按人工智能三要素(数据、算法、算力)进行AI开源项目分类的汇集项目,项目致力于跟踪目前人工智能(AI)的深度学习(DL)开源项目,并尽可能地罗列目前的开源项目,同时加入了一些曾经研究过的代码。通过这些开源项目,使初次接触AI的人们对人工智能(深度学习)有更清晰和更全面的了解。
Stars: ✭ 62 (-3.12%)
Mutual labels:  jupyter-notebook
Torrent To Google Drive Downloader
Simple notebook to stream torrent files to Google Drive using Google Colab and python3.
Stars: ✭ 63 (-1.56%)
Mutual labels:  jupyter-notebook
Probabilistic Algorithms
Introduction to common Probabilistic Algorithms: Approximate Counting, Flajolet-Martin, LogLog, HyperLogLog, Bloom Filters
Stars: ✭ 62 (-3.12%)
Mutual labels:  jupyter-notebook
Nlp In Python Tutorial
comparing stand up comedians using natural language processing
Stars: ✭ 1,117 (+1645.31%)
Mutual labels:  jupyter-notebook
Candlegp
Gaussian Processes in Pytorch
Stars: ✭ 62 (-3.12%)
Mutual labels:  jupyter-notebook
Stn idsia convnet
An implementation of a convolutional neural network with a spatial transformer
Stars: ✭ 62 (-3.12%)
Mutual labels:  jupyter-notebook
E2e Glstm Sc
Code for paper "Image Caption Generation with Text-Conditional Semantic Attention"
Stars: ✭ 62 (-3.12%)
Mutual labels:  jupyter-notebook
Gdax Orderbook Ml
Application of machine learning to the Coinbase (GDAX) orderbook
Stars: ✭ 60 (-6.25%)
Mutual labels:  jupyter-notebook
Fbdqa 2021s
Financial Big Data and Quantitative Analytics, Spring 2021.
Stars: ✭ 63 (-1.56%)
Mutual labels:  jupyter-notebook
Human Emotion Analysis Using Eeg From Deap Dataset
Processed the DEAP dataset on basis of 1) PSD (power spectral density) and 2)DWT(discrete wavelet transform) features . Classifies the EEG ratings based on Arousl and Valence(high /Low)
Stars: ✭ 61 (-4.69%)
Mutual labels:  jupyter-notebook
Imcap keras
Image captioning with spatial attention using keras with tensorflow backend
Stars: ✭ 62 (-3.12%)
Mutual labels:  jupyter-notebook
Simulator
Code base for the epidemiological model introduced in the context of COVID-19
Stars: ✭ 63 (-1.56%)
Mutual labels:  jupyter-notebook
Singlecellopenproblems
Formalizing and benchmarking open problems in single-cell genomics
Stars: ✭ 60 (-6.25%)
Mutual labels:  jupyter-notebook
Taming Transformers
Stars: ✭ 1,107 (+1629.69%)
Mutual labels:  jupyter-notebook

jupyterplot

Create real-time plots in Jupyter notebooks.

What is it?

It generalises Andreas Madsen's excellent python-lrcurve library for machine learning to produce visualisations for arbitrary functions in real-time.

single-plot

Install

pip install jupyterplot

How to use

Single plot

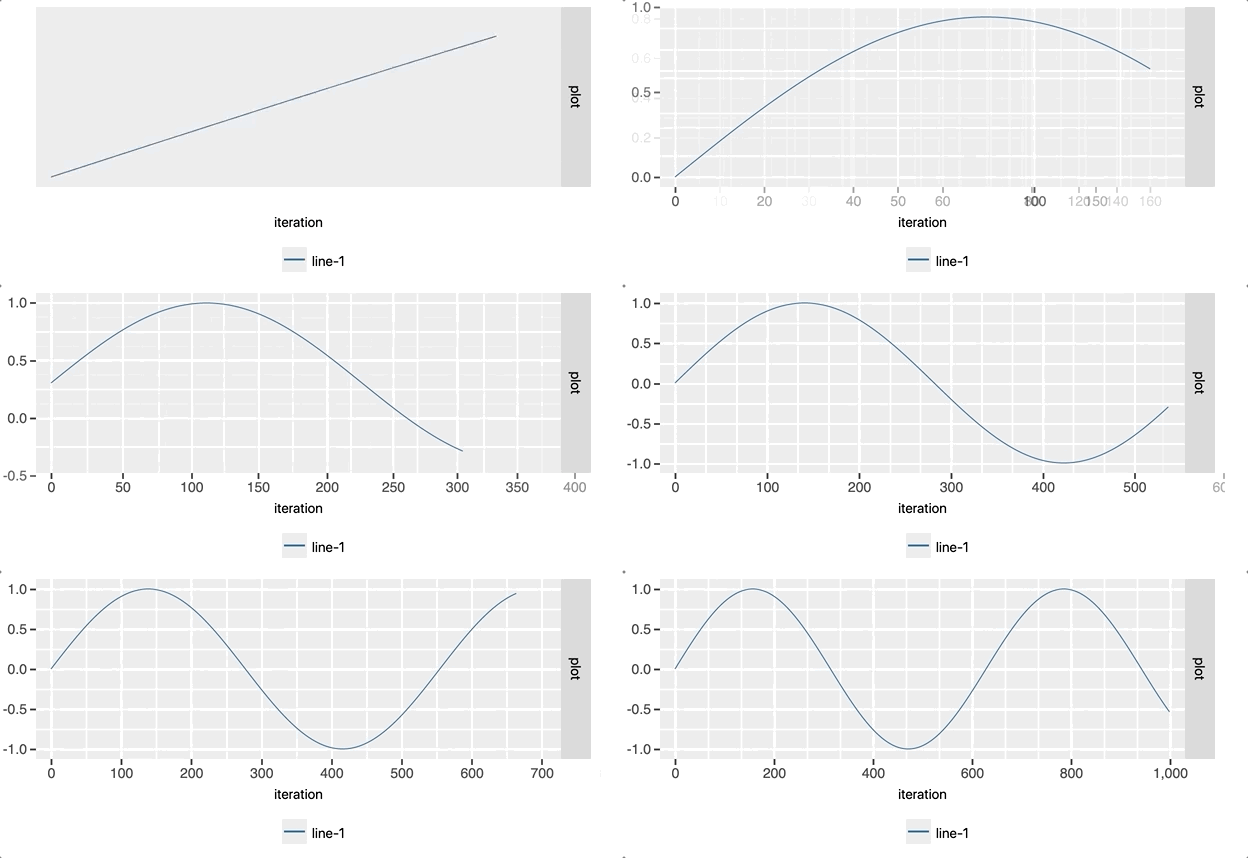
Creating a simple real-time plot in a Jupyter notebook is as easy as easy as the following snippet:

from jupyterplot import ProgressPlot
import numpy as np

pp = ProgressPlot()
for i in range(1000):
    pp.update(np.sin(i / 100))
pp.finalize()

single-plot

Note: The pp.finalize() statement is necessary to make the plots persistent between notebook sessions.

Custom range

By default, the x and y ranges adapt to new data points. If the scale is known beforehand, it can be steadier to set it beforehand:

pp = ProgressPlot(x_lim=[0, 1000], y_lim=[-1.5, 1.5])
for i in range(1000):
    pp.update(np.sin(i / 100))
pp.finalize()

single-plot

Multiple lines

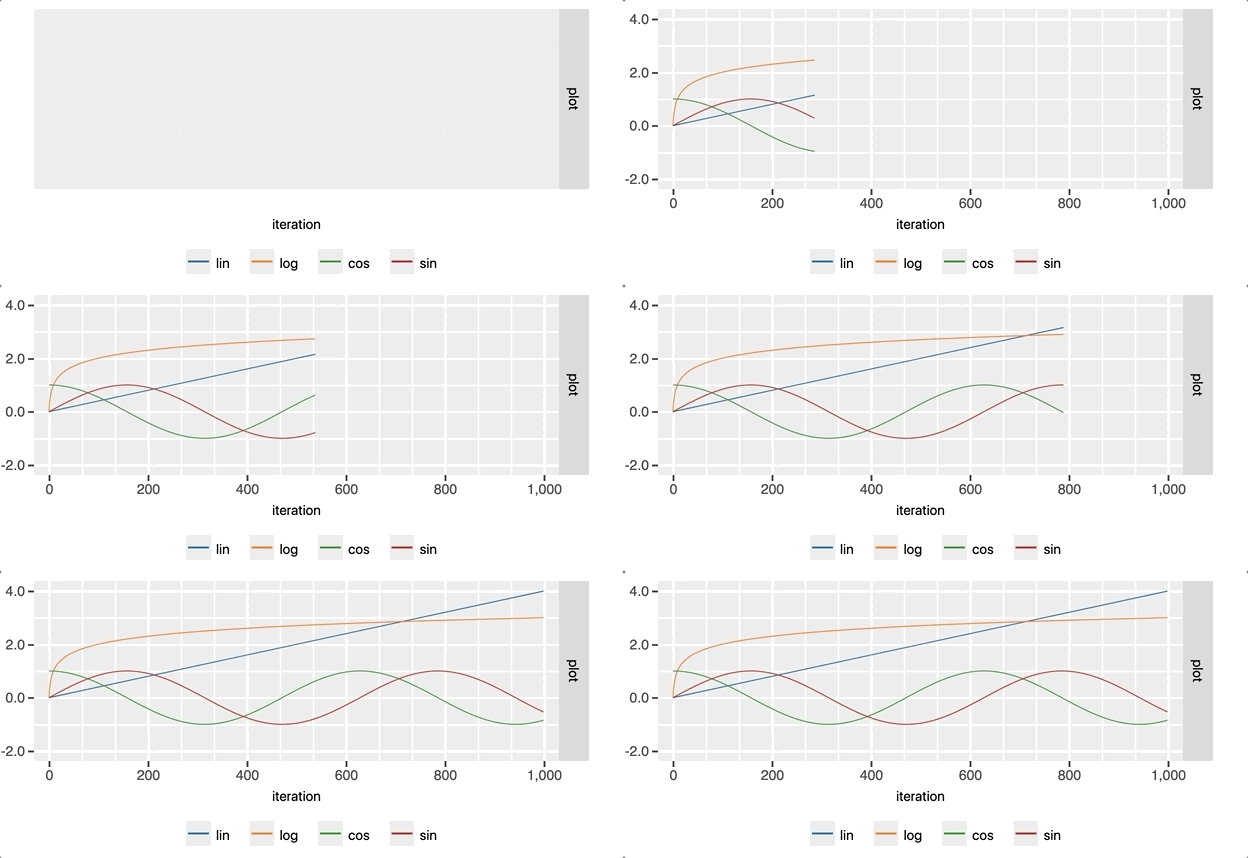
One can also plot several lines in parallel by specifying the line names in the constructor and passing all values in a list.

pp = ProgressPlot(line_names=["lin", "log", "cos", "sin"],
                  x_lim=[0, 1000],
                  y_lim=[-1, 4])

for i in range(1000):
    pp.update([[i / 250, np.log10(i + 1), np.cos(i / 100), np.sin(i / 100)]])
pp.finalize()

single-plot

Note: The data is fed to pp.update() as a list of lists, where each sublist corresponds to the curves that are generated in each subplot.

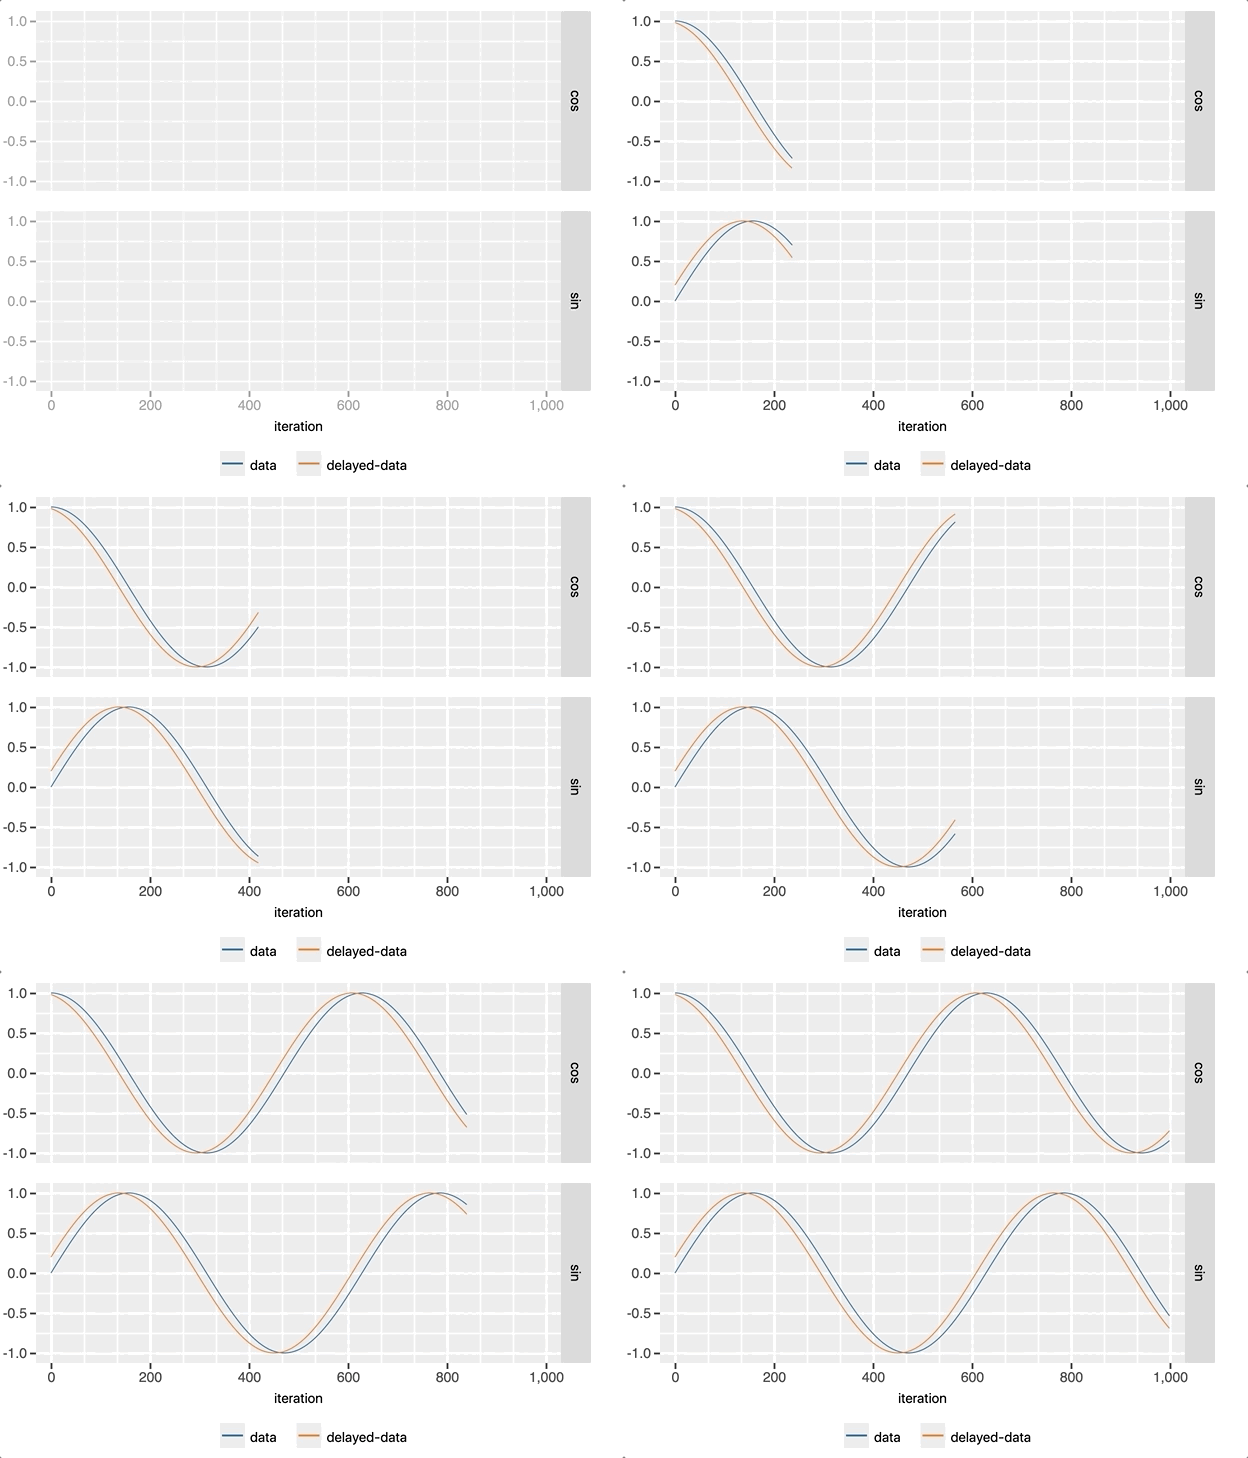
Multiple plots

pp = ProgressPlot(plot_names=["cos", "sin"],
                  line_names=["data", "delayed-data"],
                  x_lim=[0, 1000],
                  y_lim=[-1, 1])

for i in range(1000):
    pp.update([[np.cos(i / 100), np.cos((i + 20) / 100)],
               [np.sin(i / 100), np.sin((i + 20) / 100)]])
pp.finalize()

single-plot

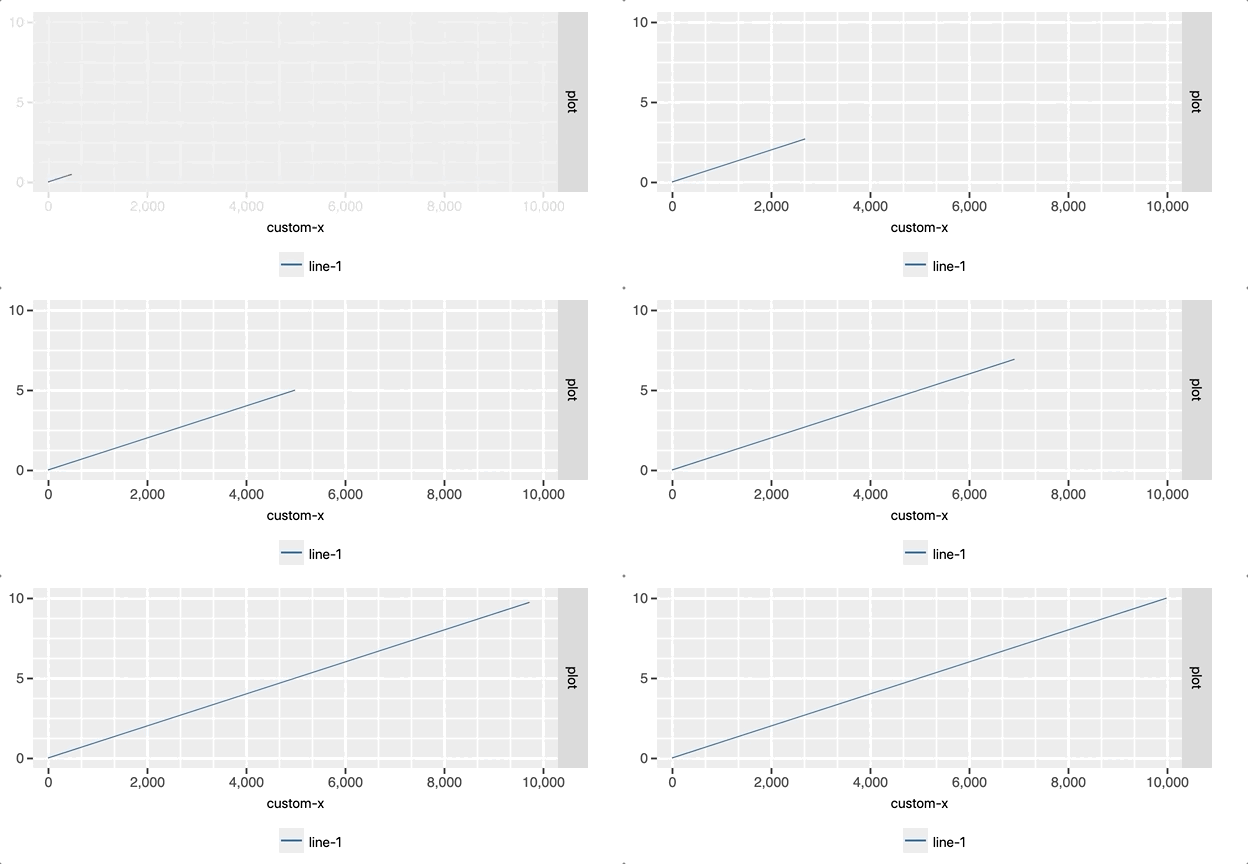
Custom x-values

If the x values should not be incremented by 1 at every update one can set the x_iterator=False. This requires passing two values to the update(x, y), where x is an int or float and y follows the same format as in the previous examples.

pp = ProgressPlot(x_iterator=False, x_label="custom-x", x_lim=[0, 10000], y_lim=[0, 10])
for i in range(1000):
    pp.update(10 * i, i / 100)
pp.finalize()

single-plot

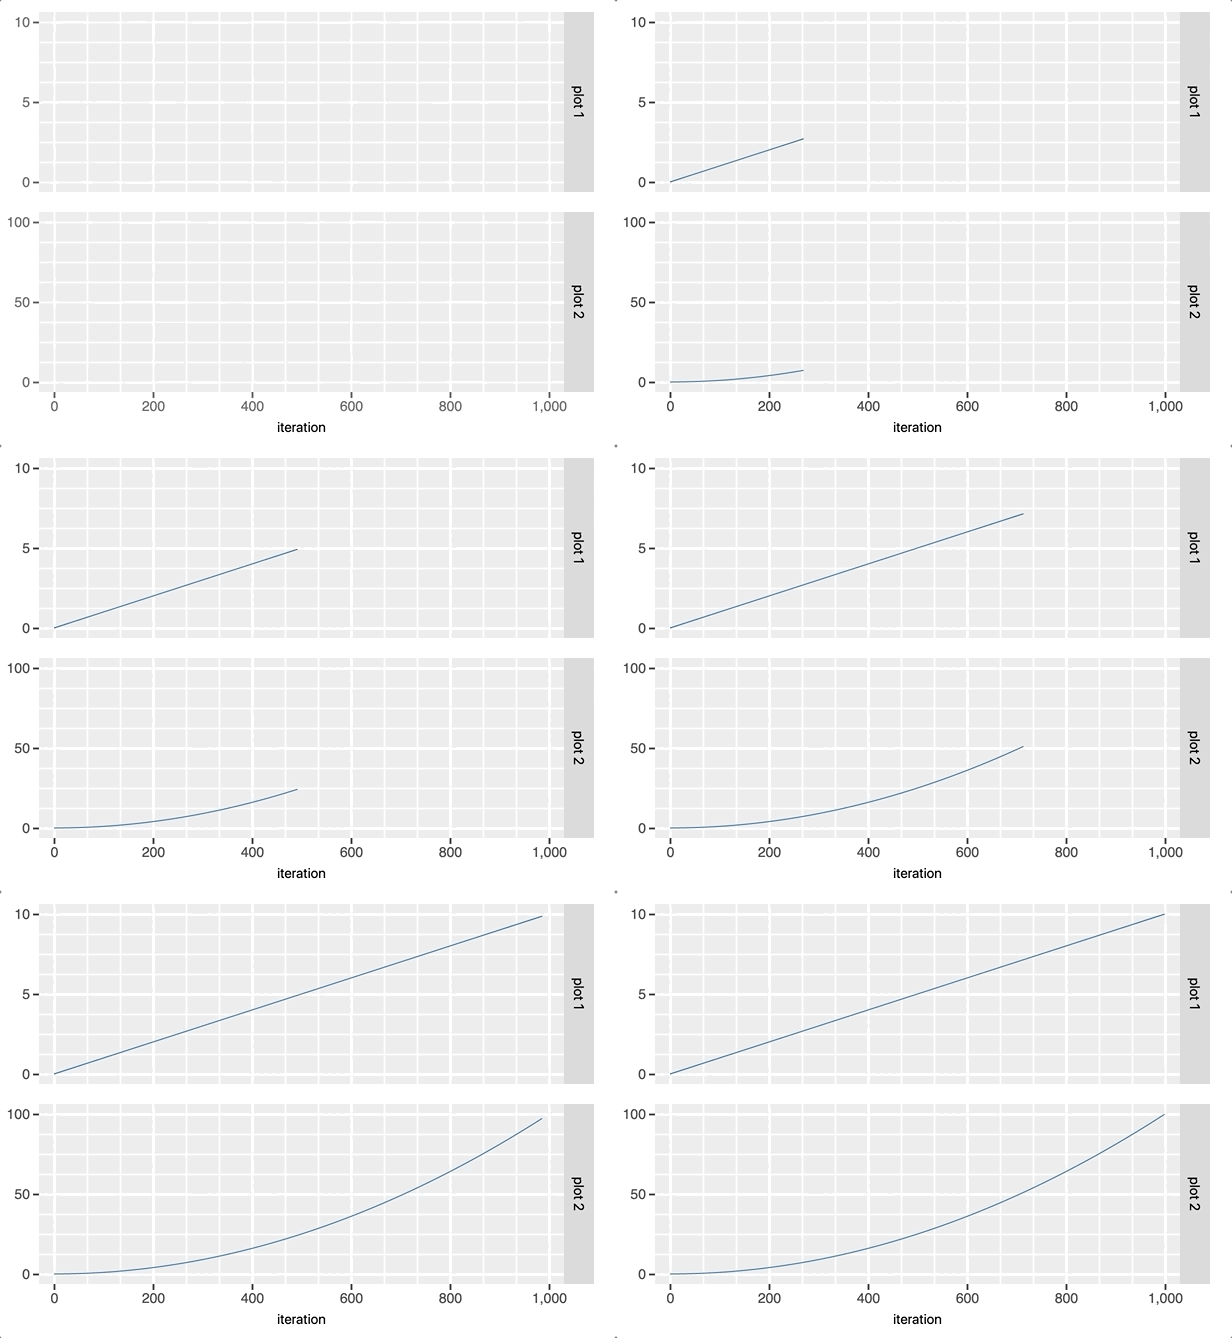
Decoupled y-limits

If each subplot should have different y-limits then the y-limits can be passed as a list containing the the limits for each subplot.

pp = ProgressPlot(plot_names=['plot 1', 'plot 2'], x_lim=[0, 1000], y_lim=[[0, 10],[0, 100]])
for i in range(1000):
    pp.update([[(i/100)], [(i/100)**2]])

single-plot

Input format

Single plot, single line

If the progress plot consists of a single plot with a single line one can pass the y-updates as int or float.

Multiple plots, multiple lines

If multiple plots or lines are used, the y-updates can either be lists or dicts:

y_update_list = [[y_plot_1_line_1, y_plot_1_line_2],
                 [y_plot_2_line_1, y_plot_2_line_2]]

y_update_dict = {'plot_name_1': {'line_name_1': y_plot_1_line_1,
                                 'line_name_2': y_plot_1_line_2},
                 'plot_name_2': {'line_name_1': y_plot_2_line_1,
                                 'line_name_2': y_plot_2_line_2}}

Limitations

  • Only one ProgressPlot() object can be used at a time.
  • Each subplot must have the same number of lines.
  • The same color cycle for each subplot is used.
Note that the project description data, including the texts, logos, images, and/or trademarks, for each open source project belongs to its rightful owner. If you wish to add or remove any projects, please contact us at [email protected].