lightbend / Kafka Lag Exporter
Programming Languages


![]()
Kafka Lag Exporter
Monitor Kafka Consumer Group Latency with Kafka Lag Exporter
- Introduction
- Metrics
- Run on Kubernetes
- Run Standalone
- Troubleshooting
- Required Permissions for Kafka ACL
- Estimate Consumer Group Time Lag
- Strimzi Kafka Cluster Watcher
- Monitoring with Grafana
- Filtering Metrics without Prometheus Server
- Health Check
- Development
- Release
- Change log
Introduction
Kafka Lag Exporter makes it easy to view the latency (residence time) of your Apache Kafka consumer groups. It can run anywhere, but it provides features to run easily on Kubernetes clusters against Strimzi Kafka clusters using the Prometheus and Grafana monitoring stack. Kafka Lag Exporter is an Akka Typed application written in Scala.
For more information about Kafka Lag Exporter's features see Lightbend's blog post: Monitor Kafka Consumer Group Latency with Kafka Lag Exporter.
Kafka Lag Exporter is maintained by @seglo and a community of contributors. It is not covered by support under the Lightbend subscription.
Metrics
Prometheus is a standard way to represent metrics in a modern cross-platform manner. Kafka Lag Exporter exposes several metrics as an HTTP endpoint that can be readily scraped by Prometheus. When installed using Helm and when enabling the Kubernetes pod self-discovery features within Prometheus server, Prometheus server will automatically detect the HTTP endpoint and scrape its data.
kafka_consumergroup_group_offset
Labels: cluster_name, group, topic, partition, member_host, consumer_id, client_id
The offset of the last consumed offset for this partition in this topic partition for this group.
kafka_consumergroup_group_lag
Labels: cluster_name, group, topic, partition, member_host, consumer_id, client_id
The difference between the last produced offset and the last consumed offset for this partition in this topic partition for this group.
kafka_consumergroup_group_lag_seconds
Labels: cluster_name, group, topic, partition, member_host, consumer_id, client_id
The estimated lag in seconds. This metric correlates with lag in offsets. For more information on how this is calculated read the Estimate consumer group lag in time section below.
kafka_consumergroup_group_max_lag
Labels: cluster_name, group, is_simple_consumer
The highest (maximum) lag in offsets for a given consumer group.
kafka_consumergroup_group_max_lag_seconds
Labels: cluster_name, group, is_simple_consumer
The highest (maximum) lag in time for a given consumer group.
kafka_consumergroup_group_sum_lag
Labels: cluster_name, group
The sum of the difference between the last produced offset and the last consumed offset of all partitions for this group.
kafka_consumergroup_group_topic_sum_lag
Labels: cluster_name, group, topic
The sum of the difference between the last produced offset and the last consumed offset of all partitions in this topic for this group.
kafka_partition_latest_offset
Labels: cluster_name, topic, partition
The latest offset available for topic partition. Kafka Lag Exporter will calculate a set of partitions for all consumer groups available and then poll for the last produced offset. The last produced offset is used in the calculation of other metrics provided, so it is exported for informational purposes. For example, the accompanying Grafana dashboard makes use of it to visualize the last produced offset and the last consumed offset in certain panels.
kafka_partition_earliest_offset
Labels: cluster_name, topic, partition
The earliest offset available for topic partition. Kafka Lag Exporter will calculate a set of partitions for all consumer groups available and then poll for the earliest available offset. The earliest available offset is used in the calculation of other metrics provided, so it is exported for informational purposes. For example, the accompanying Grafana dashboard makes use of it to visualize the offset-based volume of a partition in certain panels.
kafka_consumergroup_poll_time_ms
Labels: cluster_name
The time taken to poll (milli seconds) all the information from all consumer groups for every cluster.
Labels
Each metric may include the following labels when reported. If you define the labels property for configuration of a cluster then those labels will also be included.
The superset of all labels defined for all cluster configurations are used for each metric. This is due to a restriction in the Java Prometheus client library that only allows us to define one set of labels per metric. Therefore, if the label names across cluster configurations are not consistent then the missing labels for each cluster will appear as blank values ("") in the reported metric. An alternative to defining labels in Kafka Lag Exporter is to define relabeling rules in your Prometheus server configuration.
-
cluster_name- Either the statically defined Kafka cluster name, or the metadata.name of the Strimzi Kafka cluster that was discovered with the Strimzi auto discovery feature. -
topic- The Kafka topic. -
partition- The Kafka partition. -
group- The Kafka consumer group.id.
The rest of the labels are passed along from the consumer group metadata requests.
-
member_host- The hostname or IP of the machine or container running the consumer group member that is assigned this partition. -
client_id- The id of the consumer group member. This is usually generated automatically by the group coordinator. -
consumer_id- The globally unique id of the consumer group member. This is usually a combination of the client_id and a GUID generated by the group coordinator.
Prometheus server may add additional labels based on your configuration. For example, Kubernetes pod information about the Kafka Lag Exporter pod where the metrics were scraped from.
Run on Kubernetes
Configuration
Details for configuration for the Helm Chart can be found in the values.yaml
file of the accompanying Helm Chart.
Install with Helm
You can install the chart from the chart repository ( index file location: https://lightbend.github.io/kafka-lag-exporter/repo/index.yaml ).
helm repo add kafka-lag-exporter https://lightbend.github.io/kafka-lag-exporter/repo/
helm repo update

helm install kafka-lag-exporter/kafka-lag-exporter
Examples
Install with the Strimzi Kafka discovery feature. See Strimzi Kafka Cluster Watcher for more details.
helm install kafka-lag-exporter/kafka-lag-exporter \
  --name kafka-lag-exporter \
  --namespace kafka-lag-exporter \
  --set watchers.strimzi=true
Install with statically defined cluster at the CLI.
helm install kafka-lag-exporter/kafka-lag-exporter \
  --name kafka-lag-exporter \
  --namespace myproject \
  --set clusters\[0\].name=my-cluster \
  --set clusters\[0\].bootstrapBrokers=my-cluster-kafka-bootstrap:9092
Install with statically defined cluster at the CLI, but with a non-default service account assigned to the deployment.
helm install kafka-lag-exporter/kafka-lag-exporter \
  --name kafka-lag-exporter \
  --namespace myproject \
  --set clusters\[0\].name=my-cluster \
  --set clusters\[0\].bootstrapBrokers=my-cluster-kafka-bootstrap:9092 \
  --set serviceAccount.create=true
Run a debug install (DEBUG logging, debug helm chart install, force docker pull policy to Always).
helm repo update  # force refresh chart version
helm install kafka-lag-exporter/kafka-lag-exporter \
  --name kafka-lag-exporter \
  --namespace myproject \
  --set image.pullPolicy=Always \
  --set logLevel=DEBUG \
  --set clusters\[0\].name=my-cluster \
  --set clusters\[0\].bootstrapBrokers=my-cluster-kafka-bootstrap.myproject:9092 \
  --debug
View the health endpoint
To view the Prometheus health endpoint from outside your Kubernetes cluster, use kubectl port-forward.
Ex)
kubectl port-forward service/kafka-lag-exporter-service 8080:8000 --namespace myproject
View exporter logs
To view the logs of the exporter, identify the pod name of the exporter and use the kubectl logs command.
Ex)
kubectl logs {POD_ID} --namespace myproject -f
Run Standalone
To run the project in standalone mode you must first define a configuration application.conf. This configuration must
contain at least connection info to your Kafka cluster (kafka-lag-exporter.clusters). All other configuration has
defaults defined in the project itself. See reference.conf for defaults.
Reporters
It is possible to report (either one, multiple or all):
- to influxdb via the config
kafka-lag-exporter.reporters.influxdb - to graphite via the config
kafka-lag-exporter.reporters.graphite - as prometheus via the config
kafka-lag-exporter.reporters.prometheus
See section below for more information.
Configuration
General Configuration (kafka-lag-exporter{})
| Key | Default | Description |
|---|---|---|
reporters.prometheus.port |
8000 |
The port to run the Prometheus endpoint on |
reporters.graphite.host |
None | The graphite host to send metrics to (if not set, will not output to graphite) |
reporters.graphite.port |
None | The graphite port to send metrics to (if not set, will not output to graphite) |
reporters.graphite.prefix |
None | The graphite metric prefix (if not set, prefix will be empty) |
reporters.influxdb.endpoint |
None | The influxdb host to send metrics to (if not set, will not output to influxdb) |
reporters.influxdb.port |
None | The influxdb port to send metrics to (if not set, will not output to influxdb) |
reporters.influxdb.database |
kafka_lag_exporter |
The influxdb database to send metrics to |
reporters.influxdb.username |
None | The influxdb username to connect (if not set, username will be empty) |
reporters.influxdb.password |
None | The influxdb password to connect (if not set, password will be empty) |
reporters.influxdb.async |
true |
Flag to enable influxdb async non-blocking write mode to send metrics |
poll-interval |
30 seconds |
How often to poll Kafka for latest and group offsets |
lookup-table-size |
60 |
The maximum window size of the look up table per partition |
client-group-id |
kafkalagexporter |
Consumer group id of kafka-lag-exporter's client connections |
kafka-client-timeout |
10 seconds |
Connection timeout when making API calls to Kafka |
clusters |
[] |
A statically defined list of Kafka connection details. This list is optional if you choose to use the Strimzi auto-discovery feature |
watchers |
{} |
Settings for Kafka cluster "watchers" used for auto-discovery. |
metric-whitelist |
[".*"] |
Regex of metrics to be exposed via Prometheus endpoint. Eg. [".*_max_lag.*", "kafka_partition_latest_offset"]
|
Kafka Cluster Connection Details (kafka-lag-exporter.clusters[])
| Key | Default | Required | Description |
|---|---|---|---|
name |
"" |
Yes | A unique cluster name to for this Kafka connection detail object |
bootstrap-brokers |
"" |
Yes | Kafka bootstrap brokers. Comma delimited list of broker hostnames |
group-whitelist |
[".*"] |
No | A list of Regex of consumer groups monitored. For example, if you only wish to expose certain groups with input and output prefixes, use ["^input-.+", "^output-.+"]. |
group-blacklist |
[] |
No | A list of Regex of consumer groups not monitored. For example, if you wish to not expose certain groups, use either ["^unmonitored-group.+"] or ["unmonitored-group1", "unmonitored-group2"]. |
topic-whitelist |
[".*"] |
No | A list of Regex of topics monitored. For example, if you only wish to expose certain topics, use either ["^topic.+"] or ["topic1", "topic2"]. |
topic-blacklist |
[] |
No | A list of Regex of topics not monitored. For example, if you wish to not expose certain topics, use either ["^unmonitored-topic.+"] or ["unmonitored-topic1", "unmonitored-topic2"]. |
consumer-properties |
{} |
No | A map of key value pairs used to configure the KafkaConsumer. See the Consumer Config section of the Kafka documentation for options. |
admin-client-properties |
{} |
No | A map of key value pairs used to configure the AdminClient. See the Admin Config section of the Kafka documentation for options. |
labels |
{} |
No | A map of key value pairs will be set as additional custom labels per cluster for all the metrics in prometheus. |
Watchers (kafka-lag-exporters.watchers{})
| Key | Default | Description |
|---|---|---|
strimzi |
false |
Toggle for using Strimzi auto-discovery. |
Ex) Expose metrics on port 9999, double the default lookup table size, and define client.id's for the KafkaConsumer
and AdminClient used by the project.
kafka-lag-exporter {
  reporters {
    prometheus {
      port = 9999
    }
  }
  lookup-table-size = 120
  clusters = [
    {
      name = "a-cluster"
      bootstrap-brokers = "a-1.cluster-a.xyzcorp.com:9092,a-2.cluster-a.xyzcorp.com:9092,a-3.cluster-a.xyzcorp.com:9092"
      topic-whitelist = [
        "widgets-.+"
      ]
      consumer-properties = {
        client.id = "consumer-client-id"
      }
      admin-client-properties = {
        client.id = "admin-client-id"
      }
      labels = {
        location = "ny"
        zone = "us-east"
      }
    }
  ]
}
Run as Java App
Download the release zip file (kafka-lag-exporter-{VERSION}.zip) from the GitHub release page.
Extract its contents and run the ./bin/kafka-lag-exporter shell script.
Ex)
./bin/kafka-lag-exporter \
    -Dconfig.file=/opt/docker/conf/application.conf \
    -Dlogback.configurationFile=/opt/docker/conf/logback.xml
Run as Docker Image
Define an application.conf and optionally a logback.xml with your configuration.
Run the Docker image.
Expose metrics endpoint on the host port 8000. Mount a config dir with your application.conf and logback.xml into the container.
Ex)
docker run -p 8000:8000 \
    -v $(pwd):/opt/docker/conf/ \
    lightbend/kafka-lag-exporter:0.6.6 \
    /opt/docker/bin/kafka-lag-exporter \
    -Dconfig.file=/opt/docker/conf/application.conf \
    -Dlogback.configurationFile=/opt/docker/conf/logback.xml
See full example in ./examples/standalone.
Troubleshooting
If you observe Kafka Lag Exporter reporting odd or inconsistent metric data then before creating an issue please enable DEBUG logging to get raw data consumed from Kafka used to calculate metrics that are exported.
If this logging does not help you resolve the problem then include logs, and your application configuration in a new GitHub issue.
Ex)
2020-08-31 16:14:06,478 DEBUG [default-dispatcher-3] [c.l.k.ConsumerGroupCollector$       ]  Received Offsets Snapshot:

Timestamp: 1598904846431
Groups: group-1-1
Earliest Offsets:
  Topic                                                           Partition  Earliest
  topic-1-2                                                       0          0
Latest Offsets:
  Topic                                                           Partition  Offset
  topic-1-2                                                       0          11
Last Group Offsets:
  Group                                                           Topic                                                           Partition  Offset
  group-1-1                                                       topic-1-2                                                       0          5
If installing with Helm then you can enable DEBUG logging with the kafkaLogLevel configuration in the chart's [values.yaml](https://github.com/lightbend/kafka-lag-exporter/blob/master/charts/kafka-lag-exporter/values.yaml).
When running in standalone mode you can either define assign the KAFKA_LAG_EXPORTER_KAFKA_LOG_LEVEL environment variable to DEBUG, or override the log level of com.lightbend.kafkalagexporter directly in the logback.xml.
Required Permissions for Kafka ACL
Kafka Lag Exporter (kafka-lag-exporter) requires the DESCRIBE operation permission for consumer groups and topics at the cluster level.
ACLs for principal `User:kafka-lag-exporter`
Current ACLs for resource `Cluster:LITERAL:kafka-cluster`:
 	User:kafka-lag-exporter has Allow permission for operations: Describe from hosts: *

Current ACLs for resource `Group:LITERAL:*`:
 	User:kafka-lag-exporter has Allow permission for operations: Describe from hosts: *

Current ACLs for resource `Topic:LITERAL:*`:
 	User:kafka-lag-exporter has Allow permission for operations: Describe from hosts: *
This can be added using the following command:
kafka-acls --add --allow-principal "User:kafka-lag-exporter" --operation DESCRIBE --group '*' --topic '*' --cluster
Estimate Consumer Group Time Lag
One of Kafka Lag Exporter’s more unique features is its ability to estimate the length of time that a consumer group is behind the last produced value for a particular partition, time lag (wait time). Offset lag is useful to indicate that the consumer group is lagging, but it doesn’t provide a sense of the actual latency of the consuming application.
For example, a topic with two consumer groups may have different lag characteristics. Application A is a consumer which performs CPU intensive (and slow) business logic on each message it receives. It’s distributed across many consumer group members to handle the high load, but since its processing throughput is slower it takes longer to process each message per partition. Meanwhile Application B is a consumer which performs a simple ETL operation to land streaming data in another system, such as an HDFS data lake. It may have similar offset lag to Application A, but because it has a higher processing throughput its lag in time may be significantly less.
It’s easier to build monitoring alerts using a time lag measurement than an offset lag measurement, because latency is best described in requirements as a unit of time.
There are several ways to calculate time lag. The easiest way would be to parse the message timestamp and subtract it from the current time. However, this requires us to actually poll for messages in each partition that we wish to calculate time lag for. We must download the message payload and parse this information out of a ConsumerRecord. This is an expensive operation to perform and will likely not scale well in the general use case where messages can be of any size (though less than 1MB, unless default broker config is changed) and the number of partitions for any given topic could range into to thousands. However, it would be an interesting feature to explore in the future. It would also be possible to instrument the Kafka consuming application itself to report this metric since it can readily sample messages it's already consuming for their timestamp property and perform the calculation, but this requires each Kafka consuming application to opt into this implementation in order for it to be monitored. Another way to determine time lag is to estimate it based on consumer group lag information we already have available.
Kafka Lag Exporter estimates time lag by either interpolation or extrapolation of the timestamp of when the last consumed offset was first produced. We begin by retrieving the source data from Kafka. We poll the last produced offset for all partitions in all consumer groups and store the offset (x) and current time (y) as a coordinate in a table (the interpolation table) for each partition. This information is retrieved as a metadata call using the KafkaConsumer endOffsets call and does not require us to actually poll for messages. The Kafka Consumer Group coordinator will return the last produced offsets for all the partitions we are subscribed to (the set of all partitions of all consumer groups). Similarly, we use the Kafka AdminClient’s listConsumerGroupOffsets API to poll for consumer group metadata from all consumer groups to get the last consumed offset for each partition in a consumer group.
Once we’ve built up an interpolation table of at least two values we can begin estimating time lag by performing the following operations (some edge cases are omitted for clarity) for each last consumed offset of each partition.
- Lookup interpolation table for a consumer group partition
- Find two points within the table that contain the last consumed offset
- If there are no two points that contain the last consumed offset then use the first and last points as input to the interpolation formula. This is the extrapolation use case.
- Interpolate inside (or extrapolate outside) the two points from the table we picked to predict a timestamp for when the last consumed message was first produced.
- Take the difference of the time of the last consumed offset (~ the current time) and the predicted timestamp to find the time lag.
Below you will find a diagram that demonstrates the interpolation use case.

The extrapolation use case uses different points in the interpolation table (the first and last points), but the calculation is the same.

Interpolation is always desirable because we can be more assured that the prediction will be more accurate because we’re plotting a point within two points of our existing dataset. Extrapolation will always be less accurate because we’re predicting points that may be a fair distance away from our dataset.
Strimzi Kafka Cluster Watcher
When you install the chart with --set watchers.strimzi=true then the exporter will create a new ClusterRole and
ClusterRoleBinding to allow for the automatic discovery of Strimzi Kafka clusters. The exporter will watch for
Kafka resources to be created or destroyed. If the cluster already exists, or was created while the exporter was
online then it will automatically begin to collect consumer group metadata and export it. If a Kafka resource is
destroyed then it will stop collecting consumer group metadata for that cluster.
The exporter will name the cluster the same as Kafka resources metadata.name field.
Monitoring with Grafana
A sample Grafana dashboard is provided in ./grafana/. It can be imported into a Grafana server that is configured
with a Prometheus datasource that is reading the Kafka Lag Exporter's Prometheus health endpoint.
The dashboard contains several high level user-configurable variables.
- Namespace - The namespace of the Kafka Lag Exporter. Only 1 namespace can be selected at a time.
- Cluster Name - The name of the Kafka cluster. Only 1 cluster name can be selected at a time.
- Consumer Group - The name of the Consumer Group. This is a multi-select list which allows you to view the dashboard for 1 to All consumer groups.
This dashboard has 4 rows that are described below.
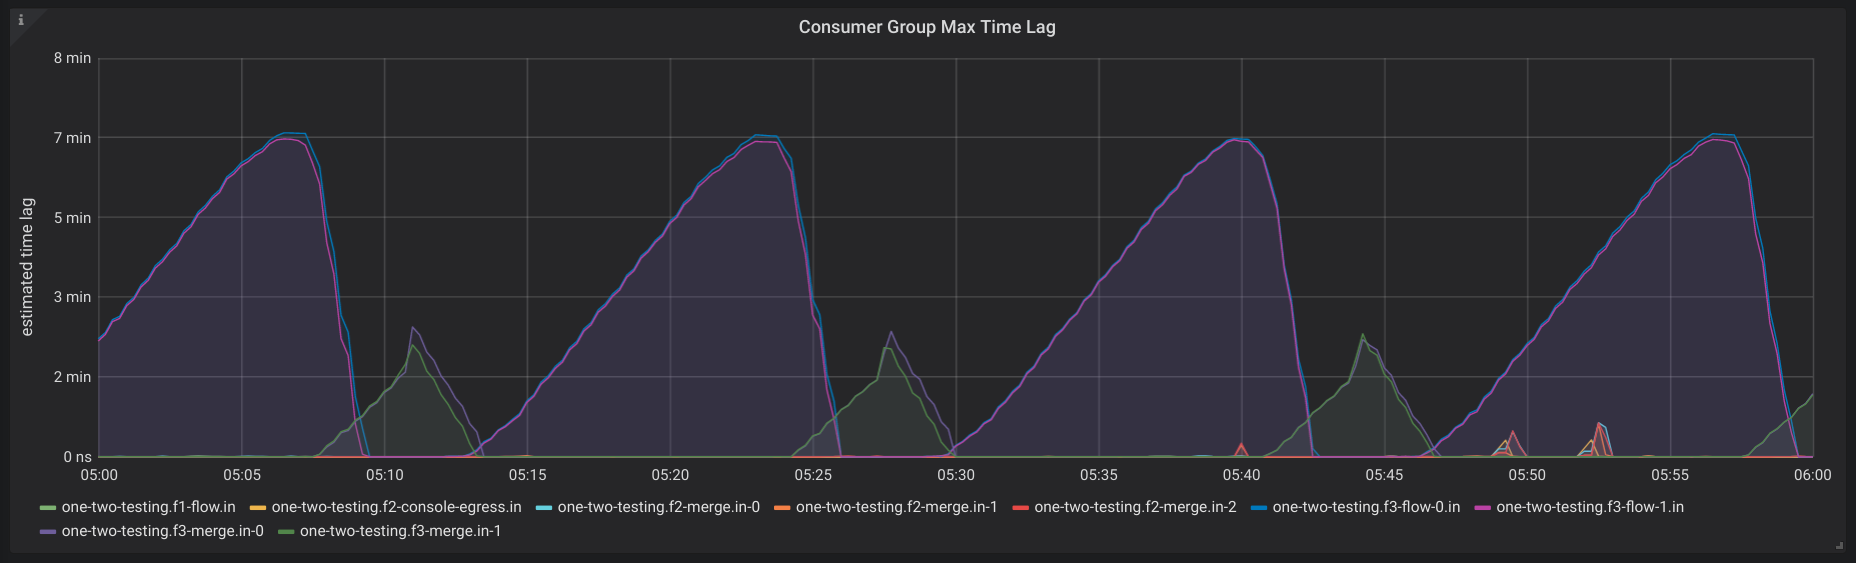
- All Consumer Group Lag - A high level set of 4 panels.
- Consumer Group Max Time Lag
- Consumer Group Time Lag Top Partitions
- Consumer Group Max Offset Lag
- Consumer Group Offset Lag Top Partitions

-
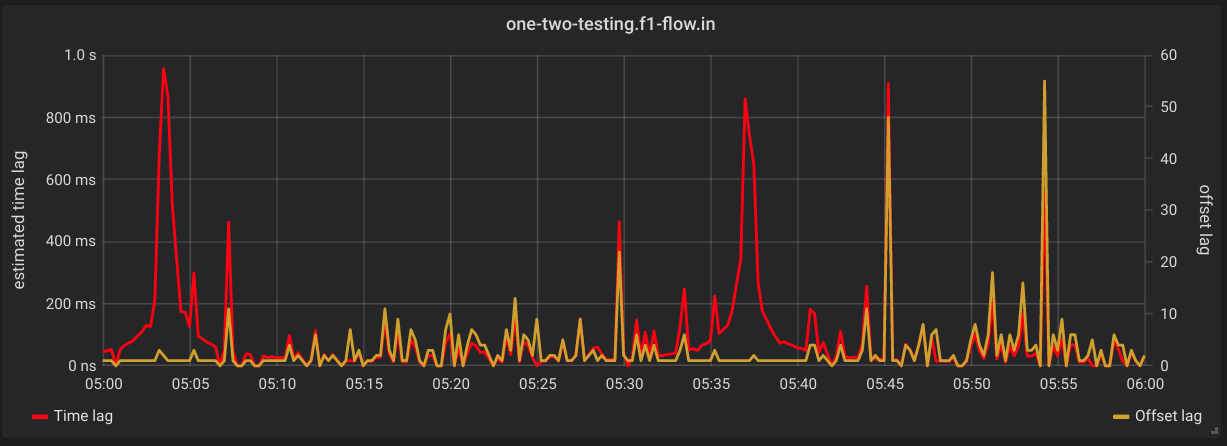
Max Consumer Group Time Lag Over Offset Lag - One panel for each consumer group that shows the max lag
in time on the left Y axis and max lag in offsets on the right Y axis. Ex)
-
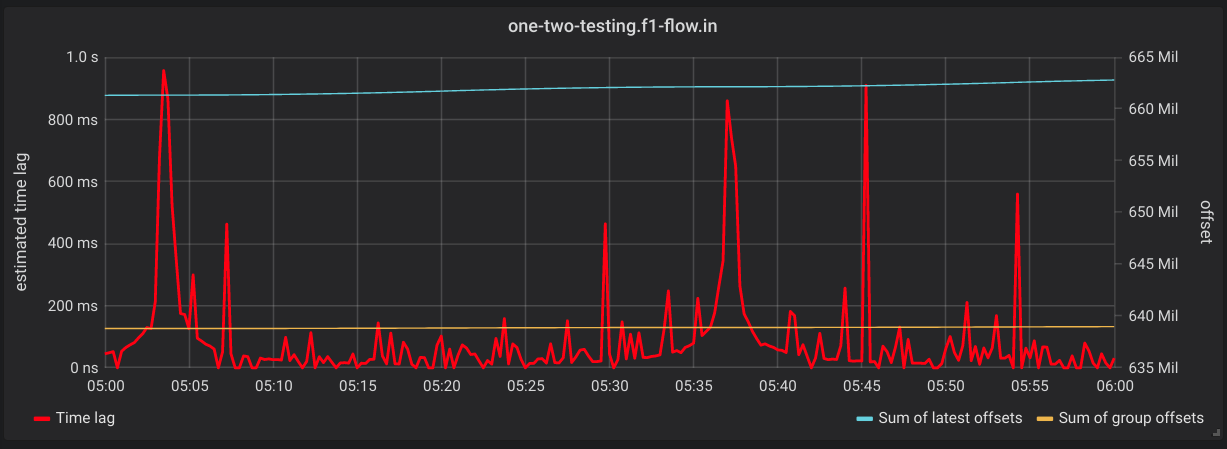
Max Consumer Group Time Lag Over Summed Offsets - One panel for each consumer group that shows the max lag in time on the left Y
axis. The right Y axis has the sum of latest and last consumed offsets for all group partitions. Ex)
- Kafka Lag Exporter JVM Metrics - JVM metrics for the Kafka Lag Exporter itself.


Filtering Metrics without Prometheus Server
It's possible to filter specific metric names using HTTP query parameters to the metrics health endpoint.
To filter 1 or more metrics use the query parameter pattern of name[]=prometheus_metric_name.
Ex)
$ curl -X GET -g http://localhost:8080?name[]=kafka_consumergroup_group_max_lag
# HELP kafka_consumergroup_group_max_lag Max group offset lag
# TYPE kafka_consumergroup_group_max_lag gauge
kafka_consumergroup_group_max_lag{cluster_name="pipelines-strimzi",group="variable-throughput-runtime.f3-merge.in01",} 52.0
...
This is an undocumented feature of the Prometheus HTTP server. For reference consult the parseQuery method for the
HTTP server in the prometheus/client_java GitHub repository.
Health Check
kafka_consumergroup_poll_time_ms metric exposes the time taken the poll all the consumer group information for every cluster. This can be used as health check endpoint and optionally fail the health check if it's greater than some value (longer than the poll interval)
Ex:
$ curl -X GET -g http://localhost:8000/metrics?name[]=kafka_consumergroup_poll_time_ms
Development
Tests
Kafka Lag Exporter has unit and integration tests. The integration tests use Alpakka Kafka Testkit to provide an embedded Kafka instance and simulate consumer group lag.
Run all tests with SBT.
sbt test
Testing with local docker-compose.yaml
A Docker Compose cluster with producers and multiple consumer groups is defined in ./docker/docker-compose.yaml. This
is useful to manually test the project locally, without K8s infrastructure. These images are based on the popular
wurstmeister Apache Kafka Docker images. Confirm you match up the
version of these images with the correct version of Kafka you wish to test.
To configure cluster connection info either create an application.conf or pass environment variables.
KAFKA_LAG_EXPORTER_CLUSTERS.0.name=default
KAFKA_LAG_EXPORTER_CLUSTERS.0.bootstrap-brokers=localhost:9094
Remove any previous volume state.
docker-compose rm -f
Start up the cluster in the foreground.
docker-compose up
Building your own Helm Chart
If you want to build your own Helm Chart and accompanying docker images you can override the Docker repository and username with environment variables.
DOCKER_REPOSITORY - A custom Docker repository, such as a private company's docker repository (defaults to DockerHub)
DOCKER_USERNAME - A custom Docker username (defaults to lightbend)
Run the updateHelmChart sbt task to update the Helm Chart with the appropriate Docker repository and username.
Run the docker:publishLocal sbt task to publish a local Docker image.
Run the docker:publish sbt task to publish the Docker image to the specified Docker repository.
For example, to update the Helm Chart to use a custom docker registry and username and to publish the chart locally.
$ export DOCKER_REPOSITORY="docker.xyzcorp.com"
$ export DOCKER_USERNAME="foobar"
$ sbt updateHelmChart docker:publishLocal
[info] Loading settings for project global-plugins from idea.sbt ...
[info] Loading global plugins from /home/seglo/.sbt/1.0/plugins
[info] Loading settings for project kafka-lag-exporter-build from plugins.sbt ...
[info] Loading project definition from /home/seglo/source/kafka-lag-exporter/project
[info] Loading settings for project kafka-lag-exporter from version.sbt,build.sbt ...
[info] Set current project to kafka-lag-exporter (in build file:/home/seglo/source/kafka-lag-exporter/)
Update Chart.yaml appVersion to 0.4.0-SNAPSHOT and version to 0.4.0
Update values.yaml docker image tag to 0.4.0-SNAPSHOT
Update values.yaml docker repository to docker.xyzcorp.com/foobar/kafka-lag-exporter
...
[info] Successfully built f392402958b7
[info] Successfully tagged docker.xyzcorp.com/foobar/kafka-lag-exporter:0.4.0-SNAPSHOT
[info] Built image docker.xyzcorp.com/foobar/kafka-lag-exporter with tags [0.4.0-SNAPSHOT]
[success] Total time: 17 s, completed 1-May-2019 2:37:28 PM
Deploy the local chart to K8s:
helm install ./charts/kafka-lag-exporter \
  --name kafka-lag-exporter \
  --namespace kafka-lag-exporter \
  --set watchers.strimzi=true \
  --set kafkaLagExporterLogLevel=DEBUG \
  --set image.pullPolicy=Always
Release
Pre-requisites
The release process is orchestrated by the sbt-release. Privileged access is
required. Before running a release make sure the following pre-req's are met.
- Authenticated with Docker Hub with the
dockercommand. - Authenticated with GitHub
-
~/.netrcfile setup with GitHub credentials/token
Release steps
- Update the Change log
- Run
doctoc README.md - Run
sbt release. To see what steps are performed during release consult thebuild.sbt. - Review the GitHub release draft and submit it.
Change log
0.6.6
- Add support for Consumer Group blacklisting #184 (@Manicben)
- Add release steps to serve Helm Charts Repository on Github Pages #183 (@akozich)
- Upgrade sbt from 1.2.6 to 1.4.3 to improve the metals support #178 (@robsonpeixoto)
- Automatically roll Deployment when ConfigMap change #176 (@robsonpeixoto)
- Support multiple instances and extra labels for service monitor #171 (@ryan-dyer-sp)
- Ability to extend and configure desired sink to report lag metrics, adding support to push lag metrics into InfluxDB as well #157 (@hariprasad-k)
0.6.5
- Use
centos:8docker base layer #168 (@killuazhu)
0.6.4
- Bugfix: Filter Out NaN Values from Aggregate Metrics #158 (@simoncaron)
0.6.3
- Configurable readiness and liveness probes in helm chart #145 (@chelomontilla)
- Swap embedded-kafka for testcontainers #147
- Bugfix: Handle null offset in consumer group offset result #149
- List Permissions required by Kafka Lag Exporter to run against a secured Kafka cluster #152
- Bugfix: Evict all metrics for a cluster on collector stop or failure #154
0.6.2
- Support init containers in helm chart #135 (@terjesannum)
- Support consumer groups for which member information is unavailable #128 (@lilyevsky)
0.6.1
- Update to Apache Kafka 2.5.0. Resolves issue of "Invalid negative offset" for uninitizalized consumer groups #120
- Graphite support #105 (@yazgoo)
0.6.0
- Add Metadata poll timer metric
kafka_consumergroup_poll_time_ms#105 (@anbarasantr) - Bugfix: Bypass prediction when consumer group is caught up. Reported in #111 (@rkrage).
- Publish Java App Packaging for non-Docker envs #119
0.5.5
- Add kafka topic blacklist #90 (@drrzmr)
- Add metric to represent a consumer group's total offset lag per topic #93 (@dylanmei)
- Support specifying image digest and container securityContext #95 (@terjesannum)
- Allow mounting extra configmaps in pod #94 (@terjesannum)
- Bugfix: Fixed pod annotations support in helm chart #91 (@terjesannum)
- Bugfix: Global label values #82 (@anbarasantr)
- Prometheus Operator Service Operator support #85 (@abhishekjiitr)
- Added kafka_partition_earliest_offset metric for determining the volume of offsets stored in Kafka. #86 (@graphex)
0.5.4
- Bugfix: Accidentally released with local repo.
0.5.3
- Bugfix: Fix Helm Chart: Whitespace in Deployment.yaml #77 (@abhishekjiitr)
- Bugfix: Revert cluster labels (see discussion in #78) #79
0.5.2
- Implement consumer group whitelist #75
- Allow whitelisting Kafka topics #65 (@NeQuissimus)
- Omit service account generation when not using strimzi #64 (@khorshuheng)
- Adding support to control which prometheus metrics to expose #62 (@khorshuheng)
- Adds custom labels for every cluster #61 (@anbarasantr)
- Adding support for custom annotations on pods #59 (@WarpRat)
- Allow Helm to quote Kafka client property values when necessary #58
0.5.1
- Bugfix: Get commit offset for correct group topic partitions #56
0.5.0
- Bugfix: Report NaN for group offset, lag, and time lag when no group offset returned. #50
- Support arbitrary kafka client configuration. #48
- Use ConfigMap to provide app and logging config. #47
- Bugfix: Use lag offsets metric in lag offsets panel Grafana dashboard. #39 (@msravan)
0.4.3
- Update chart defaults to match app defaults. Poll interval: 30s, Lookup table size: 60.
0.4.2
- Bugfix: Check for missing group topic partitions after collecting all group offsets. Regression bugfix. #30
- Make simple polling logging
INFOlog level. AddedDEBUGlogging to show all offsets collected per poll for troubleshooting.
0.4.1
- Remove labels
stateandis_simple_consumerfrom group topic partition metrics - Document metric endpoint filtering #24
- Document standalone deployment mode #22
- Evict metrics from endpoint when they're no longer tracked by Kafka #25
- Support clusters with TLS and SASL #21
0.4.0
- Open Sourced! 🎆 #17
- Add Integration tests using Embedded Kafka #11
- Replace lag in time implementation with interpolation table implementation #5
- Removed
spark-event-exporter. See thespark-committerGitHub project to commit offsets in Spark Structured Streaming back to Kafka. #9 - Implement backoff strategy for Kafka connections in Kafka Lag Exporter #6
- Travis build #7
- Update docs #14
- Update Grafana dashboard
- Licensing headers
- Script release process
0.3.6
- Add
kafka-client-timeoutconfig. - Tune retry and timeout logic of Kafka admin client and consumer
- Use backoff strategy restarting offset collection logic when transient runtime exceptions are encountered
- Terminate when Prometheus HTTP server can't start (i.e. port can't be bound)
0.3.1
- Default partition to 0 (instead of omitting it from being reported) when a consumer group returns no offset for a group partition
- Use
akkaSourcefor actor path in logging
0.3.0
- Bugfix: Parse
poll-intervalin seconds - Rename metric from
kafka_consumergroup_latest_offsettokafka_partition_latest_offset - Use JVM 8 experimental cgroup memory awareness flags when running exporter in container
- Use snakecase for metric label names
- Sample Grafana Dashboard
0.2.0
- Strimzi cluster auto discovery
0.1.0
- Initial release