
This is just a simple demonstration to get a basic understanding of how Kubernetes works while working step by step. I learnt Kubernetes like this and made this repo to solve some problems that I faced during my learning experience so that it might help other beginners. We won't be going into depth about Docker
Important :- By seeing size of the readme, you might have second thoughts. But to be honest, if you work from start to finish, you won't experience any problem and learn along the way.
Contents
- Requirements
- Docker
- Kubernetes
- What is Kubernetes
- Working with Kubernetes
- Setting up a Kubernetes cluster
- Running a local single node Kubernetes cluster with Minikube
- Checking Status of cluster
- Deploying your Node app
- Listing Pods
- Accessing your web application
- Horizontally scaling the application
- Displaying the Pod IP and Pods Node when listing Pods
- Accessing Dashboard when using Minikube
- Pods
- Examining a YAML descriptor of an existing pod
- Introducing the main parts of a POD definition
- Creating a simple YAML descriptor for a pod
- Using kubectl create to create the pod
- Retrieving a PODs logs with Kubectl logs
- Forwarding a Local Network to a port in the Pod
- Introducing labels
- Listing subsets of pods through label selectors
- Using labels and selectors to constrain pod scheduling
- Annotating pods
- Using namespace to group resources
- Stopping and removing pods
- Replication and other controllers: Deploying managed pods
- Introducing ReplicationControllers
- The operation of a ReplicationController
- Introducing the controller reconciliation loop
- Creating a ReplicationController
- Seeing the ReplicationController in action
- Understanding exactly what caused the controller to create a new pod
- Moving pods in and out of the scope of a ReplicationController
- Changing the pod template
- Horizontally scaling pods
- Deleting a ReplicationController
- Using ReplicaSets instead of ReplicationControllers
- Running exactly one pod on each node with DaemonSets
- Running Pod that perform a single completable task
Requirements
You need to:
Simple concepts before we start
What is Docker
Docker is a platform for packaging, distribution and running applications. It allows you to package your application together with its whole environment. This can be either a few libraries that the app requires or even all the files that are usually available on the filesystem of an installed operating system. Docker makes it possible to transfer this package to a central repository from which it can then be transferred to any computer running Docker and executed there.
Three main concepts in Docker comprise this scenario:
- Images :— A Docker based container image is something you package your application and its environment. It contains the filesystem that will be available to the application and other metadata, such as the path to the executable that should be executed when the image is run.
- Registries :- A Docker Registry is a repository that stores your Docker images and facilitates easy sharing of those images between different users and computers. When you build your image, you can either run it on the computer you’ve built it on, or you can push (upload) the image to a registry and then pull (download) it on another computer and run it there. Certain registries are public, allowing anyone to pull images from it, while others are private, only accessible to certain people or machines.
- Containers :- A Docker-based container is a regular Linux container created from a Docker-based container image. A running container is a process running on the host running Docker, but it’s completely isolated from both the host and all other processes running on it. The process is also resource-constrained, meaning it can only access and use the number of resources (CPU, RAM, and so on) that are allocated to it.
Learning while working
Creating a web server
You first need to create a container image. We will use Docker for that. We are creating a simple web server to see how Kubernetes works.
- create a file
app.jsand copy this code into it
const http = require('http');
const os = require('os');
console.log("Kubia server starting...");
var handler = function (request, response) {
  console.log("Received request from " + request.connection.remoteAddress);
  response.writeHead(200);
  response.end("You've hit " + os.hostname() + "\n");
};
var www = http.createServer(handler);
www.listen(8080);
Now we will create a Docker file that will run on a cluster when we create a Docker image.
- Create a file named
Dockerfileand copy this code into it.
FROM node:8

RUN npm i

ADD app.js /app.js

ENTRYPOINT [ "node", "app.js" ]
Building Docker Image
Make sure your Docker server is up and running. Now we will create a Docker image in our local machine. Open your terminal in the current project's folder and run
docker build -t kubia .
You’re telling Docker to build an image called kubia based on the contents of the current directory (note the dot . at the end of the build command). Docker will look for the Dockerfile in the directory and build the image based on the instructions in the file.
Now check your docker image created by running:
docker images
Getting docker images
docker images
This command lists all the images.
Running the container image
docker run --name kubia-container -p 8080:8080 -d kubia
This tells Docker to run a new container called kubia-container from the kubia image. The container will be detached from the console (-d flag), which means it will run in the background. Port 8080 on the local machine will be mapped to Port 8080 inside the container (-p 8080:8080 option), so you can access the app through localhost.
Accessing your application
Run in your terminal:
curl localhost:8080
You’ve hit 44d76963e8e1
Listing all your running containers
You can list all your running containers with this command.
docker ps
The docker ps command only shows the most basic information about the containers.
To get additional information about a container, run this command.
docker inspect kubia-container
You can see all the containers by running:
docker ps -a
Running a shell inside an existing container
The Node.js image on which you’ve based your image contains the bash shell, so you can run the shell inside the container like this:
docker exec -it kubia-container bash
This will run bash inside the existing kubia-container container. The bash process will have the same Linux namespaces as the main container process. This allows you to explore the container from within and see how Node.js and your app see the system when running inside the container.
The -it option is shorthand for two options:
-i, which makes sure STDIN is kept open. You need this for entering commands into the shell.-t, which allocates a pseudo terminal (TTY).
Exploring container from within
Let’s see how to use the shell in the following listing to see the processes running in the container.
root@c61b9b509f9a:/# ps aux
USER       PID %CPU %MEM    VSZ   RSS TTY      STAT START   TIME COMMAND
root         1  0.4  1.3 872872 27832 ?        Ssl  06:01   0:00 node app.js
root        11  0.1  0.1  20244  3016 pts/0    Ss   06:02   0:00 bash
root        16  0.0  0.0  17504  2036 pts/0    R+   06:02   0:00 ps aux
You see only three processes. You don’t see any other processes from the host OS.
Like having an isolated process tree, each container also has an isolated filesystem. Listing the contents of the root directory inside the container will only show the files in the container and will include all the files that are in the image plus any files that are created while the container is running (log files and similar), as shown in the following listing.
root@c61b9b509f9a:/# ls
app.js  bin  boot  dev  etc  home  lib  lib64  media  mnt  opt  package-lock.json  proc  root  run  sbin  srv  sys  tmp  usr  var
It contains the app.js file and other system directories that are part of the node:8 base image you’re using.
To exit the container, you exit the shell by running the exit command and you’ll be returned to your host machine (like logging out of an ssh session, for example).
Stopping and removing a container
docker stop kubia-container
This will stop the main process running in the container and consequently stop the container because no other processes are running inside the container. The container itself still exists and you can see it with docker ps -a. The -a option prints out all the containers, those running and those that have been stopped. To truly remove a container, you need to remove it with the docker rm command:
docker rm kubia-container
This deletes the container. All its contents are removed and it can’t be started again.
Pushing the image to an image registry
The image you’ve built has so far only been available on your local machine. To allow you to run it on any other machine, you need to push the image to an external image registry. For the sake of simplicity, you won’t set up a private image registry and will instead push the image to Docker Hub.
Before you do that, you need to re-tag your image according to Docker Hub’s rules. Docker Hub will allow you to push an image if the image’s repository name starts with your Docker Hub ID.
You create your Docker Hub ID by registering at hub-docker. I’ll use my own ID (knrt10) in the following examples. Please change every occurrence with your own ID.
Once you know your ID, you’re ready to rename your image, currently tagged as kubia, to knrt10/kubia (replace knrt10 with your own Docker Hub ID):
docker tag kubia knrt10/kubia
This doesn’t rename the tag; it creates an additional tag for the same image. You can confirm this by listing the images stored on your system with the Docker images command, as shown in the following listing.
docker images | head
As you can see, both kubia and knrt10/kubia point to the same image ID, so they’re in fact one single image with two tags.
Pushing image to docker hub
Before you can push the image to Docker Hub, you need to log in under your user ID with the docker login command. Once you’re logged in, you can finally push the yourid/kubia image to Docker Hub like this:
docker push knrt10/kubia
What is Kubernetes
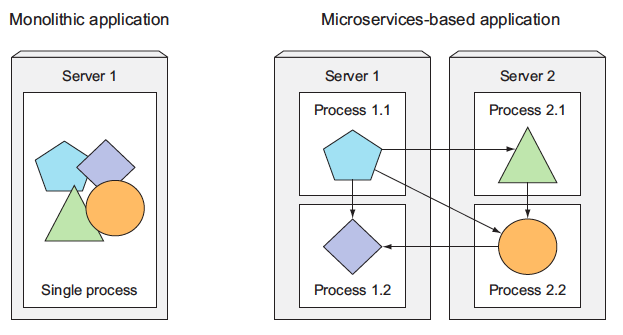
Years ago, most software applications were big monoliths, running either as a single process or as a small number of processes spread across a handful of servers.
Today, these big monolithic legacy applications are slowly being broken down into smaller, independently running components called microservices.
Because microservices are decoupled from each other, they can be developed, deployed, updated, and scaled individually. This enables you to change components quickly and as often as necessary to keep up with today’s rapidly changing business requirements.
But with bigger numbers of deployable components and increasingly larger datacenters, it becomes increasingly difficult to configure, manage, and keep the whole system running smoothly.
It’s much harder to figure out where to put each of those components to achieve high resource utilization and thereby keep the hardware costs down. Doing all this manually is hard work.
We need:
- automation (including automatic scheduling of those components to our servers);
- automatic configuration;
- supervision; and
- failure-handling.
This is where Kubernetes comes in.
Kubernetes enables developers to deploy their applications themselves and as often as they want, without requiring any assistance from the operations (ops) team.
But Kubernetes doesn’t solely benefit developers. It also helps the ops team by automatically monitoring and rescheduling those apps in the event of a hardware failure.
The focus for system administrators (sysadmins) shifts from supervising individual apps to mostly supervising and managing Kubernetes and the rest of the infrastructure, while Kubernetes itself takes care of the apps.
Splitting apps into microservice
Each microservice runs as an independent process and communicates with other microservices through simple, well-defined interfaces (APIs). Refer to the image below:
- Image taken from other source.
Microservices communicate through synchronous protocols such as HTTP, over which they usually expose RESTful (REpresentational State Transfer) APIs, or through asynchronous protocols such as AMQP (Advanced Message Queueing Protocol).
These protocols are simple, well understood by most developers, and not tied to any specific programming language. Each microservice can be written in the language that’s most appropriate for implementing that specific microservice.
Because each microservice is a standalone process with a relatively static external API, it’s possible to develop and deploy each microservice separately. A change to one of them doesn’t require changes or redeployment of any other service, provided that the API doesn’t change or changes only in a backward-compatible way.
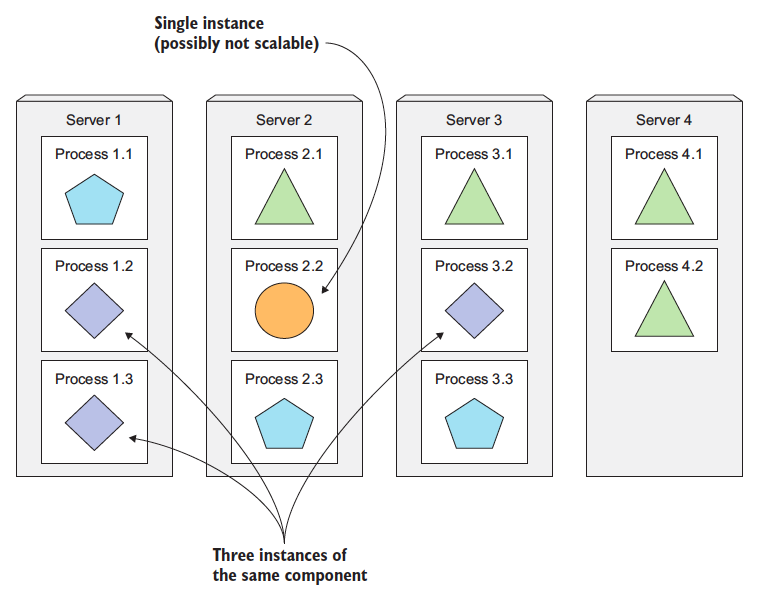
Scaling Microservices
Scaling microservices, unlike monolithic systems, where you need to scale the system as a whole, is done on a per-service basis, which means you have the option of scaling only those services that require more resources, while leaving others at their original scale. Refer to the image below:
- Image taken from other source.
When a monolithic application can’t be scaled out because one of its parts is unscalable, splitting the app into microservices allows you to horizontally scale the parts that allow scaling out. The parts that don't scale horizontally can be scaled vertically instead.
Deploying Microservices
As always, microservices also have drawbacks. When your system consists of only a small number of deployable components, managing those components is easy. It’s trivial to decide where to deploy each component, because there aren’t that many choices.
When the number of those components increases, deployment-related decisions become increasingly difficult because not only does the number of deployment combinations increase, but the number of inter-dependencies between the components increases by an even greater factor.
Microservices also bring other problems, such as making it hard to debug and trace execution calls, because they span multiple processes and machines. Luckily, these problems are now being addressed with distributed tracing systems such as Zipkin.
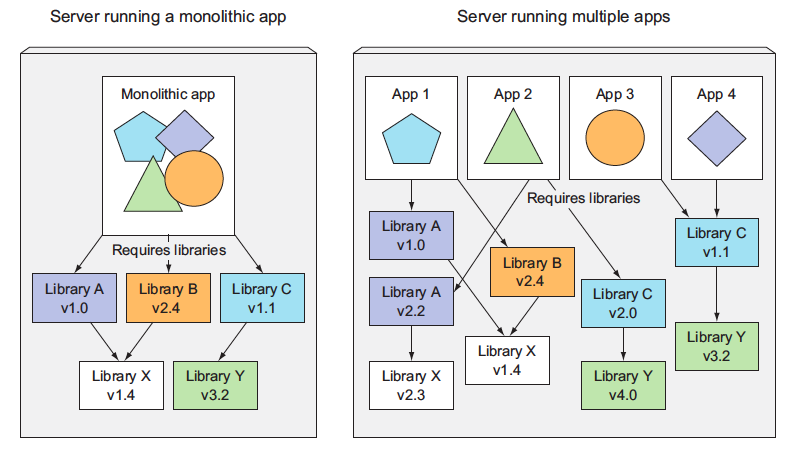
Multiple applications running on the same host may have conflicting dependencies.
Working with Kubernetes
Now that you have your app packaged inside a container image and made available through Docker Hub, you can deploy it in a Kubernetes cluster instead of running it in Docker directly. But first, you need to set up the cluster itself.
Setting up a Kubernetes cluster
Setting up a full-fledged, multi-node Kubernetes cluster isn’t a simple task, especially if you’re not well-versed in Linux and networking administration.
A proper Kubernetes install spans multiple physical or virtual machines and requires the networking to be set up properly so that all the containers running inside the Kubernetes cluster can connect to each other through the same flat networking space.
Running a local single node Kubernetes cluster with Minikube
The simplest and quickest path to a fully functioning Kubernetes cluster is by using Minikube. Minikube is a tool that sets up a single-node cluster that’s great for both testing Kubernetes and developing apps locally.
Starting a Kubernetes cluster with minikube
Once you have Minikube installed locally, you can immediately start up the Kubernetes cluster with the following command:
minikube start
Starting local Kubernetes cluster...
Starting VM...
SSH-ing files into VM...
...
Kubectl is now configured to use the cluster.
Starting the cluster takes more than a minute, so don’t interrupt the command before it completes.
Checking to see if the cluster is up and Kubernetes can talk to it
To interact with Kubernetes, you also need the kubectl CLI client. Installing it is easy.
To verify your cluster is working, you can use the kubectl cluster-info command shown in the following listing.
kubectl cluster-info
Kubernetes master is running at https://192.168.99.100:8443

kubernetes-dashboard is running at https://192.168.99.100:8443/api/v1/...

KubeDNS is running at https://192.168.99.100:8443/api/v1/namespaces/kube-system/services/kube-dns:dns/proxy
This shows the cluster is up. It shows the URLs of the various Kubernetes components, including the API server and the web console.
Deploying your Node app
A simple way to deploy your app is to use the kubectl create command, which will create all the necessary components without having to deal with JSON or YAML.
kubectl create deployment kubia --image=knrt10/kubia --port=8080
The --image=knrt10/kubia part obviously specifies the container image you want to run, and the --port=8080 option tells Kubernetes that your app is listening on port 8080.
Listing Pods
Because you can’t list individual containers since they’re not standalone Kubernetes objects, can you list pods instead? Yes, you can. Let’s see how to tell kubectl to list pods in the following listing.
kubectl get pods
$ kubectl get pods
NAME                     READY   STATUS    RESTARTS   AGE
kubia-57c4d74858-tflb8   1/1     Running   0          24s
Accessing your web application
With your pod running, how do you access it? Each pod gets its own IP address, but this address is internal to the cluster and isn’t accessible from outside of it. To make the pod accessible from the outside, you’ll expose it through a Service object.
You’ll create a special service of type LoadBalancer because if you create a regular service (a ClusterIP service), as the pod, it would also only be accessible from inside the cluster. By creating a LoadBalancer-type service, an external load balancer will be created and you can connect to the pod through the load balancer’s public IP.
Creating a service object
To create the service, you’ll tell Kubernetes to expose the Deployment you created earlier:
kubectl expose deploy kubia --type=LoadBalancer --name kubia-http
service/kubia-http exposed
Important: We’re using the abbreviation deploy instead of deployments. Most resource types have an abbreviation like this so you don’t have to type the full name (for example, po for pods, svc for services, and so on).
Listing Services
The expose command’s output mentions a service called kubia-http. Services are objects like Pods and Nodes, so you can see the newly created Service object by running the kubectl get services | svc command, as shown in the following listing.
kubectl get svc
NAME         TYPE           CLUSTER-IP     EXTERNAL-IP   PORT(S)          AGE
kubernetes   ClusterIP      10.96.0.1      <none>        443/TCP          30h
kubia-http   LoadBalancer   10.107.88.67   <pending>     8080:32718/TCP   81s
Important :- Minikube doesn’t support LoadBalancer services, so the service will never get an external IP. But you can access the service anyway through its external port. So external IP will always be pending in that case. When using Minikube, you can get the IP and port through which you can access the service by running
minikube service kubia-http
Horizontally scaling the application
You now have a running application, monitored and kept running by a Deployment and exposed to the world through a service. Now let’s make additional magic happen. One of the main benefits of using Kubernetes is the simplicity with which you can scale your deployments. Let’s see how easy it is to scale up the number of pods. You’ll increase the number of running instances to three.
Your pod is managed by a Deployment. Let’s see it with the kubectl get command:
kubectl get deploy
NAME    READY   UP-TO-DATE   AVAILABLE   AGE
kubia   1/1     1            1           4m58s
Increasing the desired Replica count
To scale up the number of replicas of your pod, you need to change the desired replica count in the Deployment like this:
kubectl scale deploy kubia --replicas=3
deployment.apps/kubia scaled
You’ve now told Kubernetes to make sure three instances of your pod are always running. Notice that you didn’t instruct Kubernetes what action to take. You didn’t tell it to add two more pods. You only set the new desired number of instances and let Kubernetes determine what actions it needs to take to achieve the requested state.
Seeing the result of the Scale Out
Back to your replica count increase. Let’s list the Deployments again to see the updated replica count:
kubectl get deploy
NAME    READY   UP-TO-DATE   AVAILABLE   AGE
kubia   3/3     3            3           6m43s
Because the actual number of pods has already been increased to three (as evident from the CURRENT column), listing all the pods should now show three pods instead of one:
kubectl get pods
NAME                     READY   STATUS    RESTARTS   AGE
kubia-57c4d74858-d284g   1/1     Running   0          94s
kubia-57c4d74858-tflb8   1/1     Running   0          7m9s
kubia-57c4d74858-wfgmb   1/1     Running   0          94s
As you can see, three pods exist instead of one. Currently running, but if it is pending, it would be ready in a few moments, as soon as the container image is downloaded and the container is started.
As you can see, scaling an application is incredibly simple. Once your app is running in production and a need to scale the app arises, you can add additional instances with a single command without having to install and run additional copies manually.
Keep in mind that the app itself needs to support being scaled horizontally. Kubernetes doesn’t magically make your app scalable; it only makes it trivial to scale the app up or down.
Displaying the Pod IP and Pods Node when listing Pods
If you’ve been paying close attention, you probably noticed that the kubectl get pods command doesn’t even show any information about the nodes the pods are scheduled to. This is because it’s usually not an important piece of information.
But you can request additional columns to display using the -o wide option. When listing pods, this option shows the pod’s IP and the node the pod is running on:
kubectl get pods -o wide
$ kubectl get pods -o wide
NAME                     READY   STATUS    RESTARTS   AGE     IP           NODE       NOMINATED NODE   READINESS GATES
kubia-57c4d74858-d284g   1/1     Running   0          2m53s   172.17.0.5   minikube   <none>           <none>
kubia-57c4d74858-tflb8   1/1     Running   0          8m28s   172.17.0.3   minikube   <none>           <none>
kubia-57c4d74858-wfgmb   1/1     Running   0          2m53s   172.17.0.4   minikube   <none>           <none>
Accessing Dashboard when using Minikube
To open the dashboard in your browser when using Minikube to run your Kubernetes cluster, run the following command:
minikube dashboard
Pods
Pods and other Kubernetes resources are usually created by posting a JSON or YAML manifest to the Kubernetes REST API endpoint. Also, you can use other, simpler ways of creating resources, such as the kubectl run command, but they usually only allow you to configure a limited set of properties, not all. Additionally, defining all your Kubernetes objects from YAML files makes it possible to store them in a version control system, with all the benefits it brings.
Examining a YAML descriptor of an existing pod
You’ll use the kubectl get command with the -o yaml option to get the whole YAML definition of the pod, or you can use -o json to get the whole JSON definition as shown in the following listing.
kubectl get po kubia-bsksp -o yaml
Introducing the main parts of a POD definition
The pod definition consists of a few parts. First, there’s the Kubernetes API version used in the YAML and the type of resource the YAML is describing. Then, three important sections are found in almost all Kubernetes resources:
- Metadata includes the name, namespace, labels, and other information about the pod.
- Spec contains the actual description of the pod’s contents, such as the pod’s containers, volumes, and other data.
- Status contains the current information about the running pod, such as what condition the pod is in, the description and status of each container, and the pod’s internal IP and other basic info.
The status part contains read-only runtime data that shows the state of the resource at a given moment. When creating a new pod, you never need to provide the status part.
The three parts described previously show the typical structure of a Kubernetes API object. All other objects have the same anatomy. This makes understanding new objects relatively easy.
Going through all the individual properties in the previous YAML doesn’t make much sense, so, instead, let’s see what the most basic YAML for creating a pod looks like.
Creating a simple YAML descriptor for a pod
You’re going to create a file called kubia-manual.yaml (you can create it in any directory you want), or copy from this repo, where you’ll find the file with filename kubia-manual.yaml. The following listing shows the entire contents of the file.
apiVersion: v1
kind: Pod
metadata:
  name: kubia-manual
spec:
  containers:
  - image: knrt10/kubia
    name: kubia
    ports:
    - containerPort: 8080
      protocol: TCP
Let’s examine this descriptor in detail. It conforms to the v1 version of the Kubernetes API. The type of resource you’re describing is a pod, with the name kubia-manual. The pod consists of a single container based on the knrt10/kubia image. You’ve also given a name to the container and indicated that it’s listening on port 8080.
Using kubectl create to create the pod
To create the pod from your YAML file, use the kubectl create command:
kubectl create -f kubia-manual.yaml
pod/kubia-manual created
The kubectl create -f command is used for creating any resource (not only pods) from a YAML or JSON file.
Retrieving a PODs logs with Kubectl logs
Your little Node.js application logs to the process’s standard output. Containerized applications usually log to the standard output and standard error stream instead of writing their logs to files. This is to allow users to view logs of different applications in a simple, standard way.
To see your pod’s log (more precisely, the container’s log) you run the following command on your local machine (no need to ssh anywhere):
kubectl logs kubia-manual
Kubia server starting...
You haven’t sent any web requests to your Node.js app, so the log only shows a single log statement about the server starting up. As you can see, retrieving logs of an application running in Kubernetes is incredibly simple if the pod only contains a single container.
Specifying the container name when getting logs of multiple container pod
If your pod includes multiple containers, you have to explicitly specify the container name by including the -c container name option when running kubectl logs. In your kubia-manual pod, you set the container’s name to kubia, so if additional containers exist in the pod, you’d have to get its logs like this:
kubectl logs kubia-manual -c kubia
Note that you can only retrieve container logs of pods that are still in existence. When a pod is deleted, its logs are also deleted.
Forwarding a Local Network to a port in the Pod
When you want to talk to a specific pod without going through a service (for debugging or other reasons), Kubernetes allows you to configure port forwarding to the pod. This is done through the kubectl port-forward command. The following command will forward your machine’s local port 8888 to port 8080 of your kubia-manual pod:
kubectl port-forward kubia-manual 8888:8080
In a different terminal, you can now use curl to send an HTTP request to your pod through the kubectl port-forward proxy running on localhost:8888:
curl localhost:8888
You've hit kubia-manual
Using port forwarding like this is an effective way to test an individual pod.
Introducing labels
Organizing pods and all other Kubernetes objects is done through labels. Labels are a simple, yet incredibly powerful, Kubernetes feature for organizing not only pods, but all other Kubernetes resources. A label is an arbitrary key-value pair you attach to a resource, which is then utilized when selecting resources using label selectors (resources are filtered based on whether they include the label specified in the selector).
Specifying labels when creating a pod
Now, you’ll see labels in action by creating a new pod with two labels. Create a new file called kubia-manual-with-labels.yaml with the contents of the following listing. You can also copy from kubia-manual-with-labels.yaml
apiVersion: v1
kind: Pod
metadata:
  name: kubia-manual-v2
  labels:
    creation_method: manual
    env: prod
spec:
  containers:
  - image: knrt10/kubia
    name: kubia
    ports:
    - containerPort: 8080
      protocol: TCP
You’ve included the labels creation_method=manual and env=data.labels section. You’ll create this pod now:
kubectl create -f kubia-manual-with-labels.yaml
pod/kubia-manual-v2 created
The kubectl get po command doesn’t list any labels by default, but you can see them by using the --show-labels switch:
kubectl get po --show-labels
NAME              READY     STATUS    RESTARTS   AGE       LABELS
kubia-5k788       1/1       Running   1          8d        run=kubia
kubia-7zxwj       1/1       Running   1          5d        run=kubia
kubia-bsksp       1/1       Running   1          5d        run=kubia
kubia-manual      1/1       Running   0          7h        <none>
kubia-manual-v2   1/1       Running   0          3m        creation_method=manual,env=prod
Instead of listing all labels, if you’re only interested in certain labels, you can specify them with the -L switch and have each displayed in its own column. List pods again and show the columns for the two labels you’ve attached to your kubia-manual-v2 pod:
kubectl get po -L creation_method,env
Modifying labels of existing pods
Labels can also be added to and modified on existing pods. Because the kubia-manual pod was also created manually, let’s add the creation_method=manual label to it:
kubectl label po kubia-manual creation_method=manual
Now, let’s also change the env=prod label to env=debug on the kubia-manual-v2 pod, to see how existing labels can be changed. You need to use the --overwrite option when changing existing labels.
kubectl label po kubia-manual-v2 env=debug --overwrite
Listing subsets of pods through label selectors
Attaching labels to resources so you can see the labels next to each resource when listing them isn’t that interesting. But labels go hand in hand with label selectors. Label selectors allow you to select a subset of pods tagged with certain labels and perform an operation on those pods.
A label selector can select resources based on whether the resource
- Contains (or doesn’t contain) a label with a certain key
- Contains a label with a certain key and value
- Contains a label with a certain key, but with a value not equal to the one you specify
Listing pods using a label selector
Let’s use label selectors on the pods you’ve created so far. To see all pods you created manually (you labeled them with creation_method=manual), do the following:
kubectl get po -l creation_method=manual
NAME              READY     STATUS    RESTARTS   AGE
kubia-manual      1/1       Running   0          22h
kubia-manual-v2   1/1       Running   0          14h
And those that don’t have the env label:
kubectl get po -l '!env'
NAME           READY     STATUS    RESTARTS   AGE
kubia-5k788    1/1       Running   1          9d
kubia-7zxwj    1/1       Running   1          5d
kubia-bsksp    1/1       Running   1          5d
kubia-manual   1/1       Running   0          22h
Make sure to use single quotes around !env, so the bash shell doesn’t evaluate the exclamation mark
Using multiple conditions in a label selector
A selector can also include multiple comma-separated criteria. Resources need to match all of them to match the selector. You can execute command given below
kubectl get po -l '!env , !creation_method' --show-labels
Using labels and selectors to constrain pod scheduling
All the pods you’ve created so far have been scheduled pretty much randomly across your worker nodes. Certain cases exist, however, where you’ll want to have at least a little say in where a pod should be scheduled. A good example is when your hardware infrastructure isn’t homogenous. You never want to say specifically what node a pod should be scheduled to, because that would couple the application to the infrastructure, whereas the whole idea of Kubernetes is hiding the actual infrastructure from the apps that run on it.
Using labels for categorizing worker nodes
The pods aren't only kubernetes resource type that you can attach label to. Labels can be attached to any Kubernetes resource including nodes.
Let’s imagine one of the nodes in your cluster contains a GPU meant to be used for general-purpose GPU computing. You want to add a label to the node showing this feature. You’re going to add the label gpu=true to one of your nodes (pick one out of the list returned by kubectl get nodes):
kubectl label node minikube gpu=true
node/minikube labeled
Now you can use a label selector when listing the nodes, like you did before with pods. List only nodes that include the label gpu=true:
kubectl get node -l gpu=true
NAME       STATUS    ROLES     AGE       VERSION
minikube   Ready     master    9d        v1.10.0
As expected, only one node has this label. You can also try listing all the nodes and tell kubectl to display an additional column showing the values of each node’s gpu label.
kubectl get nodes -L gpu
NAME       STATUS    ROLES     AGE       VERSION   GPU
minikube   Ready     master    9d        v1.10.0   true
Scheduling pods to specific nodes
Now imagine you want to deploy a new pod that needs a GPU to perform its work. To ask the scheduler to only choose among the nodes that provide a GPU, you’ll add a node selector to the pod’s YAML. Create a file called kubia-gpu.yaml with the following listing’s contents and then use kubectl create -f kubia-gpu.yaml to create the pod. The contents of file are
apiVersion: v1
kind: Pod
metadata:
  name: kubia-gpu
spec:
  nodeSelector:
    gpu: "true"
  containers:
  - image: luksa/kubia
    name: kubia
You’ve added a nodeSelector field under the spec section. When you create the pod, the scheduler will only choose among the nodes that contain the gpu=true label (which is only a single node in your case).
Scheduling to one specific node
Similarly, you could also schedule a pod to an exact node, because each node also has a unique label with the key kubernetes.io/hostname and value set to the actual hostname of the node. Example shown below
kubectl get nodes --show-labels
NAME       STATUS    ROLES     AGE       VERSION   LABELS
minikube   Ready     master    9d        v1.10.0   beta.kubernetes.io/arch=amd64,beta.kubernetes.io/os=linux,gpu=true,kubernetes.io/hostname=minikube,node-role.kubernetes.io/master=
But setting the nodeSelector to a specific node by the hostname label may lead to the pod being unschedulable if the node is offline.
Annotating pods
In addition to other labels, pods and other objects can also contain annotations. They are also key value pairs, so in essence they are similar to labels, but aren't meant to hold identifying information. They can't be used to group objects the way label can. While objects can be selected through label selectors, there’s no such thing as an annotation selector. On the other hand, annotations can hold much larger pieces of information and are primarily meant to be used by tools. Certain annotations are automatically added to objects by Kubernetes, but others are added by users manually.
A great use to annotating pods is to add desciption to each pod or other API object so that everyone using the cluster can quickly look up information about each individual object.
Looking up an objects annotations
Let’s see an example of an annotation that Kubernetes added automatically to the pod you created in the previous section. To see the annotations, you’ll need to request the full YAML of the pod or use the kubectl describe command. You’ll use the first option in the following listing.
kubectl get po kubia-zb95q -o yaml
apiVersion: v1
kind: Pod
metadata:
  annotations:
    kubernetes.io/created-by: |
      {"kind":"SerializedReference", "apiVersion":"v1",
      "reference":{"kind":"ReplicationController", "namespace":"default", ...
Without going into too many details, as you can see, the kubernetes.io/created-by
annotation holds JSON data about the object that created the pod. That’s not something
you’d want to put into a label. Labels should be short, whereas annotations can
contain relatively large blobs of data (up to 256 KB in total).
Important:- The kubernetes.io/created-by annotations was deprecated in version
1.8 and will be removed in 1.9, so you will no longer see it in the YAML.
Adding and modifying annotations
Annotations can obviously be added to pods at creation time, the same way label can. But we can also add it after using the following command. Let's try adding this to kubia-manual pod now.
kubectl annotate pod kubia-manual knrt10.github.io/someannotation="messi ronaldo"
You added the annotation knrt10.github.io/someannotation with the value messi ronaldo. It’s a good idea to use this format for annotation keys to prevent key collisions. When different tools or libraries add annotations to objects, they may accidentally override each other’s annotations if they don’t use unique prefixes like you did here. You can check your pod now using following command
kubectl describe po kubia-manual
Using namespace to group resources
Previously we saw how labels organize pods and objects into groups. Because each object can have multiple labels, those groups of objects can overlap. Plus, when working with the cluster (through kubectl for example), if you don’t explicitly specify a label selector, you’ll always see all objects.
Discovering other namespaces and their pods
Let us first list all the namespaces in our cluster, type the following command
kubectl get ns
NAME          STATUS    AGE
default       Active    9h
kube-public   Active    9h
kube-system   Active    9h
Up to this point, you’ve operated only in the default namespace. When listing resources with the kubectl get command, you’ve never specified the namespace explicitly, so kubectl always defaulted to the default namespace, showing you only the objects in that namespace. But as you can see from the list, the kube-public and the kube-system namespaces also exist. Let’s look at the pods that belong to the kube-system namespace, by telling kubectl to list pods in that namespace only:
kubectl get po -n kube-system
NAME                                    READY     STATUS    RESTARTS   AGE
etcd-minikube                           1/1       Running   0          4h
kube-addon-manager-minikube             1/1       Running   1          9h
kube-apiserver-minikube                 1/1       Running   0          4h
kube-controller-manager-minikube        1/1       Running   0          4h
kube-dns-86f4d74b45-w8mqv               3/3       Running   4          9h
kube-proxy-25t92                        1/1       Running   0          4h
kube-scheduler-minikube                 1/1       Running   0          4h
kubernetes-dashboard-5498ccf677-2zcw5   1/1       Running   2          9h
storage-provisioner                     1/1       Running   2          9h
I will explain about these pods later (don’t worry if the pods shown here don’t match the ones on your system exactly). It’s clear from the name of the namespace that these are resources related to the Kubernetes system itself. By having them in this separate namespace, it keeps everything nicely organized. If they were all in the default namespace, mixed in with the resources you create yourself, you’d have a hard time seeing what belongs where, and you might inadvertently delete system resources.
Namespaces enable you to separate resources that don’t belong together into nonoverlapping groups. If several users or groups of users are using the same Kubernetes cluster, and they each manage their own distinct set of resources, they should each use their own namespace. This way, they don’t need to take any special care not to inadvertently modify or delete the other users’ resources and don’t need to concern themselves with name conflicts, because namespaces provide a scope for resource names, as has already been mentioned.
Creating a namespace
A namespace is a Kubernetes resource like any other, so you can create it by posting a YAML file to the Kubernetes API server. Let’s see how to do this now.
You’re going to create a file called custom-namespace.yaml (you can create it in any directory you want), or copy from this repo, where you’ll find the file with filename custom-namespace.yaml. The following listing shows the entire contents of the file.
apiVersion: v1
kind: Namespace
metadata:
  name: custom-namespace
Now type the following command
kubectl create -f custom-namespace.yaml
namespace/custom-namespace created
Managing objects in other namespaces
To create resources in the namespace you’ve created, either add a namespace: customnamespace entry to the metadata section, or specify the namespace when creating the resource with the kubectl create command:
kubectl create -f kubia-manual.yaml -n custom-namespace
pod/kubia-manual created
You now have two pods with the same name (kubia-manual). One is in the default
namespace, and the other is in your custom-namespace.
When listing, describing, modifying, or deleting objects in other namespaces, you
need to pass the --namespace (or -n) flag to kubectl. If you don’t specify the namespace, kubectl performs the action in the default namespace configured in the current kubectl context. The current context’s namespace and the current context itself can be changed through kubectl config commands.
Understanding the isolation provided by namespaces
To wrap up this section about namespaces, let me explain what namespaces don’t provide at least not out of the box. Although namespaces allow you to isolate objects into distinct groups, which allows you to operate only on those belonging to the specified namespace, they don’t provide any kind of isolation of running objects. For example, you may think that when different users deploy pods across different namespaces, those pods are isolated from each other and can’t communicate but that’s not necessarily the case. Whether namespaces provide network isolation depends on which networking solution is deployed with Kubernetes. When the solution doesn’t provide inter-namespace network isolation, if a pod in namespace foo knows the IP address of a pod in namespace bar, there is nothing preventing it from sending traffic, such as HTTP requests, to the other pod.
Stopping and removing pods
We have created a number of pods which should all be running. If you have followed from the start, you should have 5 pods in default namespace and one in custom-namespace. We are going to stop them all now, because we don't need them anymore.
Deleting a pod by name
Let's first delele kubia-gpu pod name
kubectl delete po kubia-gpu
Deleting pods using label selectors
Instead of specifying each pod to delete by name, you’ll now use what you’ve learned
about label selectors to stop both the kubia-manual and the kubia-manual-v2 pod.
Both pods include the creation_method=manual label, so you can delete them by
using a label selector:
kubectl delete po -l creation_method=manual
pod "kubia-manual" deleted pod "kubia-manual-v2" deleted
In the earlier microservices example, where you had tens (or possibly hundreds) of
pods, you could, for instance, delete all canary pods at once by specifying the
rel=canary label selector
kubectl delete po -l rel=canary
Deleting pods by deleting the whole namespace
Okay, back to your real pods. What about the pod in the custom-namespace? We no
longer need either the pods in that namespace, or the namespace itself. You can delete the whole namespace using the following command. Your all pods inside that workspace will be automatically deleted.
kubectl delete ns custom-namespace
namespace "custom-namespace" deleted
Deleting all pods in namespace, while keeping the namespace
Suppose you want to keep your namespace but delete all the pods in it, so this is the approach to follow. We now have cleaned almost everything but we have some pods running if you ran the kubectl run command before.
This time, instead of deleting the specific pod, tell Kubernetes to delete all pods in the current namespace by using the --all option
kubectl delete po --all
pod "kubia-pjxrs" deleted
pod "kubia-xvfxp" deleted
pod "kubia-zb95q" deleted
Now, double check that no pods were left running:
kubectl get po
kubia-5gknm   1/1       Running   0          48s
kubia-h62k7   1/1       Running   0          48s
kubia-x4nsb   1/1       Running   0          48s
Wait, what!?! All pods are terminating, but a new pod which weren't there before, has appeared. No matter how many times you delete all pods, a new pod called kubia-something will emerge.
You may remember you created your first pod with the kubectl run command. I mentioned that this doesn’t create a pod directly, but instead creates a ReplicationController, which then creates the pod. As soon as you delete a pod created by the ReplicationController, it immediately creates a new one. To delete the pod, you also need to delete the ReplicationController.
Delete almost all resources in namespace
You can delete the ReplicationController and the pods, as well as all the Services you’ve created, by deleting all resources in the current namespace with a single command:
kubectl delete all --all
pod "kubia-5gknm" deleted
pod "kubia-h62k7" deleted
pod "kubia-x4nsb" deleted
replicationcontroller "kubia" deleted
service "kubernetes" deleted
service "kubia-http" deleted
The first all in the command specifies that you’re deleting resources of all types, and the --all option specifies that you’re deleting all resource instances instead of specifying them by name (you already used this option when you ran the previous delete command).
As it deletes resources, kubectl will print the name of every resource it deletes. In the list, you should see the kubia ReplicationController and the kubia-http Service you created before.
Note:- The kubectl delete all --all command also deletes the kubernetes Service, but it should be recreated automatically in a few moments.
Replication and other controllers: Deploying managed pods
As far now, you might have understood that pods represent the basic deployment unit in Kubernetes. We know how to create, supervise and manage them manually. But in real-world use cases, you want your deployments to stay up and running automatically and remain healthy without any manual intervention. To do this, we never almost create pods directly. Instead we create other type of resources like ReplicationControllers or Deployments which then create and manage the actual pods.
When you create unmanaged pods (such as the ones we created previously), a cluster node is selected to run the pod and then its containers are run on that node. Now, we'll learn that Kubernetes then monitors those containers and automatically restarts them if they fail. But if the whole node fails, the pods on the node are lost and will not be replaced with new ones, unless those pods are managed by the previously mentioned ReplicationControllers or similar.
We'll now learn how Kubernetes checks if a container is still alive and restarts it if it isn’t. We’ll also learn how to run managed pods—both those that run indefinitely and those that perform a single task and then stop.
Keeping pods healthy
One of the main benefits of using Kubernetes is the ability to give it a list of containers and let it keep those containers running somewhere in the cluster. You do this by creating a Pod resource and letting Kubernetes pick a worker node for it and run the pod’s containers on that node. But what if one of those containers dies? What if all containers of a pod die?
As soon as a pod is scheduled to a node, the Kubelet on that node will run its containers and, from then on, keep them running as long as the pod exists. If the container’s main process crashes, the Kubelet will restart the container. If your application has a bug that causes it to crash every once in a while, Kubernetes will restart it automatically, so even without doing anything special in the app itself, running the app in Kubernetes automatically gives it the ability to heal itself.
But sometimes apps stop working without their process crashing. For example, a Java app with a memory leak will start throwing OutOfMemoryErrors, but the JVM process will keep running. It would be great to have a way for an app to signal to Kubernetes that it’s no longer functioning properly and have Kubernetes restart it.
We’ve said that a container that crashes is restarted automatically, so maybe you’re thinking you could catch these types of errors in the app and exit the process when they occur. You can certainly do that, but it still doesn’t solve all your problems.
For example, what about those situations when your app stops responding because it falls into an infinite loop or a deadlock? To make sure applications are restarted in such cases, you must check an application’s health from the outside and not depend on the app doing it internally.
Introducing liveness probes
Kubernetes can check if a container is still alive through liveness probes. You can specify a liveness probe for each container in the pod's specification. Kubernetes can probe the container using one of three mechanisms:
-
An
HTTP GETprobe performs an HTTP GET request on the container's IP address, a port and path you specify. If the probe receives a response and the response code doesn’t represent an error (in other words, if the HTTP response code is 2xx or 3xx), the probe is considered successful. If the server returns an error response code or if it doesn’t respond at all, the probe is considered a failure and the container will be restarted as a result. -
A
TCP Socketprobe tries to open a TCP connection to the specified port of the container. If the connection is established successfully, the probe is successful. Otherwise, the container is restarted. -
An
Execprobe executes an arbitrary command inside the container and checks the command’s exit status code. If the status code is 0, the probe is successful. All other probes are considered as failure.
Creating an HTTP based liveness probe
Let’s see how to add a liveness probe to your Node.js app. Because it’s a web app, it makes sense to add a liveness probe that will check whether its web server is serving requests. But because this particular Node.js app is too simple to ever fail, you’ll need to make the app fail artificially.
To properly demo liveness probes, you’ll modify the app slightly and make it return a 500 Internal Server Error HTTP status code for each request after the fifth one—your app will handle the first five client requests properly and then return an error on every subsequent request. Thanks to the liveness probe, it should be restarted when that happens, allowing it to properly handle client requests again.
I’ve pushed the container image to Docker Hub, so you don’t need to build it yourself. If you want you can see folder kubia-unhealthy for more information. You’ll create a new pod that includes an HTTP GET liveness probe. The following listing shows the YAML for the pod.
You’re going to create a file called kubia-liveness-probe.yaml (you can create it in any directory you want), or copy from this repo, where you’ll find the file with filename kubia-liveness-probe.yaml. The following listing shows the entire contents of the file.
apiVersion: v1
kind: Pod
metadata:
  name: kubia-liveness
spec:
  containers:
  - image: knrt10/kubia-unhealthy
    name: kubia
    livenessProbe:
      httpGet:
        path: /
        port: 8080
The pod descriptor defines an httpGet liveness probe, which tells Kubernetes to periodically perform HTTP GET requests on path / on port 8080 to determine if the container is still healthy. These requests start as soon as the container is run.
After five such requests (or actual client requests), your app starts returning HTTP status code 500, which Kubernetes will treat as a probe failure, and will thus restart the container.
Seeing a liveness probe in action
To see what a liveness probe does, try creating a pod now. After about a minute and a half, the container will be restarted. You can see that by running kubectl get
kubectl get po kubia-liveness
NAME READY STATUS RESTARTS AGE
kubia-liveness 1/1 Running 1 2m
The RESTARTS column shows that the pod’s container has been restarted once (if you
wait another minute and a half, it gets restarted again, and then the cycle continues
indefinitely).
You can see why the container had to be restarted by looking at what kubectl describe prints out. You can see that the container is currently running, but it previously terminated because of an error. The exit code was 137, which has a special meaning. It denotes that the process was terminated by an external signal. The number 137 is a sum of two numbers: 128+x, where x is the signal number sent to the process that caused it to terminate.
In the example, x equals 9, which is the number of the SIGKILL signal, meaning the process was killed forcibly. When a container a killed, a completely new container is created it's not the same container being restarted again.
Configuring additional properties of liveness probe
You may have noticed that kubectl describe also displays additional information
about the liveness probe:
Liveness: http-get http://:8080/ delay=0s timeout=1s period=10s #success=1
➥ #failure=3
Beside the liveness probe options you specified explicitly, you can also see additional properties, such as delay, timeout, period, and so on. The delay=0s part shows that the probing begins immediately after the container is started. The timeout is set to only 1 second, so the container must return a response in 1 second or the probe is counted as failed. The container is probed every 10 seconds (period=10s) and the container is restarted after the probe fails three consecutive times (#failure=3).
If you don’t set the initial delay, the prober will start probing the container as soon as it starts, which usually leads to the probe failing, because the app isn’t ready to start receiving requests. If the number of failures exceeds the failure threshold, the container is restarted before it’s even able to start responding to requests properly.
TIP:- Always remember to set an initial delay to account for your app’s startup time.
I’ve seen this on many occasions and users were confused why their container was being restarted. But if they’d used kubectl describe, they’d have seen that the container terminated with exit code 137 or 143, telling them that the pod was terminated externally. Additionally, the listing of the pod’s events would show that the container was killed because of a failed liveness probe. If you see this happening at pod startup, it’s because you failed to set initialDelaySeconds appropriately.
Creating effective liveness probe
For pods running in production, you should always define a liveness probe. Without one, Kubernetes has no way of knowing whether your app is still alive or not. As long as the process is still running, Kubernetes will consider the container to be healthy.
WHAT A LIVENESS PROBE SHOULD CHECK
Your simplistic liveness probe simply checks if the server is responding. While this may seem overly simple, even a liveness probe like this does wonders, because it causes the container to be restarted if the web server running within the container stops responding to HTTP requests. Compared to having no liveness probe, this is a major improvement, and may be sufficient in most cases.
But for a better liveness check, you’d configure the probe to perform requests on a specific URL path (/health, for example) and have the app perform an internal status check of all the vital components running inside the app to ensure none of them has died or is unresponsive.
TIP:- Make sure the /health HTTP endpoint doesn’t require authentication; otherwise the probe will always fail, causing your container to be restarted indefinitely.
Be sure to check only the internals of the app and nothing influenced by an external factor. For example, a frontend web server’s liveness probe shouldn’t return a failure when the server can’t connect to the backend database. If the underlying cause is in the database itself, restarting the web server container will not fix the problem. Because the liveness probe will fail again, you’ll end up with the container restarting repeatedly until the database becomes accessible again.
KEEPING PROBES LIGHT
Liveness probes shouldn’t use too many computational resources and shouldn’t take too long to complete. By default, the probes are executed relatively often and are only allowed one second to complete. Having a probe that does heavy lifting can slow down your container considerably. Later in the book, you’ll also learn about how to limit CPU time available to a container. The probe’s CPU time is counted in the container’s CPU time quota, so having a heavyweight liveness probe will reduce the CPU time available to the main application processes.
DON’T BOTHER IMPLEMENTING RETRY LOOPS IN YOUR PROBES
You’ve already seen that the failure threshold for the probe is configurable and usually the probe must fail multiple times before the container is killed. But even if you set the failure threshold to 1, Kubernetes will retry the probe several times before considering it a single failed attempt. Therefore, implementing your own retry loop into the probe is wasted effort.
LIVENESS PROBE WRAP-UP
You now understand that Kubernetes keeps your containers running by restarting them if they crash or if their liveness probes fail. This job is performed by the Kubelet on the node hosting the pod the Kubernetes Control Plane components running on the master(s) have no part in this process.
But if the node itself crashes, it’s the Control Plane that must create replacements for all the pods that went down with the node. It doesn’t do that for pods that you create directly. Those pods aren’t managed by anything except by the Kubelet, but because the Kubelet runs on the node itself, it can’t do anything if the node fails.
To make sure your app is restarted on another node, you need to have the pod managed by a ReplicationController or similar mechanism later on in this readme.
Introducing ReplicationControllers
A Replication Controller(RC) is a Kubernetes resource that ensures its pods are always kept running. If a pod disappers for any reasons like in case of node disappearing from the cluster or because the pod was evicted from the node, the RC notes the pod missing and creates a replacement pod. Please refer to the image below
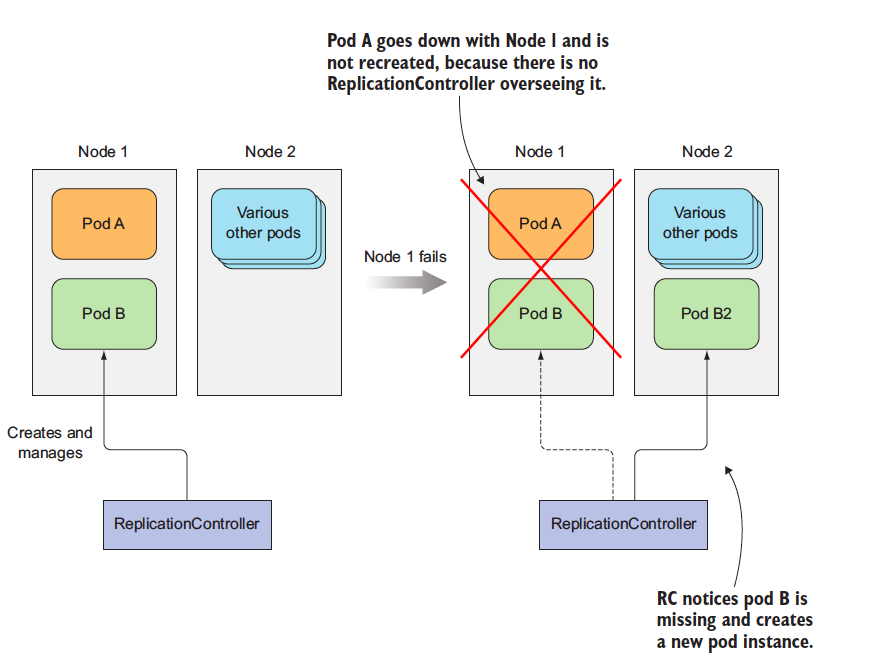
When a node fails, only pods backed by a ReplicationController are recreated.
The RC in the figure only manage only a single pod but in general they are meant to create and manage a mutiple copies (replicas) of a pod. That's where RC got their name from.
The operation of a ReplicationController
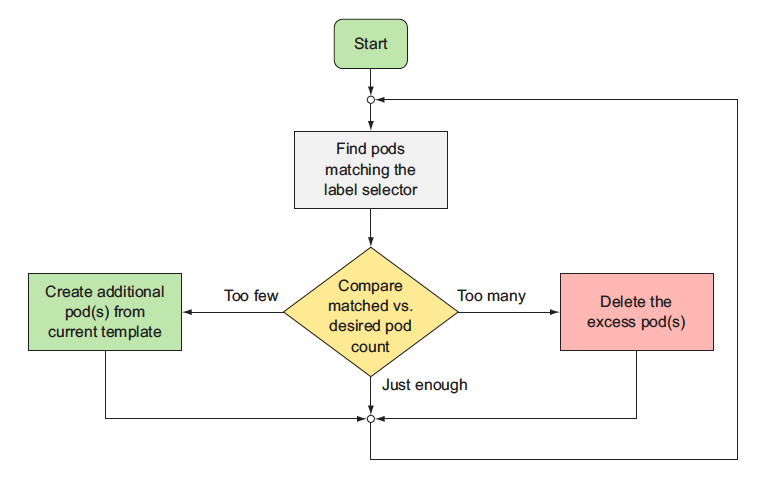
The RC contantly monitors the list of running pods and makes sure the actual number of pods of a "type" always matches the desires number. If too few such pods are running, it creates new replica from pod template. If too much pods are running, it remove the excess replicas.
You might be wondering how there can be more than the desired number of replicas. This can happen for a few reasons:
- Someone creates a pod of the same type manually.
- Someone changes an existing pod’s “type.”
- Someone decreases the desired number of pods, and so on.
I’ve used the term pod “type” a few times. But no such thing exists. Replication Controllers don’t operate on pod types, but on sets of pods that match a certain label selector, which I have told you previously.
Introducing the controller reconciliation loop
A ReplicationController’s job is to make sure that an exact number of pods always matches its label selector. If it doesn’t, the ReplicationController takes the appropriate action to reconcile the actual with the desired number.
A ReplicationController has three essential parts:
- A label selector, which determines what pods are in the ReplicationController’s scope
- A replica count, which specifies the desired number of pods that should be running
- A pod template, which is used when creating new pod replicas
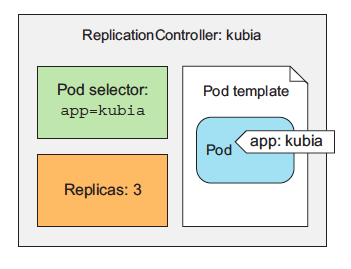
The three key parts of a ReplicationController (pod selector, replica count, and pod template)
A ReplicationController’s replica count, the label selector, and even the pod template can all be modified at any time, but only changes to the replica count affect existing pods.
Changes to the label selector and the pod template have no effect on existing pods. Changing the label selector makes the existing pods fall out of the scope of the ReplicationController, so the controller stops caring about them. ReplicationControllers also don’t care about the actual “contents” of its pods (the container images, environment variables, and other things) after they create the pod. The template therefore only affects new pods created by this ReplicationController. You can think of it as a cookie cutter for cutting out new pods.
BENEFITS
- It makes sure a pod (or multiple pod replicas) is always running by starting a new pod when an existing one goes missing.
- When a cluster node fails, it creates replacement replicas for all the pods that were running on the failed node (those that were under the Replication- Controller’s control).
- It enables easy horizontal scaling of pods—both manual and automatic
Note:- A pod instance is never relocated to another node. Instead, the ReplicationController creates a completely new pod instance that has no relation to the instance it’s replacing.
Creating a ReplicationController
You’re going to create a file called kubia-rc.yaml (you can create it in any directory you want), or copy from this repo, where you’ll find the file with filename kubia-rc.yaml. The following listing shows the entire contents of the file.
apiVersion: v1
kind: ReplicationController
metadata:
  name: kubia
spec:
  replicas: 3
  selector:
    app: kubia
  template:
    metadata:
      labels:
        app: kubia
    spec:
      containers:
      - name: kubia
        image: knrt10/kubia
        ports:
        - containerPort: 8080
When you post the file to the API server, Kubernetes creates a new ReplicationController named kubia, which makes sure three pod instances always match the label selector app=kubia. When there aren’t enough pods, new pods will be created from the provided pod template. The contents of the template are almost identical to pod defination we created before.
The pod labels in the template must obviously match the label selector of the ReplicationController; otherwise the controller would create new pods indefinitely, because spinning up a new pod wouldn’t bring the actual replica count any closer to the desired number of replicas. To prevent such scenarios, the API server verifies the ReplicationController definition and will not accept it if it’s misconfigured.
Not specifying the selector at all is also an option. In that case, it will be configured automatically from the labels in the pod template.
To create the ReplicationController, use the kubectl create command, which you already know:
kubectl create -f kubia-rc.yaml
replicationcontroller "kubia" created
Seeing the ReplicationController in action
Because no pods exist with the app=kubia label, the ReplicationController should spin up three new pods from the pod template. List the pods to see if the ReplicationController has done what it’s supposed to:
kubectl get po
NAME          READY   STATUS              RESTARTS   AGE
kubia-53thy   0/1     ContainerCreating   0          6s
kubia-k0xz6   0/1     ContainerCreating   0          6s
kubia-q3vkg   0/1     ContainerCreating   0          6s
Indeed, it has! We wanted three pods, and it created three pods. It’s now managing those three pods. Next we'll mess with them a little to see how the ReplicationController responds. Now try deleting a pod, the RC will spawn another pod automatically. The ReplicationController has done its job again. It’s a nice little helper, isn’t it?
Understanding exactly what caused the controller to create a new pod
The controller is responding to the deletion of a pod by creating a new replacement pod as we did above. Well, technically, it isn’t responding to the deletion itself, but the resulting state—the inadequate number of pods.
While a ReplicationController is immediately notified about a pod being deleted (the API server allows clients to watch for changes to resources and resource lists), that’s not what causes it to create a replacement pod. The notification triggers the controller to check the actual number of pods and take appropriate action.
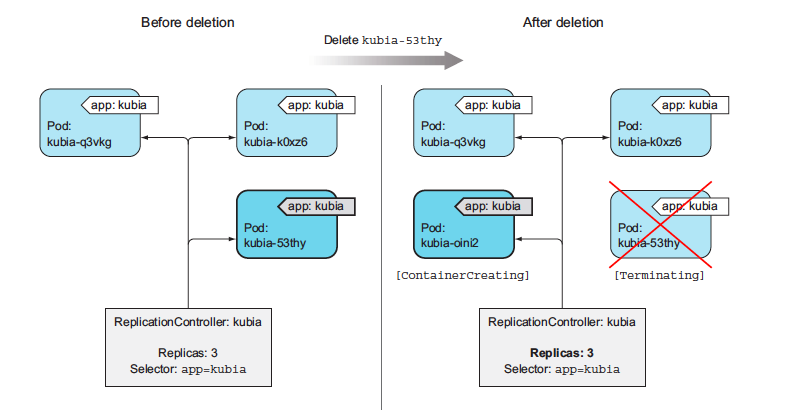
If a pod disappears, the ReplicationController sees too few pods and creates a new replacement pod.
Seeing the ReplicationController respond to the manual deletion of a pod isn’t too interesting, so let’s look at a better example. If you’re using Google Kubernetes Engine to run these examples, you have a three-node Kubernetes cluster. You’re going to disconnect one of the nodes from the network to simulate a node failure.
Note:- If you’re using Minikube, you can’t do this exercise, because you only have one node that acts both as a master and a worker node.
If a node fails in the non-Kubernetes world, the ops team would need to migrate the applications running on that node to other machines manually. Kubernetes, on the other hand, does that automatically. Soon after the ReplicationController detects that its pods are down, it will spin up new pods to replace them.
Let’s see this in action. You need to ssh into one of the nodes with the gcloud compute ssh command and then shut down its network interface with sudo ifconfig eth0 down, as shown in the following below.
gcloud compute ssh gke-kubia-default-pool-b46381f1-zwko`

Enter passphrase for key '/home/knrt10/.ssh/google_compute_engine':
Welcome to Kubernetes v1.16.2!
...
knrt10@gke-kubia-default-pool-b46381f1-zwko ~ $ sudo ifconfig eth0 downWhen you shut down the network interface, the ssh session will stop responding, so you need to open up another terminal or hard-exit from the ssh session. In the new terminal you can list the nodes to see if Kubernetes has detected that the node is down. This takes a minute or so. Then, the node’s status is shown as NotReady:
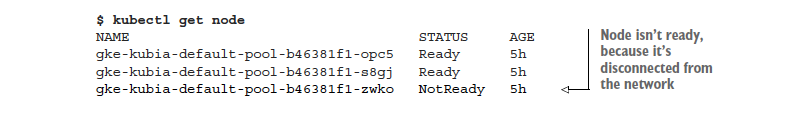
If you list the pods now, you’ll still see the same three pods as before, because Kubernetes waits a while before rescheduling pods (in case the node is unreachable because of a temporary network glitch or because the Kubelet is restarting). If the node stays unreachable for several minutes, the status of the pods that were scheduled to that node changes to Unknown. At that point, the ReplicationController will immediately spin up a new pod. You can see this by listing the pods again:
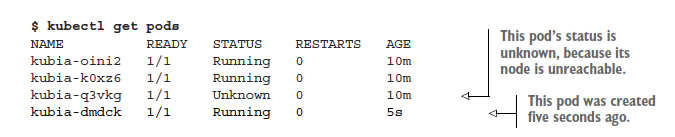
Looking at the age of the pods, you see that the kubia-dmdck pod is new. You again have three pod instances running, which means the ReplicationController has again done its job of bringing the actual state of the system to the desired state.
The same thing happens if a node fails (either breaks down or becomes unreachable). No immediate human intervention is necessary. The system heals itself automatically. To bring the node back, you need to reset it with the following command:
gcloud compute instances reset gke-kubia-default-pool-b46381f1-zwko
When the node boots up again, its status should return to Ready, and the pod whose status was Unknown will be deleted.
Moving pods in and out of the scope of a ReplicationController
Pods created by a ReplicationController aren’t tied to the ReplicationController in any way. At any moment, a ReplicationController manages pods that match its label selector. By changing a pod’s labels, it can be removed from or added to the scope of a ReplicationController. It can even be moved from one ReplicationController to another.
TIP:- Although a pod isn’t tied to a ReplicationController, the pod does reference it in the metadata.ownerReferences field, which you can use to easily find which ReplicationController a pod belongs to.
If you change a pod’s labels so they no longer match a ReplicationController’s label selector, the pod becomes like any other manually created pod. It’s no longer managed by anything. If the node running the pod fails, the pod is obviously not rescheduled. But keep in mind that when you changed the pod’s labels, the replication controller noticed one pod was missing and spun up a new pod to replace it.
kubectl label po kubia-dmdck app=kubia2 --overwrite
The --overwrite argument is necessary; otherwise kubectl will only print out a warning and won’t change the label, to prevent you from inadvertently changing an existing label’s value when your intent is to add a new one. There, you now have four pods altogether: one that isn’t managed by your ReplicationController and three that are. Among them is the newly created pod.
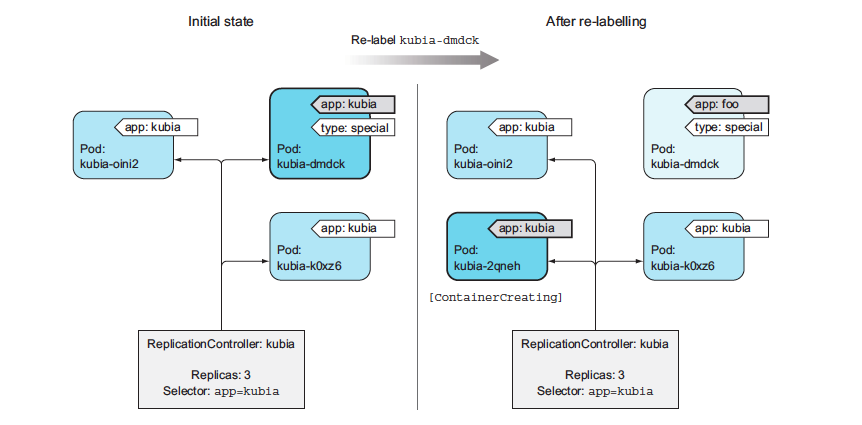
Removing a pod from the scope of a ReplicationController by changing its labels
ReplicationController spins up pod kubia-2qneh to bring the number back up to three. Pod kubia-dmdck is now completely independent and will keep running until you delete it manually (you can do that now, because you don’t need it anymore).
REMOVING PODS FROM CONTROLLERS IN PRACTICE
Removing a pod from the scope of the ReplicationController comes in handy when you want to perform actions on a specific pod. For example, you might have a bug that causes your pod to start behaving badly after a specific amount of time or a specific event. If you know a pod is malfunctioning, you can take it out of the ReplicationController’s scope, let the controller replace it with a new one, and then debug or play with the pod in any way you want. Once you’re done, you delete the pod.
Changing the pod template
A ReplicationController’s pod template can be modified at any time. Changing the pod template is like replacing a cookie cutter with another one. It will only affect the cookies you cut out afterward and will have no effect on the ones you’ve already cut (see figure below). To modify the old pods, you’d need to delete them and let the Replication- Controller replace them with new ones based on the new template.
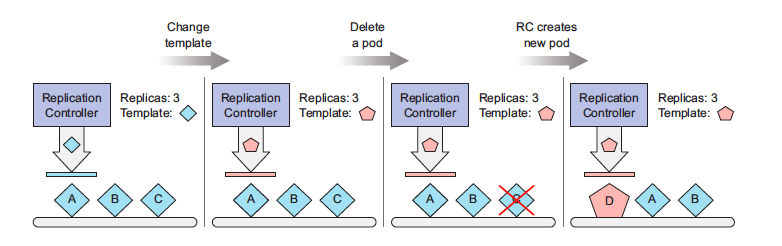
Changing a ReplicationController’s pod template only affects pods created afterward and has no effect on existing pods.
As an exercise, you can try editing the ReplicationController and adding a label to the pod template. You can edit the ReplicationController with the following command:
kubectl edit rc kubia
This will open the ReplicationController’s YAML definition in your default text editor. Find the pod template section and add an additional label to the metadata. After you save your changes and exit the editor, kubectl will update the ReplicationController and print the following message:
replicationcontroller "kubia" edited
You can now list pods and their labels again and confirm that they haven’t changed. But if you delete the pods and wait for their replacements to be created, you’ll see the new label.
Editing a ReplicationController like this to change the container image in the pod template, deleting the existing pods, and letting them be replaced with new ones from the new template could be used for upgrading pods, but you’ll learn a better way of doing it later.
Horizontally scaling pods
Scaling the number of pods up or down is as easy as changing the value of the replicas field in the ReplicationController resource. After the change, the ReplicationController will either see too many pods exist (when scaling down) and delete part of them, or see too few of them (when scaling up) and create additional pods. You already know the command below
kubectl scale rc kubia --replicas=10
but instead of using the kubectl scale command, you’re going to scale it in a declarative way by editing the ReplicationController’s definition:
kubectl edit rc kubia
When the text editor opens, find the spec.replicas field and change its value to 10. Now check your listing.
kubectl get rc

NAME DESIRED CURRENT READY AGE
kubia 10      10      4     21m
Now scale back down to 3. You can use the kubectl scale command:
kubectl scale rc kubia --replicas=3
Horizontally scaling pods in Kubernetes is a matter of stating your desire: "I want to have x number of instances running." You’re not telling Kubernetes what or how to do it. You’re just specifying the desired state.
This declarative approach makes interacting with a Kubernetes cluster easy. Imagine if you had to manually determine the current number of running instances and then explicitly tell Kubernetes how many additional instances to run. That’s more work and is much more error-prone. Changing a simple number is much easier and later, you’ll learn that even that can be done by Kubernetes itself if you enable horizontal pod auto-scaling.
Deleting a ReplicationController
When you delete a ReplicationController through kubectl delete, the pods are also deleted. But because pods created by a ReplicationController aren’t an integral part of the ReplicationController, and are only managed by it, you can delete only the ReplicationController and leave the pods running, as shown below
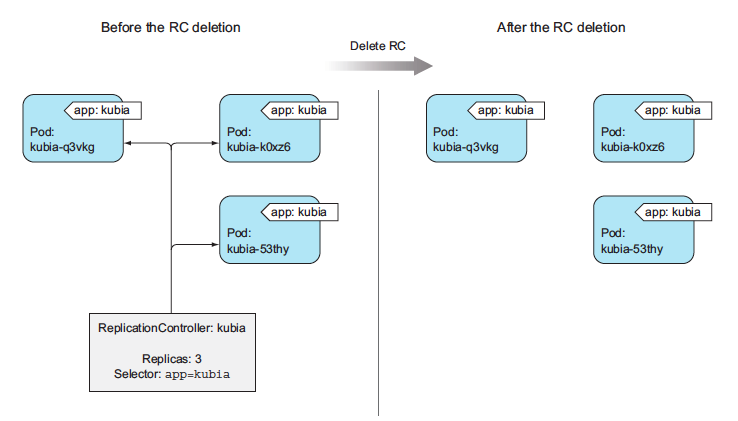
This may be useful when you initially have a set of pods managed by a ReplicationController, and then decide to replace the ReplicationController with a ReplicaSet. You can do this without affecting the pods and keep them running without interruption while you replace the ReplicationController that manages them.
When deleting a ReplicationController with kubectl delete, you can keep its pods running by passing the --cascade=orphan option to the command. Try that now:
kubectl delete rc kubia --cascade=orphan
You’ve deleted the ReplicationController so the pods are on their own. They are no longer managed. But you can always create a new ReplicationController with the proper label selector and make them managed again.
Using ReplicaSets instead of ReplicationControllers
Initially, ReplicationControllers were the only Kubernetes component for replicating pods and rescheduling them when nodes failed. Later, a similar resource called a ReplicaSet was introduced. It’s a new generation of ReplicationController and replaces it completely (ReplicationControllers will eventually be deprecated).
We could have started this section by creating a ReplicaSet instead of a ReplicationController, but I felt it would be a good idea to start with what was initially available in Kubernetes (Please Don't report me
A ReplicaSet behaves exactly like a ReplicationController, but it has more expressive pod selectors. Whereas a ReplicationController’s label selector only allows matching pods that include a certain label, a ReplicaSet’s selector also allows matching pods that lack a certain label or pods that include a certain label key, regardless of its value.
Also, for example, a single ReplicationController can’t match pods with the label env=production and those with the label env=devel at the same time. It can only match either pods with the env=production label or pods with the env=devel label. But a single ReplicaSet can match both sets of pods and treat them as a single group.
Similarly, a ReplicationController can’t match pods based merely on the presence of a label key, regardless of its value, whereas a ReplicaSet can. For example, a ReplicaSet can match all pods that include a label with the key env, whatever its actual value is(you can think of it as env=*).
Defining a ReplicaSet
You’re going to create a ReplicaSet now to see how the orphaned pods that were created by your ReplicationController and then abandoned earlier can now be adopted by a ReplicaSet.
You’re going to create a file called kubia-replicaset.yaml (you can create it in any directory you want), or copy from this repo, where you’ll find the file with filename kubia-replicaset.yaml. The following listing shows the entire contents of the file.
apiVersion: apps/v1
kind: ReplicaSet
metadata:
  name: kubia
spec:
  replicas: 3
  selector:
    matchLabels:
      app: kubia
  template:
    metadata:
      labels:
        app: kubia
    spec:
      containers:
      - name: kubia
        image: knrt10/kubia
        ports:
        - containerPort: 8080
The first thing to note is that ReplicaSets aren’t part of the v1 API, so you need to ensure you specify the proper apiVersion when creating the resource. You’re creating a resource of type ReplicaSet which has much the same contents as the ReplicationController you created earlier.
The only difference is in the selector. Instead of listing labels the pods need to have directly under the selector property, you’re specifying them under selector matchLabels. This is the simpler (and less expressive) way of defining label selectors in a ReplicaSet. Because you still have three pods matching the app=kubia selector running from earlier, creating this ReplicaSet will not cause any new pods to be created. The ReplicaSet will take those existing three pods under its wing. You can create ReplicaSet using kubectl create command. Then examine using kubectl describe command.
As you can see, the ReplicaSet isn’t any different from a ReplicationController. It’s showing it has three replicas matching the selector. If you list all the pods, you’ll see they’re still the same three pods you had before. The ReplicaSet didn’t create any new ones.
Using the ReplicaSets more expressive label selectors
The main improvements of ReplicaSets over ReplicationControllers are their more expressive label selectors. You intentionally used the simpler matchLabels selector in the first ReplicaSet example to see that ReplicaSets are no different from ReplicationControllers.
You can add additional expressions to the selector. As in the example, each expression must contain a key, an operator, and possibly (depending on the operator) a list of values. You’ll see four valid operators:
In—Label’s value must match one of the specified values.NotIn—Label’s value must not match any of the specified values.Exists—Pod must include a label with the specified key (the value isn’t important). When using this operator, you shouldn’t specify the values field.DoesNotExist—Pod must not include a label with the specified key. The values property must not be specified.
If you specify multiple expressions, all those expressions must evaluate to true for the selector to match a pod. If you specify both matchLabels and matchExpressions, all the labels must match and all the expressions must evaluate to true for the pod to match the selector.
This was a quick introduction to ReplicaSets as an alternative to ReplicationControllers. Remember, always use them instead of ReplicationControllers, but you may still find ReplicationControllers in other people’s deployments.
Now, delete the ReplicaSet to clean up your cluster a little. You can delete the ReplicaSet the same way you’d delete a ReplicationController:
kubectl delete rs kubia
replicaset "kubia" deleted
Deleting the ReplicaSet should delete all the pods. List the pods to confirm that’s the case.
Running exactly one pod on each node with DaemonSets
Both RC and RS are used for running specifics number of pods deployed anywhere in Kubernetes cluster. But certain cases exist when you want a pod to run on each and every node in the cluster (and each node needs to run exactly one instance of the pod). Those cases include infrastructure related pods that perform system-level operations.
For example, you’ll want to run a log collector and a resource monitor on every node. Another good example is Kubernetes’ own kube-proxy process, which needs to run on all nodes to make services work.
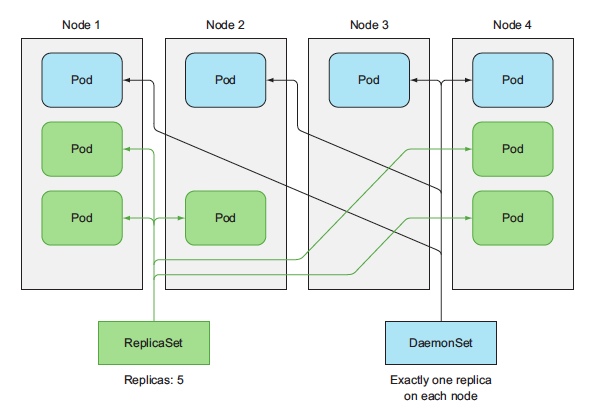
DaemonSets run only a single pod replica on each node, whereas ReplicaSets scatter them around the whole cluster randomly.
Using a DaemonSet to run a pod on every node
To run a pod on all cluster nodes, you create a DaemonSet object, which is much like a ReplicationController or a ReplicaSet, except that pods created by a DaemonSet already have a target node specified and skip the Kubernetes Scheduler. They aren’t scattered around the cluster randomly.
A DaemonSet makes sure it creates as many pods as there are nodes and deploys each one on its own node, as shown above. Whereas a ReplicaSet (or ReplicationController) makes sure that a desired number of pod replicas exist in the cluster, a DaemonSet doesn’t have any notion of a desired replica count. It doesn’t need it because its job is to ensure that a pod matching its pod selector is running on each node.
If a node goes down, the DaemonSet doesn’t cause the pod to be created elsewhere. But when a new node is added to the cluster, the DaemonSet immediately deploys a new pod instance to it. It also does the same if someone inadvertently deletes one of the pods, leaving the node without the DaemonSet’s pod. Like a ReplicaSet, a DaemonSet creates the pod from the pod template configured in it.
Explaning Daemon sets with an example
Let’s imagine having a daemon called ssd-monitor that needs to run on all nodes that contain a solid-state drive (SSD). You’ll create a DaemonSet that runs this daemon on all nodes that are marked as having an SSD. The cluster administrators have added the disk=ssd label to all such nodes, so you’ll create the DaemonSet with a node selector that only selects nodes with that label,
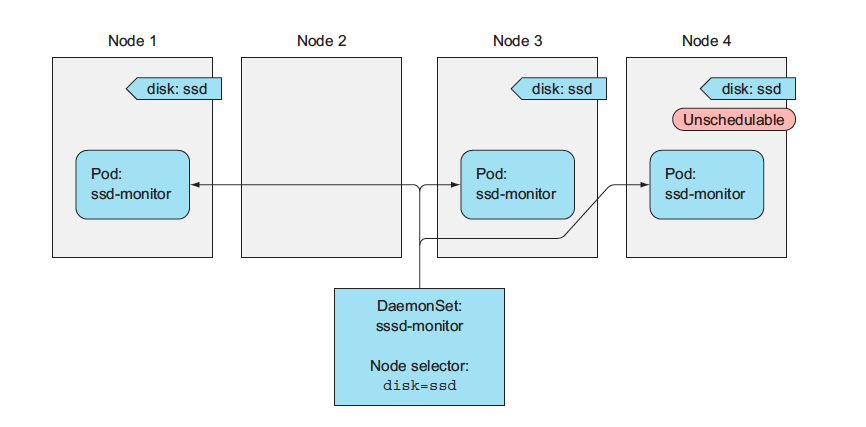
You’ll create a DaemonSet that runs a mock ssd-monitor process, which prints "SSD OK" to the standard output every five seconds. I’ve already prepared the mock container image and pushed it to Docker Hub, so you can use it instead of building your own.
You’re going to create a file called ssd-monitor-daemonset.yaml (you can create it in any directory you want), or copy from this repo, where you’ll find the file with filename ssd-monitor-daemonset.yaml. The following listing shows the entire contents of the file.
apiVersion: apps/v1
kind: DaemonSet
metadata:
  name: ssd-monitor
spec:
  selector:
    matchLabels:
      app: ssd-monitor
  template:
    metadata:
      labels:
        app: ssd-monitor
    spec:
      nodeSelector:
        disk: ssd
      containers:
      - name: main
        image: knrt10/ssd-monitor
You’re defining a DaemonSet that will run a pod with a single container based on the knrt10/ssd-monitor container image. An instance of this pod will be created for each node that has the disk=ssd label.
Creating the DaemonSet
Use kubectl create command as you know.
kubectl create -f ssd-monitor-daemonset.yaml
Let’s see the created DaemonSet:
kubectl get ds
NAME          DESIRED   CURRENT   READY   UP-TO-DATE   AVAILABLE   NODE SELECTOR   AGE
ssd-monitor   0         0         0       0            0           disk=ssd        18s
Those zeroes look strange. Didn’t the DaemonSet deploy any pods? List the pods:
kubectl get po
No resources found.
Where are the pods? Do you know what’s going on? Yes, you forgot to label your nodes with the disk=ssd label. No problem—you can do that now. The DaemonSet should detect that the nodes’ labels have changed and deploy the pod to all nodes with a matching label. Let’s see if that’s true. The DaemonSet should have created one pod now. Let’s see:
kubectl label node minikube disk=ssd
NAME                READY   STATUS    RESTARTS   AGE
ssd-monitor-zs6sr   1/1     Running   0          6s
Okay; so far so good. If you have multiple nodes and you add the same label to further nodes, you’ll see the DaemonSet spin up pods for each of them. Now, imagine you’ve made a mistake and have mislabeled one of the nodes. It has a spinning disk drive, not an SSD. What happens if you change the node’s label?
The pod is being terminated. But you knew that was going to happen, right? This wraps up your exploration of DaemonSets, so you may want to delete your ssd-monitor DaemonSet. If you still have any other daemon pods running, you’ll see that deleting the DaemonSet deletes those pods as well.
Running Pod that perform a single completable task
So far, I have told about the pods that run continuously. We'll have cases that need to terminate once the task is completed. ReplicationContollers, RelicaSets, DaemonSets run continuously task that are never considered completed. Process in these tasks are restarted when they exit, but we do not want that. We want to stop once the process is completed.
Introducing the Job resource
Kubernetes includes support for this through Job resource, which is similar to other resources we have discussed so far, but it allows you to run a pod whose container isn’t restarted when the process running inside finishes successfully. Once it does, the pod is considered complete.
In the event of node failure, pod on that node that are managed by the Job will be reschduled to other nodes the way ReplicaSets are. In the event of a failure of the process itself (when the process returns an error exit code), the Job can be configured to either restart the container or not.
As shown below, it tells how a pod created by a Job is rescheduled to a new node if the node it was initially scheduled to fails. It also shows both a managed pod, which isn’t rescheduled, and a pod backed by a ReplicaSet, which is.
For example, Jobs are useful for ad hoc tasks, where it’s crucial that the task finishes properly. You could run the task in an unmanaged pod and wait for it to finish, but in the event of a node failing or the pod being evicted from the node while it is performing its task, you’d need to manually recreate it. Doing this manually doesn’t make sense especially if the job takes hours to complete.
An example of such a job would be if you had data stored somewhere and you needed to transform and export it somewhere. You’re going to emulate this by running a container image built on top of the busybox image, which invokes the sleep command for two minutes. I’ve already built the image and pushed it to Docker Hub, but you can peek into its Dockerfile in the book’s code archive.
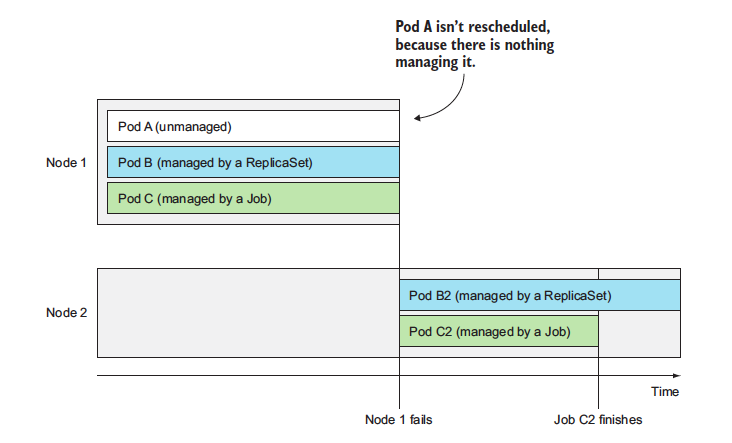
Pods managed by Jobs are rescheduled until they finish successfully.
Defining a Job resource
Create the Job manifest as in the following listing. You’re going to create a file called exporter.yaml (you can create it in any directory you want), or copy from this repo, where you’ll find the file with filename exporter.yaml. The following listing shows the entire contents of the file.
apiVersion: batch/v1
kind: Job
metadata:
  name: batch-job
spec:
  template:
    metadata:
      labels:
        app: batch-job
    spec:
      restartPolicy: OnFailure
      containers:
      - name: main
        image: knrt10/batch-job
Jobs are part of the batch API group and v1 API version. The YAML defines a resource of type Job that will run the knrt10/batch-job image, which invokes a process that runs for exactly 120 seconds and then exits. The image is already been pushed on dockerhub by me.
In a pod’s specification, you can specify what Kubernetes should do when the processes running in the container finish. This is done through the restartPolicy pod spec property, which defaults to Always. Job pods can’t use the default policy, because they’re not meant to run indefinitely. Therefore, you need to explicitly set the restart policy to either OnFailure or Never. This setting is what prevents the container from being restarted when it finishes (not the fact that the pod is being managed by a Job resource).
Seeing a Job run a pod
After you create this Job with the kubectl create command, you should see it start up
a pod immediately:
kubectl get jobs
NAME      DESIRED   SUCCESSFUL  AGE
batch-job 1         0           2s
Todo
- Write more about pods
- Write about yaml files
- Write about ingress routing
- Write about volumes
- Write about config maps and secrets
- Write more on updating running pods
- Write about StatefulSets
- More on securing pods and containers
- Implement && write about GCP