cphyc / Matplotlib Label Lines
Licence: mit
Label line using matplotlib.
Stars: ✭ 154
Labels
Projects that are alternatives of or similar to Matplotlib Label Lines
Ipynb Quicklook
A Quick Look generator for Jupyter/IPython notebooks without further dependencies
Stars: ✭ 152 (-1.3%)
Mutual labels: jupyter-notebook
Mastering Python For Finance Second Edition
Mastering Python for Finance – Second Edition, published by Packt
Stars: ✭ 153 (-0.65%)
Mutual labels: jupyter-notebook
Data Science Stack Cookiecutter
🐳📊🤓Cookiecutter template to launch an awesome dockerized Data Science toolstack (incl. Jupyster, Superset, Postgres, Minio, AirFlow & API Star)
Stars: ✭ 153 (-0.65%)
Mutual labels: jupyter-notebook
Hdbscan
A high performance implementation of HDBSCAN clustering.
Stars: ✭ 2,032 (+1219.48%)
Mutual labels: jupyter-notebook
Self Learning
Books Papers, Courses & more I have to learn soon
Stars: ✭ 146 (-5.19%)
Mutual labels: jupyter-notebook
Raster Vision Examples
Examples of using Raster Vision on open datasets
Stars: ✭ 154 (+0%)
Mutual labels: jupyter-notebook
Tensorflow Multi Dimensional Lstm
Multi dimensional LSTM as described in Alex Graves' Paper https://arxiv.org/pdf/0705.2011.pdf
Stars: ✭ 154 (+0%)
Mutual labels: jupyter-notebook
Python For Probability Statistics And Machine Learning 2e
Second edition of Springer Book Python for Probability, Statistics, and Machine Learning
Stars: ✭ 154 (+0%)
Mutual labels: jupyter-notebook
Automatic Generation Of Text Summaries
使用两种方法(抽取式Textrank和概要式seq2seq)自动提取文本摘要
Stars: ✭ 155 (+0.65%)
Mutual labels: jupyter-notebook
Natural Language Processing Specialization
This repo contains my coursework, assignments, and Slides for Natural Language Processing Specialization by deeplearning.ai on Coursera
Stars: ✭ 151 (-1.95%)
Mutual labels: jupyter-notebook
Hamiltorch
PyTorch-based library for Riemannian Manifold Hamiltonian Monte Carlo (RMHMC) and inference in Bayesian neural networks
Stars: ✭ 153 (-0.65%)
Mutual labels: jupyter-notebook
Python Data Visualization Course
Course materials for teaching data visualization in Python.
Stars: ✭ 153 (-0.65%)
Mutual labels: jupyter-notebook
Example Seldon
Example for end-to-end machine learning on Kubernetes using Kubeflow and Seldon Core
Stars: ✭ 154 (+0%)
Mutual labels: jupyter-notebook
Oreilly Intro To Predictive Clv
Repo that contains the supporting material for O'Reilly Webinar "An Intro to Predictive Modeling for Customer Lifetime Value" on Feb 28, 2017
Stars: ✭ 153 (-0.65%)
Mutual labels: jupyter-notebook
Robuststl
Unofficial Implementation of RobustSTL: A Robust Seasonal-Trend Decomposition Algorithm for Long Time Series (AAAI 2019)
Stars: ✭ 154 (+0%)
Mutual labels: jupyter-notebook
Deep Viz Keras
Implementations of some popular Saliency Maps in Keras
Stars: ✭ 154 (+0%)
Mutual labels: jupyter-notebook
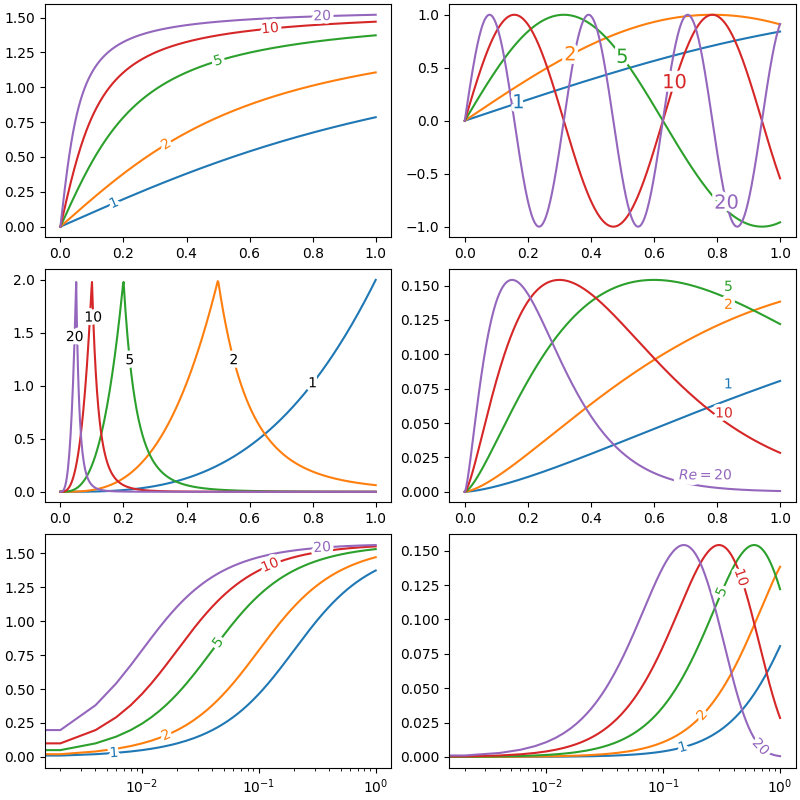
matplotlib-label-lines

![]()
Easily label line(s) using matplotlib.
The code is heavily based on http://stackoverflow.com/questions/16992038/inline-labels-in-matplotlib (original code from NauticalMile).
Install
Just do:
pip install matplotlib-label-lines
You can try it online on binder ![]() , get some inspiration from the example or from the following script:
, get some inspiration from the example or from the following script:
import numpy as np
from matplotlib import pyplot as plt
from scipy.stats import chi2, loglaplace

from labellines import labelLine, labelLines

X = np.linspace(0, 1, 500)
A = [1, 2, 5, 10, 20]
funcs = [np.arctan, np.sin, loglaplace(4).pdf, chi2(5).pdf]

plt.subplot(321)
for a in A:
    plt.plot(X, np.arctan(a * X), label=str(a))

labelLines(plt.gca().get_lines(), zorder=2.5)

plt.subplot(322)
for a in A:
    plt.plot(X, np.sin(a * X), label=str(a))

labelLines(plt.gca().get_lines(), align=False, fontsize=14)

plt.subplot(323)
for a in A:
    plt.plot(X, loglaplace(4).pdf(a * X), label=str(a))

xvals = [0.8, 0.55, 0.22, 0.104, 0.045]
labelLines(plt.gca().get_lines(), align=False, xvals=xvals, color="k")

plt.subplot(324)
for a in A:
    plt.plot(X, chi2(5).pdf(a * X), label=str(a))

lines = plt.gca().get_lines()
l1 = lines[-1]
labelLine(
    l1,
    0.6,
    label=r"$Re=${}".format(l1.get_label()),
    ha="left",
    va="bottom",
    align=False,
    backgroundcolor='none'
)
labelLines(lines[:-1], yoffsets=0.01, align=False, backgroundcolor='none')

# labelLines also supports log-scaled x-axes
plt.subplot(325)
for a in A:
    plt.semilogx(X, np.arctan(5 * a * X), label=str(a))

labelLines(plt.gca().get_lines(), zorder=2.5)

plt.subplot(326)
for a in A:
    plt.semilogx(X, chi2(5).pdf(a * X), label=str(a))

labelLines(plt.gca().get_lines(), xvals=(0.1, 1), zorder=2.5)

plt.show()
Note that the project description data, including the texts, logos, images, and/or trademarks,
for each open source project belongs to its rightful owner.
If you wish to add or remove any projects, please contact us at [email protected].