All Projects → chvvkumar → Monitoring

chvvkumar / Monitoring

Licence: gpl-3.0
Monitor ESXi, Synology, Docker, PiHole and Raspberry Pi and Windows using Grafana, InfluxDB and Telegraf

Programming Languages

python
139335 projects - #7 most used programming language

Projects that are alternatives of or similar to Monitoring

Pi Hole Influx
A python daemon to send Pi-Hole stats for Grafana to InfluxDB
Stars: ✭ 126 (-74.44%)
Mutual labels:  pi-hole, influxdb, grafana
Solarthing
Monitors an Outback MATE and a Renogy Rover - MPPT Charge Controller. Integrates with Grafana, PVOutput and more!
Stars: ✭ 33 (-93.31%)
Mutual labels:  influxdb, raspberry-pi, grafana
Pi Hole Monitoring
Monitoring Pi-Hole statistics with Grafana
Stars: ✭ 196 (-60.24%)
Mutual labels:  pi-hole, influxdb, grafana
Iotstack
docker stack for getting started on IOT on the Raspberry PI
Stars: ✭ 1,383 (+180.53%)
Mutual labels:  influxdb, raspberry-pi, grafana
docker-telegraf-influxdb-grafana
Docker Image with Telegraf, InfluxDB and Grafana
Stars: ✭ 17 (-96.55%)
Mutual labels:  influxdb, grafana, synology
yanic
Yet another node info collector - for respondd to be used with meshviewer to Grafana (with influxdb or graphite)
Stars: ✭ 22 (-95.54%)
Mutual labels:  influxdb, grafana
MinerDashboards
Metric scrapers, InfluxDB queries, and Grafana dashboards for crypto miners. (XMRig, XMRig-proxy, GMiner, MoneroOcean, Belkin WeMo, Telegraf, CoreTemp, CoinMarketCap, Monero Wallet RCP)
Stars: ✭ 13 (-97.36%)
Mutual labels:  influxdb, grafana
My Pihole Blocklists
Create custom pi-hole blocklists
Stars: ✭ 269 (-45.44%)
Mutual labels:  pi-hole, raspberry-pi
Flutterhole
A third party Android application for the Pi-Hole® dashboard.
Stars: ✭ 292 (-40.77%)
Mutual labels:  pi-hole, raspberry-pi
synology-pihole
Install or Update Pi-Hole as Docker Container on a Synology NAS with a Static IP Address
Stars: ✭ 22 (-95.54%)
Mutual labels:  pi-hole, synology
Performance Testing Framework
Framework allows to perform load testing with Apache Jmeter, view application/server metrics in real-time with Grafana, analyze errors cause with detailed traces for failed requests, compare different test runs in scripted dashboard and perform frontend performance testing with sitespeed.io+webpagetest
Stars: ✭ 275 (-44.22%)
Mutual labels:  influxdb, grafana
Pi Hole Unbound Wireguard
Turning your Raspberry Pi into an ad-blocking VPN with built-in DNS resolution using Pi-Hole, Unbound & WireGuard.
Stars: ✭ 302 (-38.74%)
Mutual labels:  pi-hole, raspberry-pi
dockerized
🐳 Build once, run anywhere
Stars: ✭ 70 (-85.8%)
Mutual labels:  grafana, pi-hole
luftdatenpumpe
Process live and historical data from luftdaten.info, IRCELINE and OpenAQ. Filter by station-id, sensor-id and sensor-type, apply reverse geocoding, store into timeseries and RDBMS databases, publish to MQTT, output as JSON or visualize in Grafana.
Stars: ✭ 22 (-95.54%)
Mutual labels:  influxdb, grafana
Questdb
An open source SQL database designed to process time series data, faster
Stars: ✭ 7,544 (+1430.22%)
Mutual labels:  grafana, influxdb
cv4pve-metrics
Metrics for Proxmox VE, Grafana with dasboard, InfluxDb
Stars: ✭ 38 (-92.29%)
Mutual labels:  influxdb, grafana
Hastic Server
Hastic data management server for analyzing patterns and anomalies from Grafana
Stars: ✭ 292 (-40.77%)
Mutual labels:  influxdb, grafana
Awesome Monitoring
INFRASTRUCTURE、OPERATION SYSTEM and APPLICATION monitoring tools for Operations.
Stars: ✭ 356 (-27.79%)
Mutual labels:  influxdb, grafana
Docker Statsd Influxdb Grafana
Docker Image with Telegraf (StatsD), InfluxDB and Grafana
Stars: ✭ 352 (-28.6%)
Mutual labels:  influxdb, grafana
Wizzy
Manage & automate Grafana with easy wizzy
Stars: ✭ 461 (-6.49%)
Mutual labels:  influxdb, grafana

Monitor ESXi, Synology, Docker, PiHole, Plex and Raspberry Pi and Windows using Grafana, InfluxDB and Telegraf

Demo

https://grafana.challa.co

Screenshots:

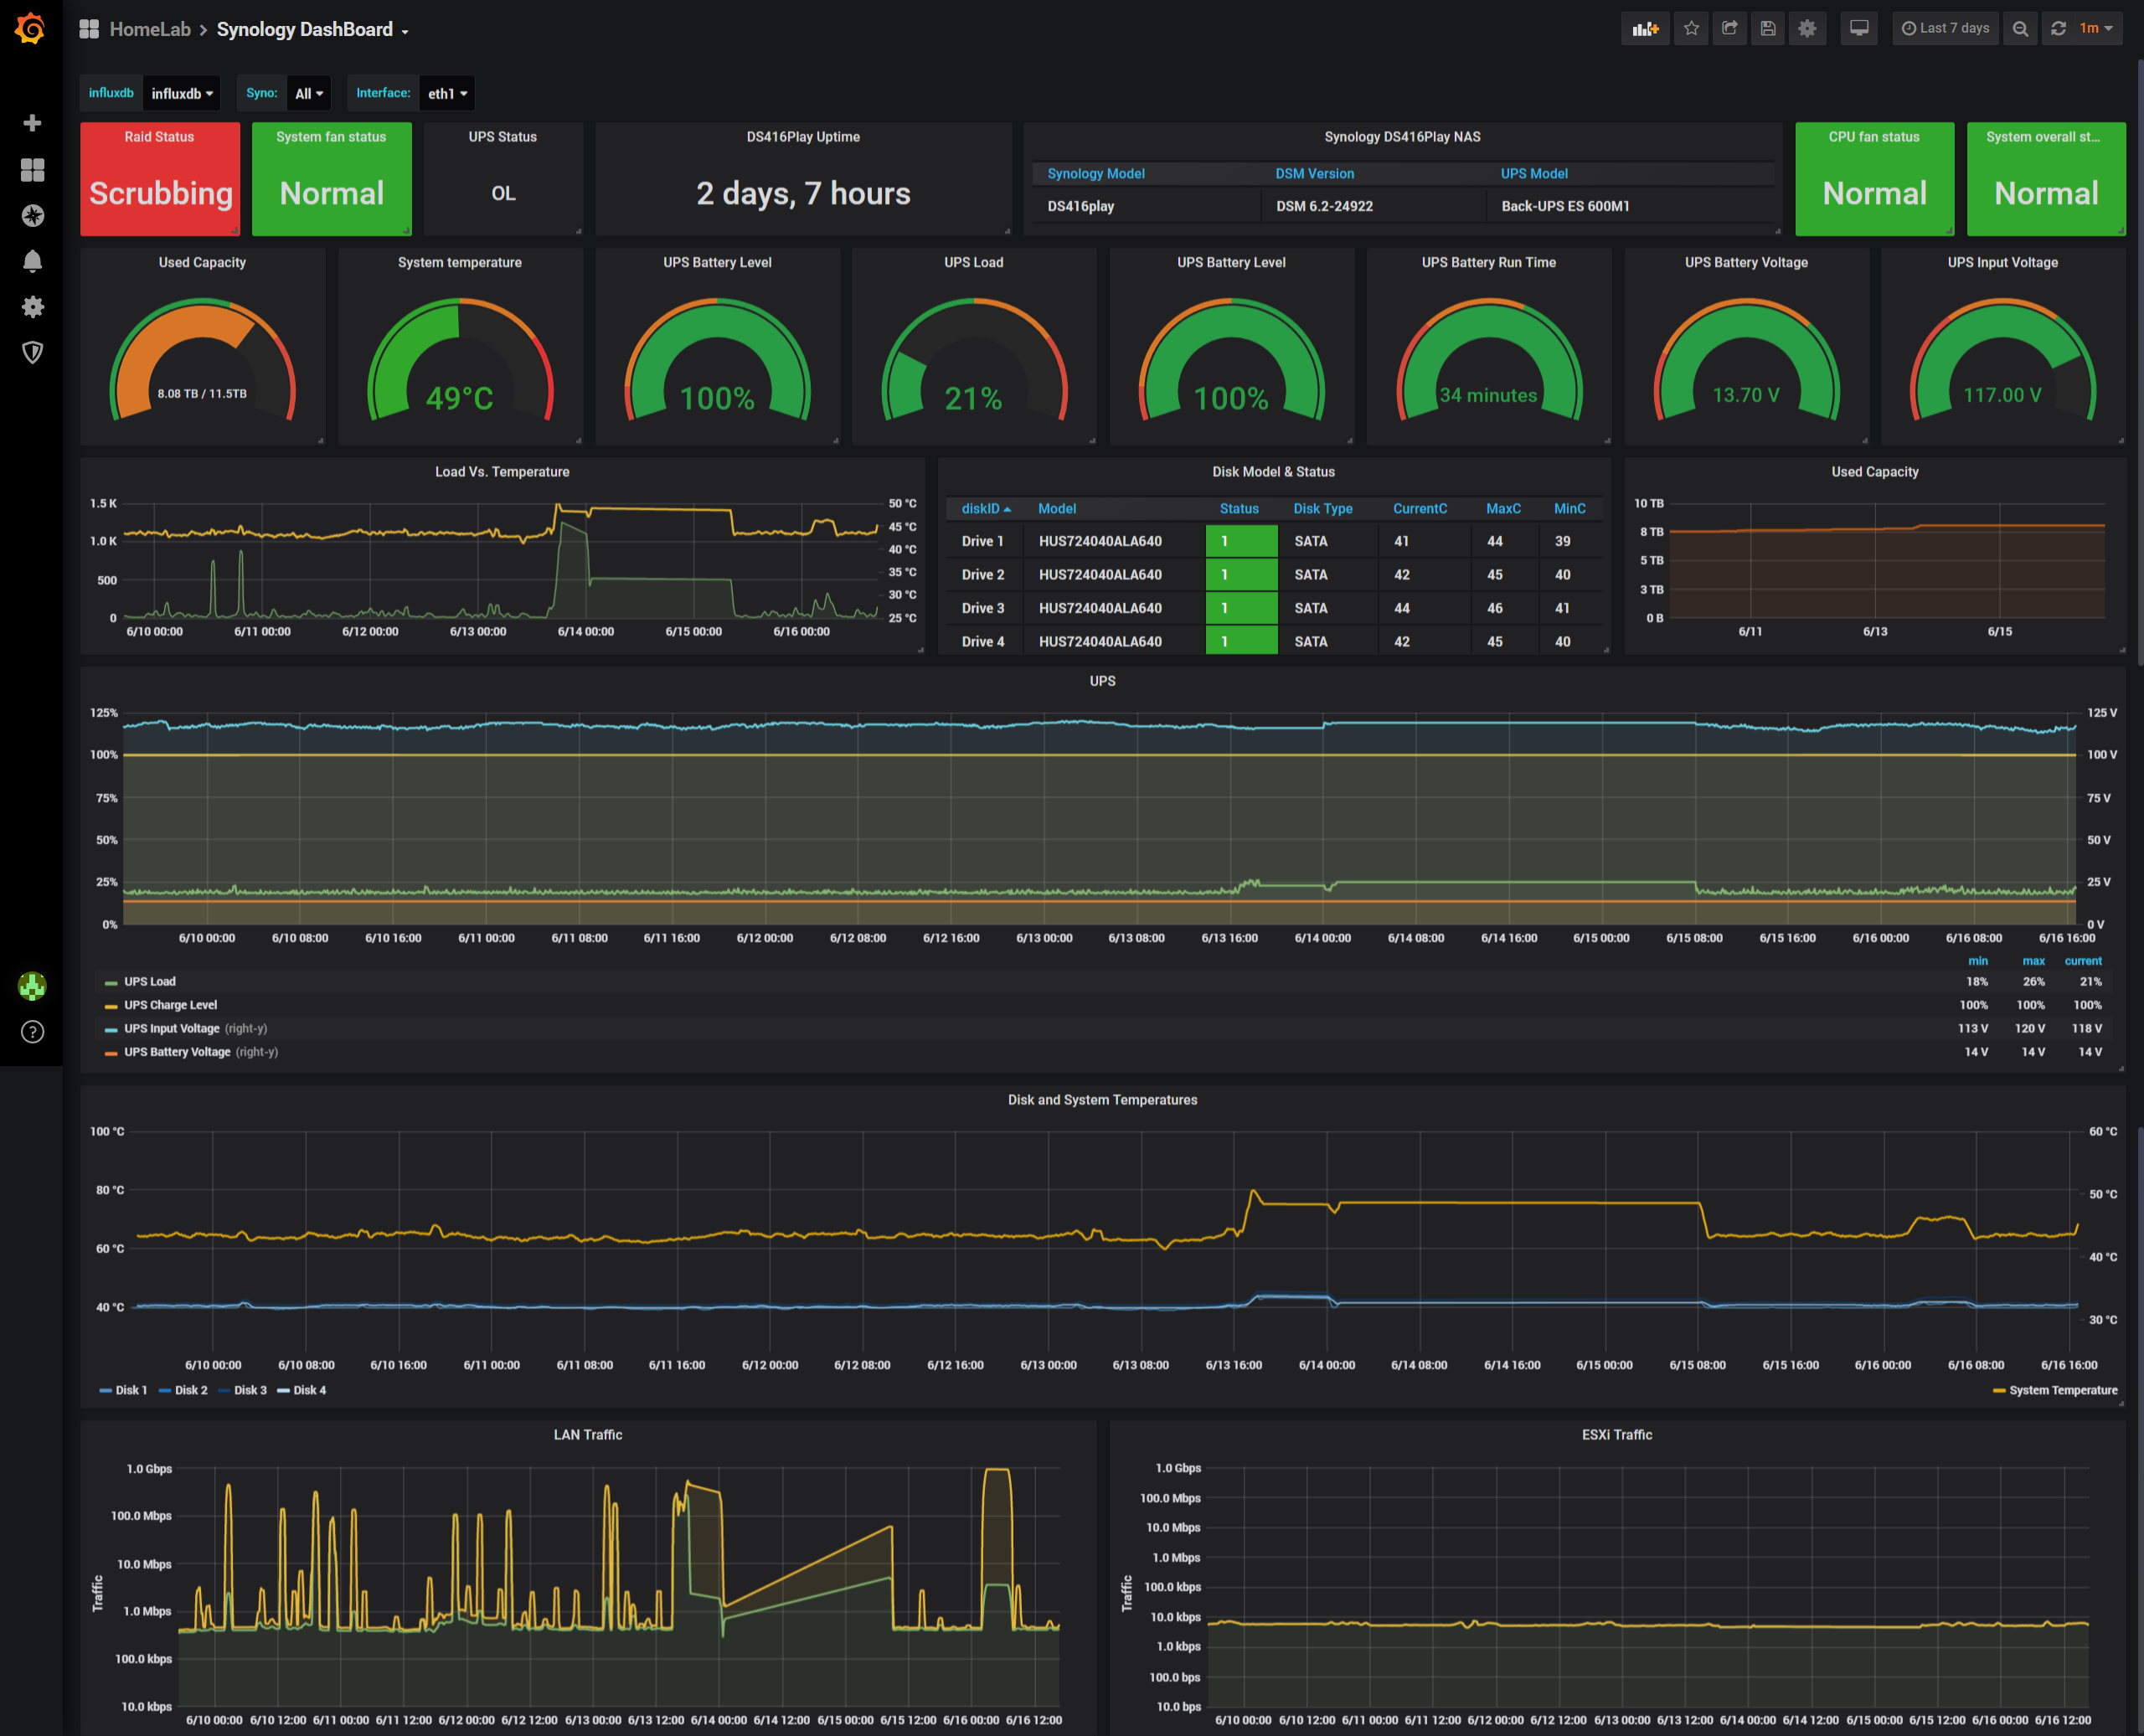
Synology Dashboard Synology Dashboard

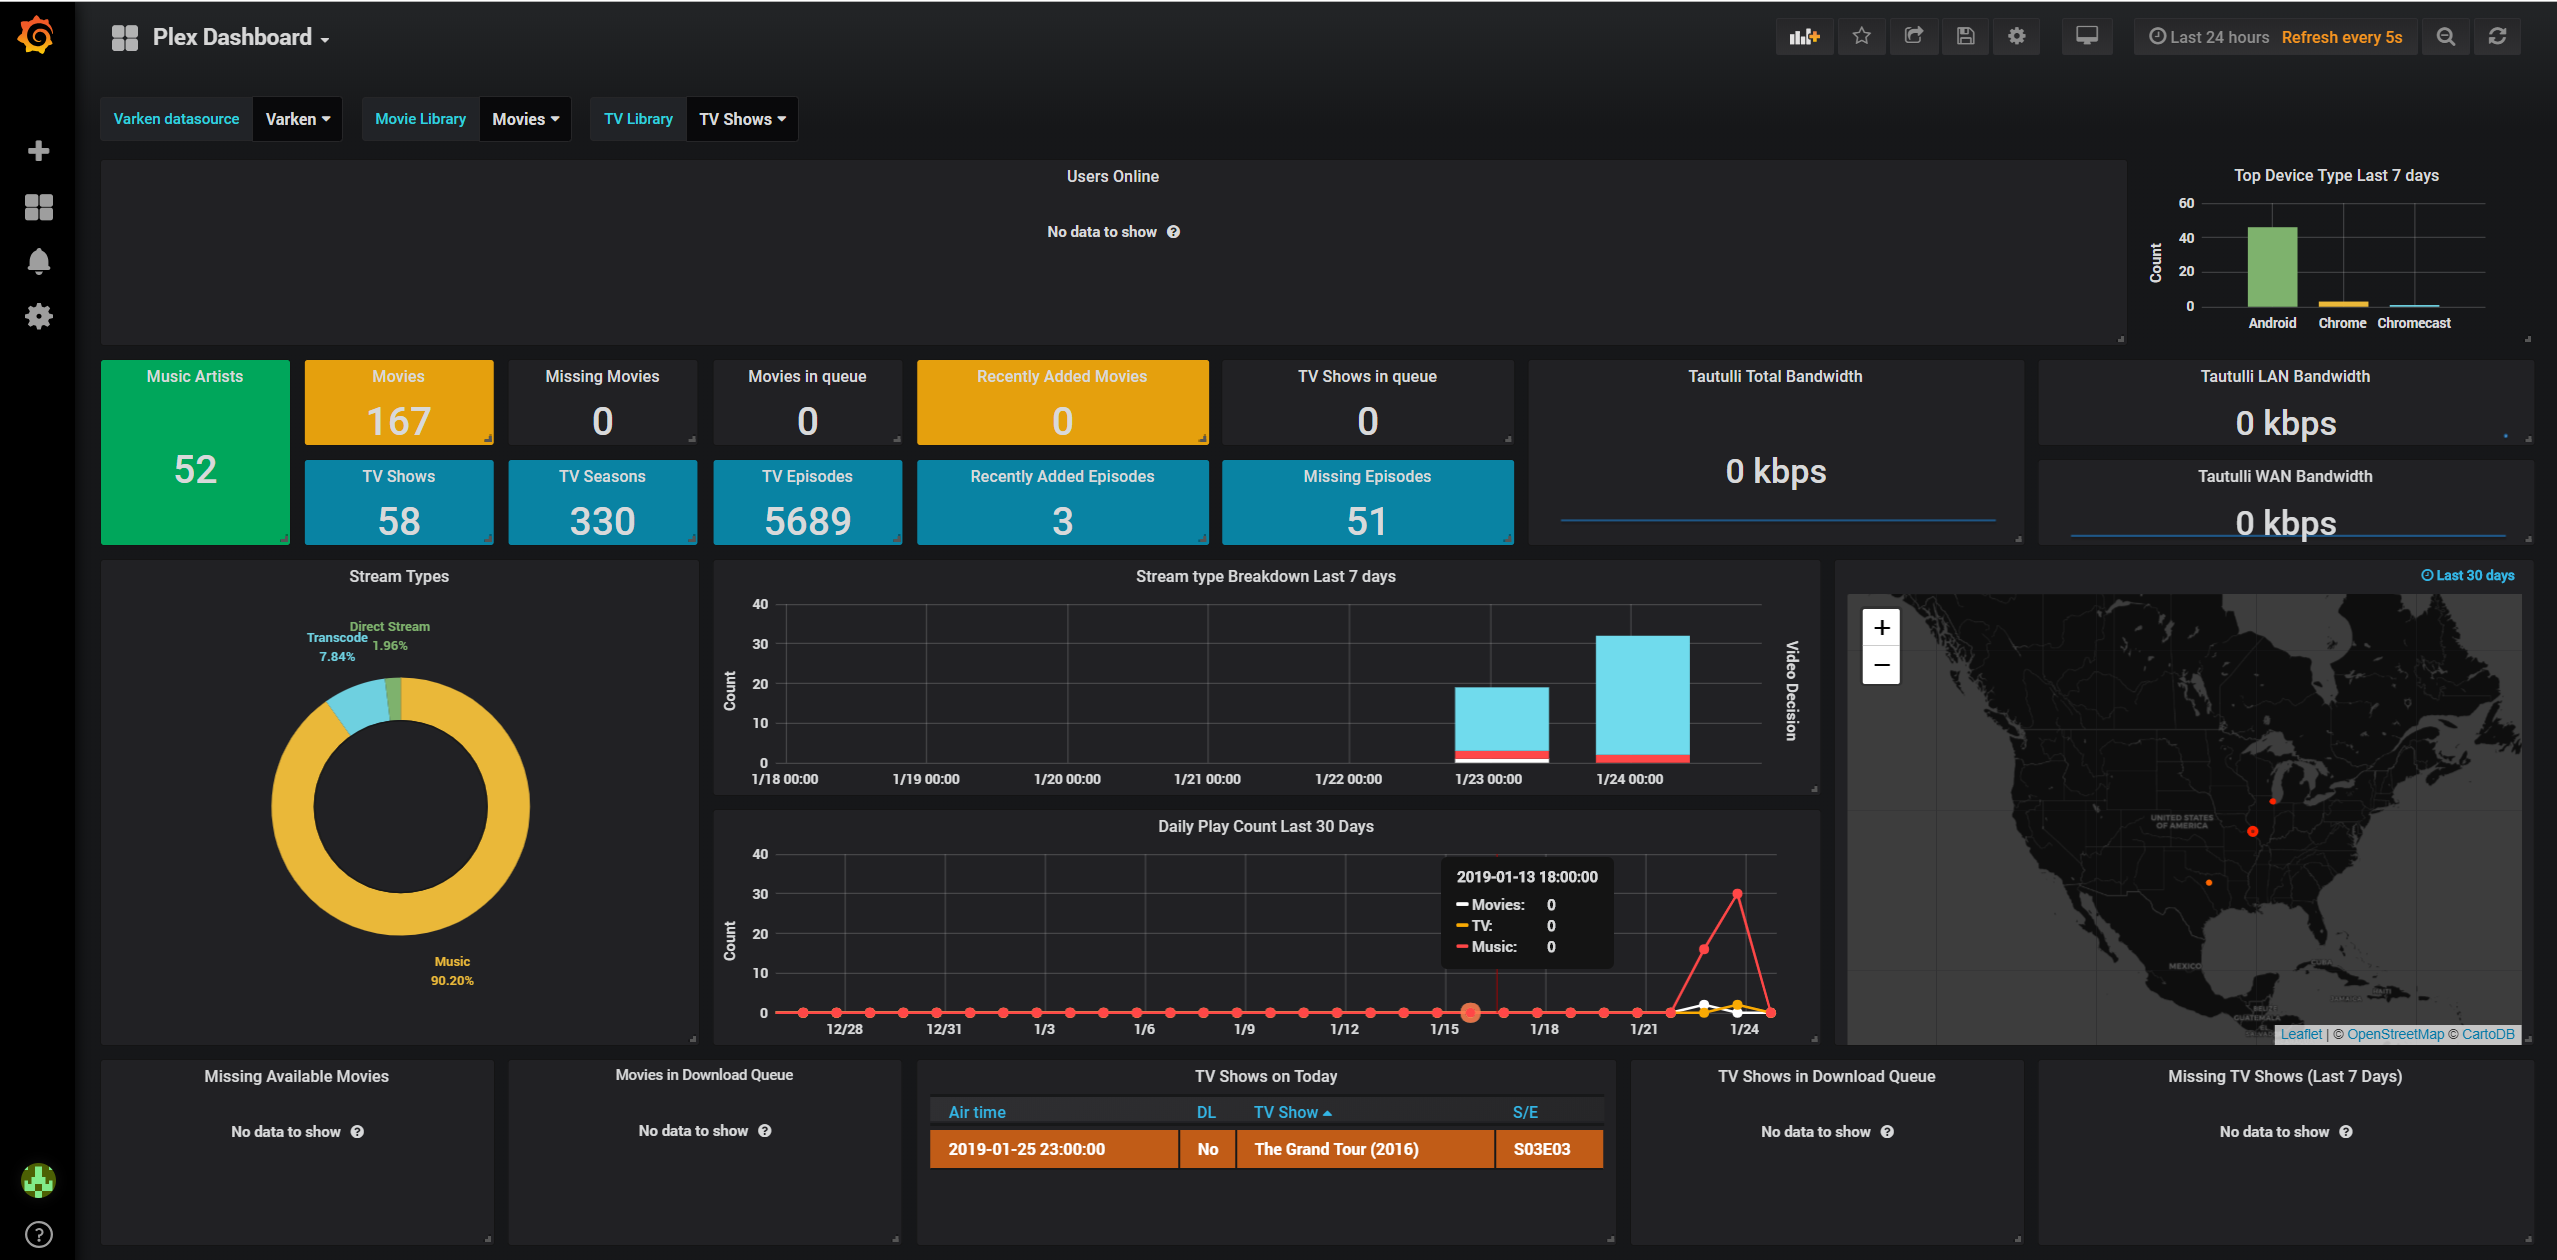
Plex: Plex

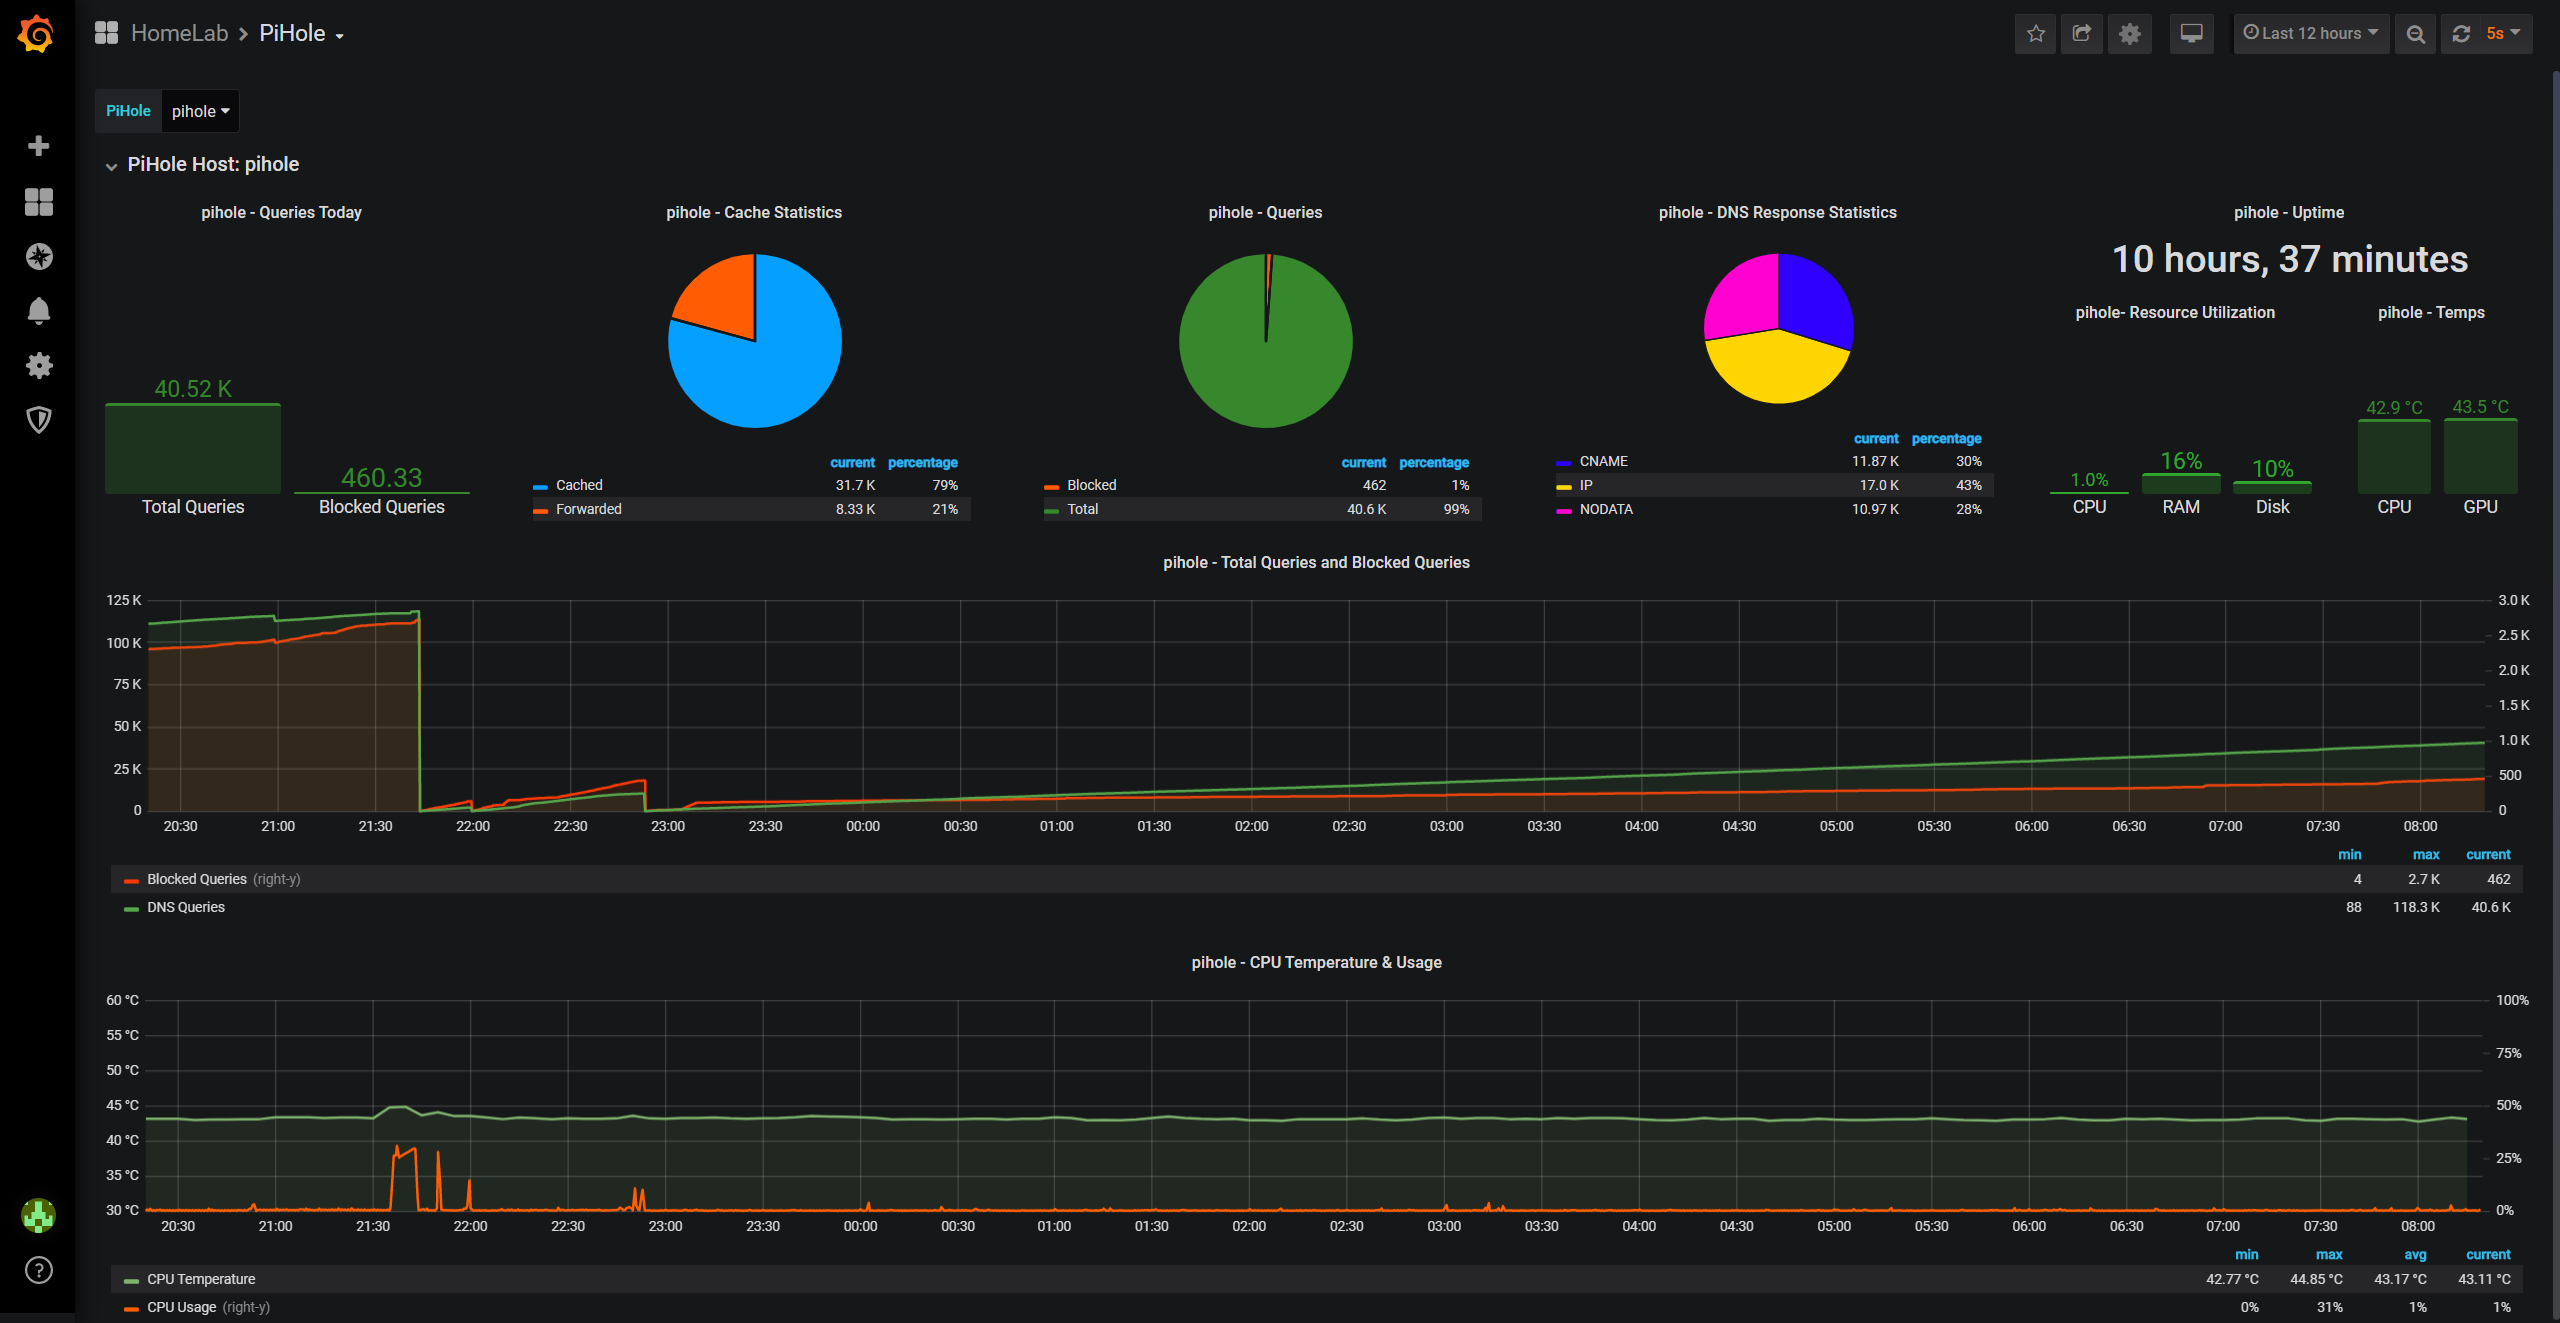
PiHole and Raspberry Pi Dashboard PiHole Dashboard

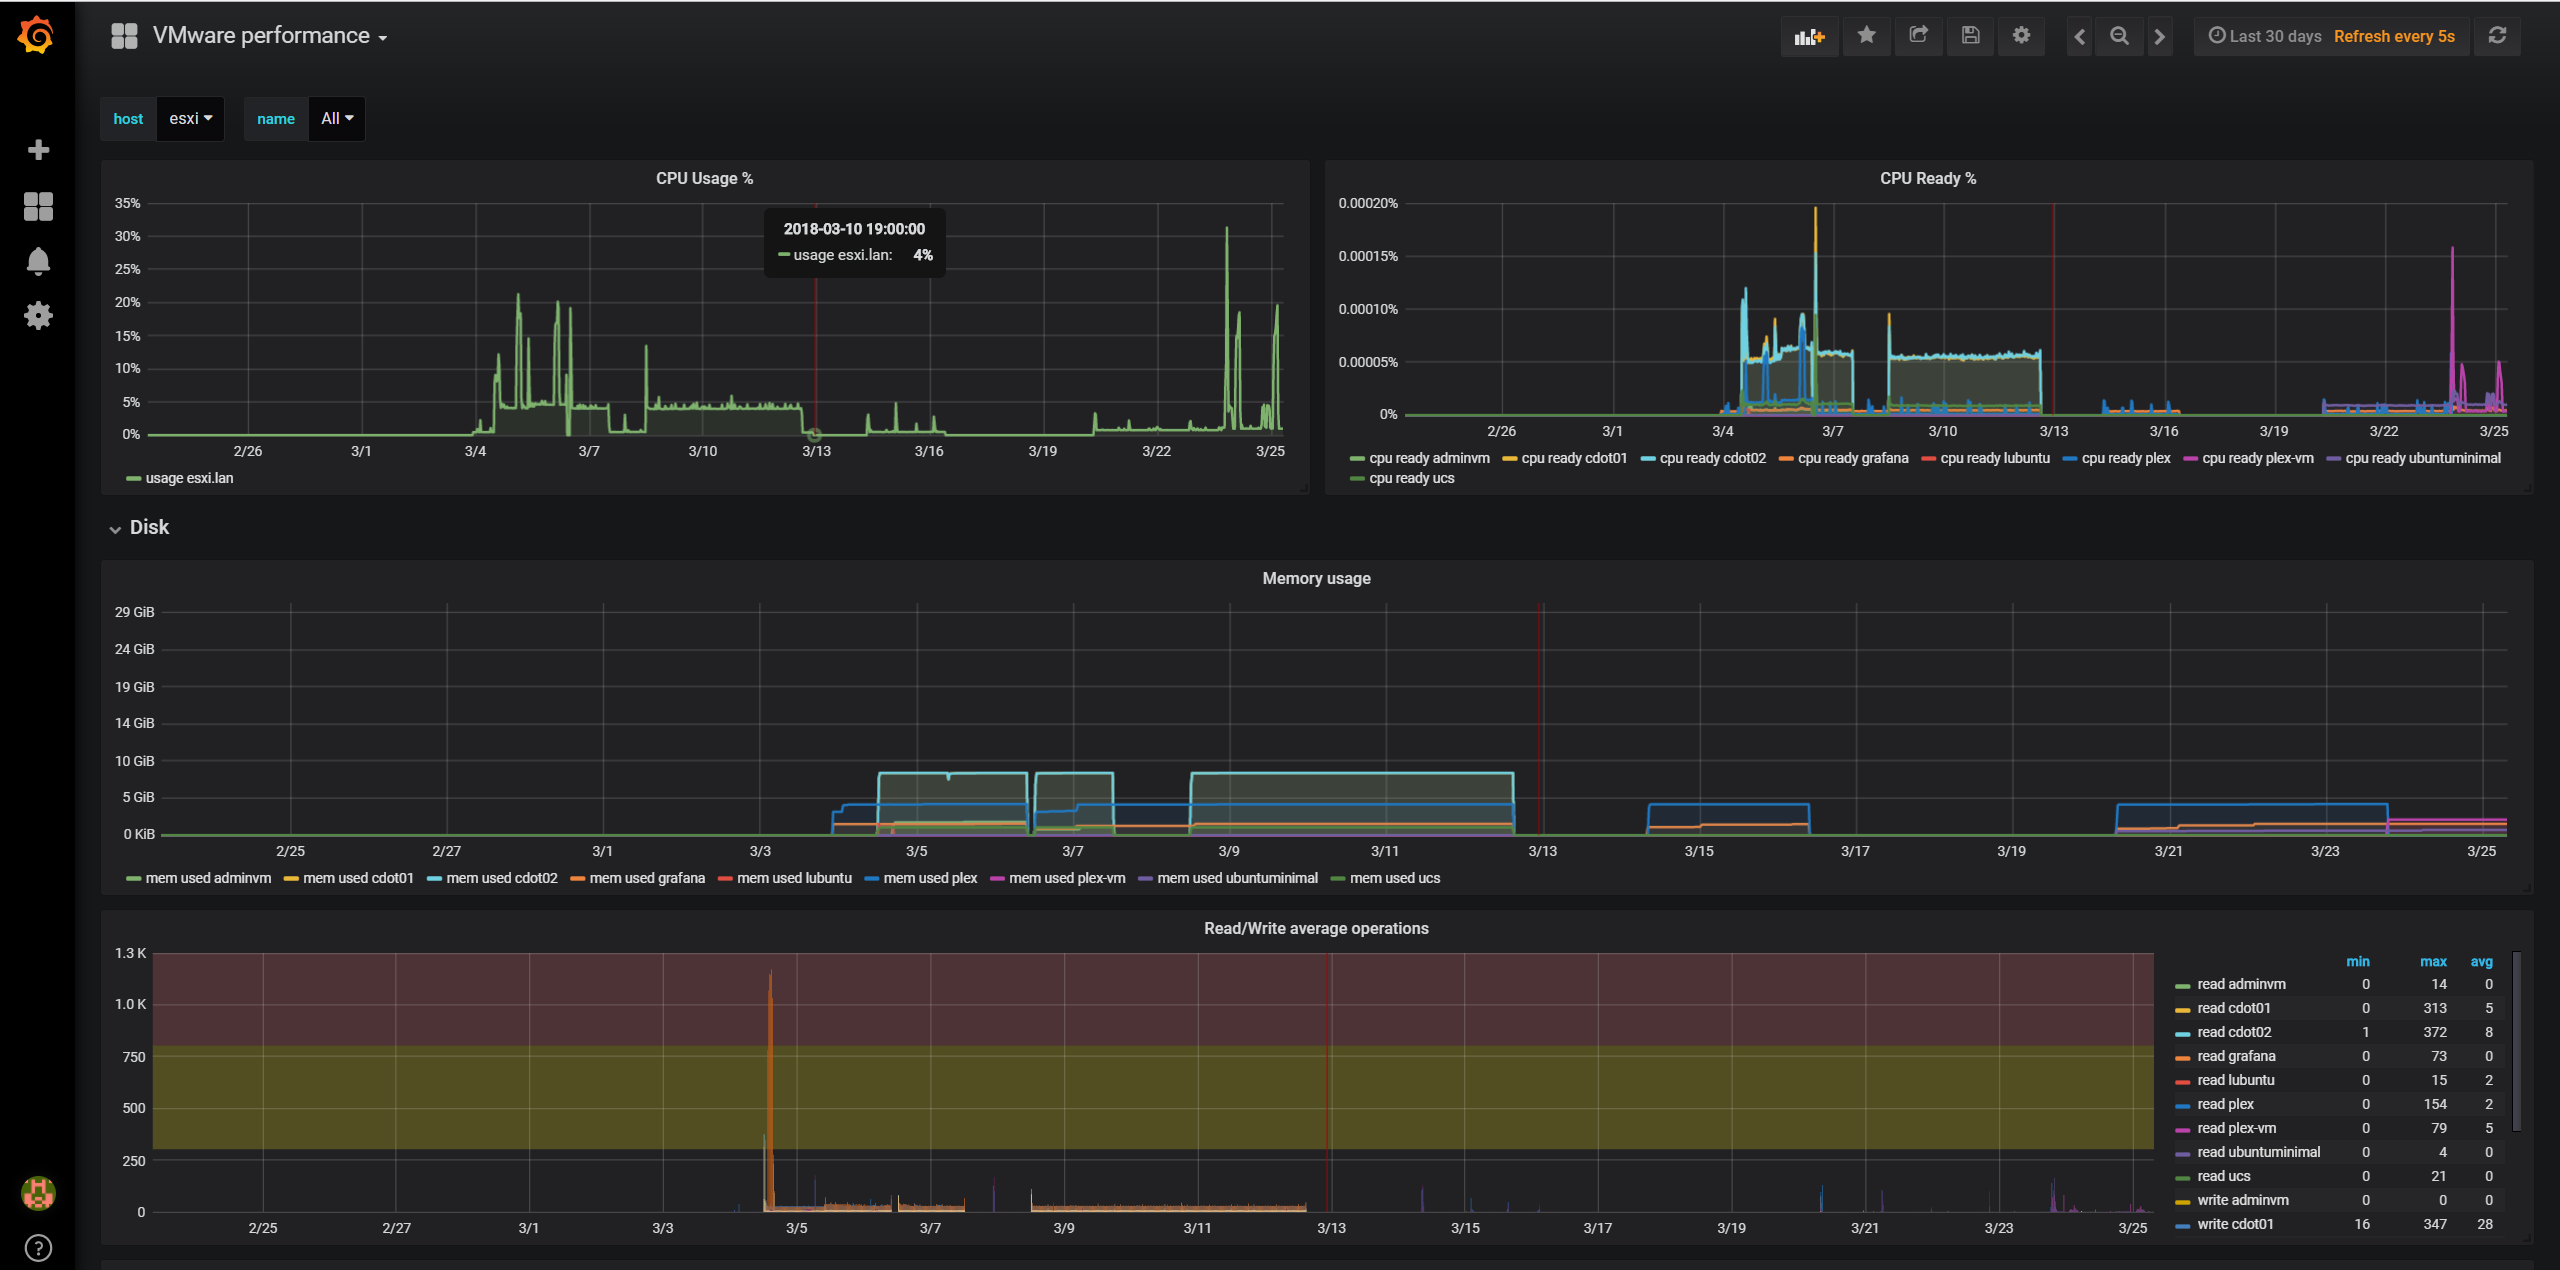
ESXi Dashboard ESXi Dashboard

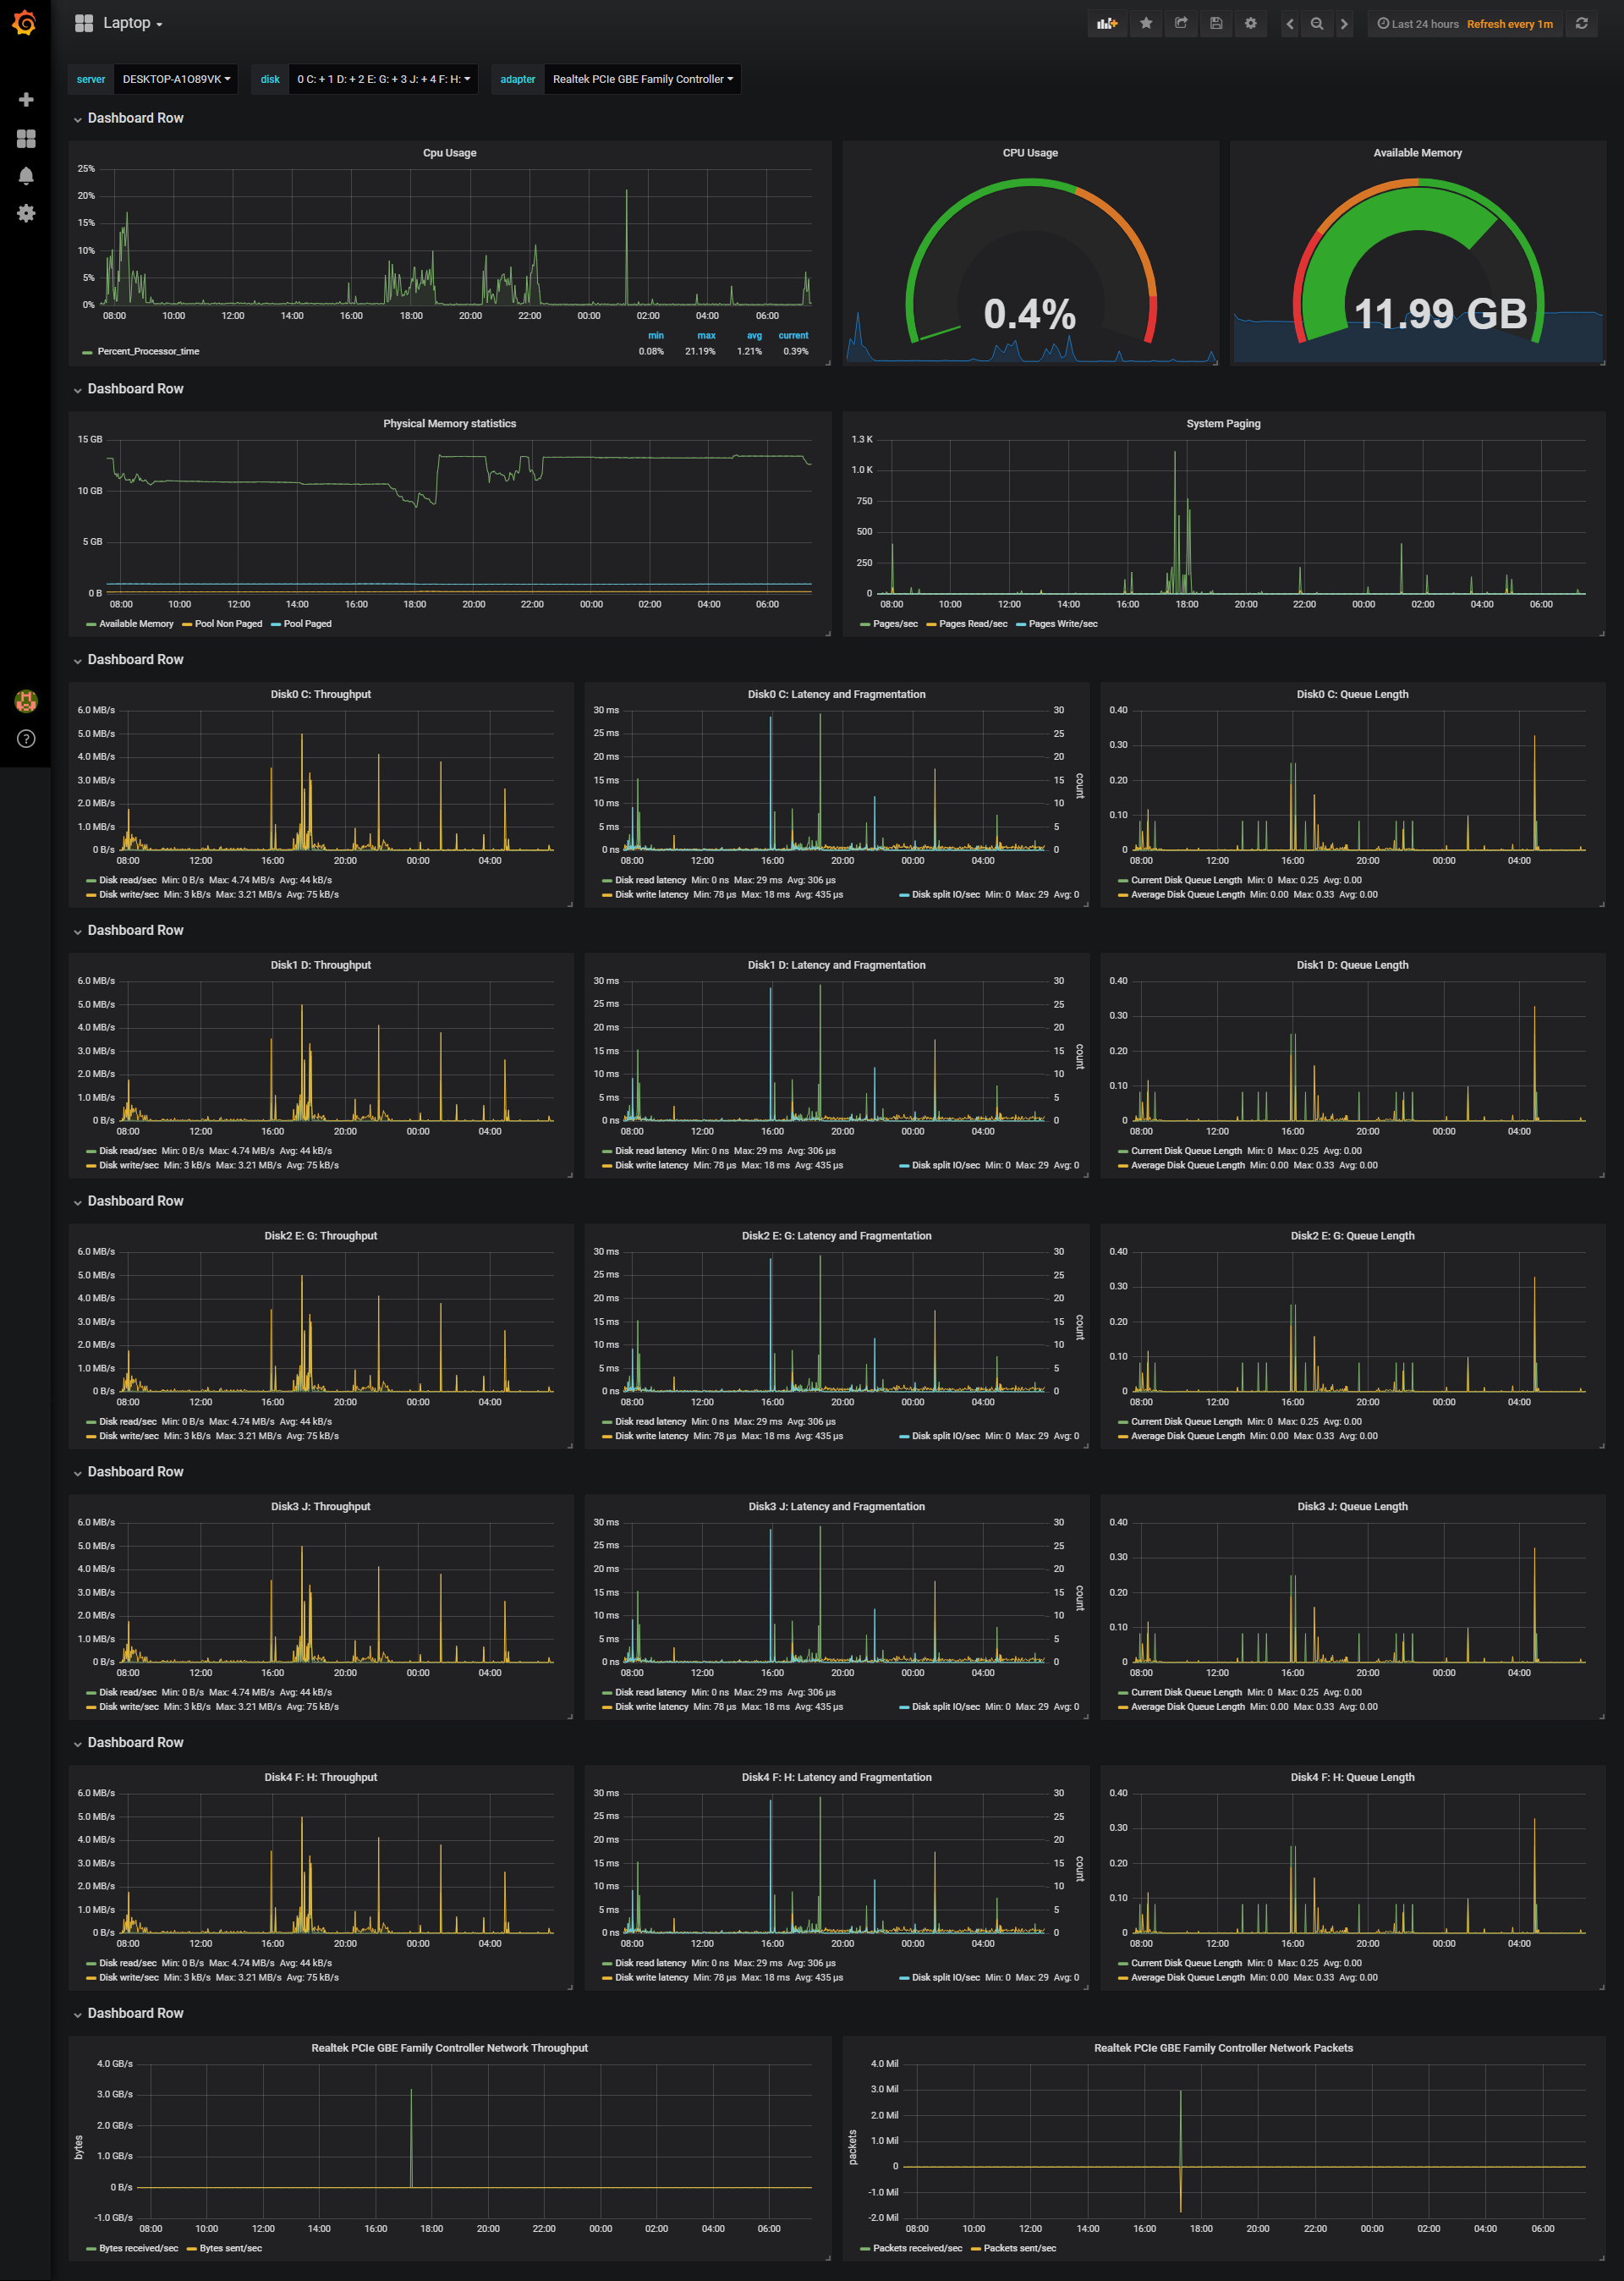
Windows Windows

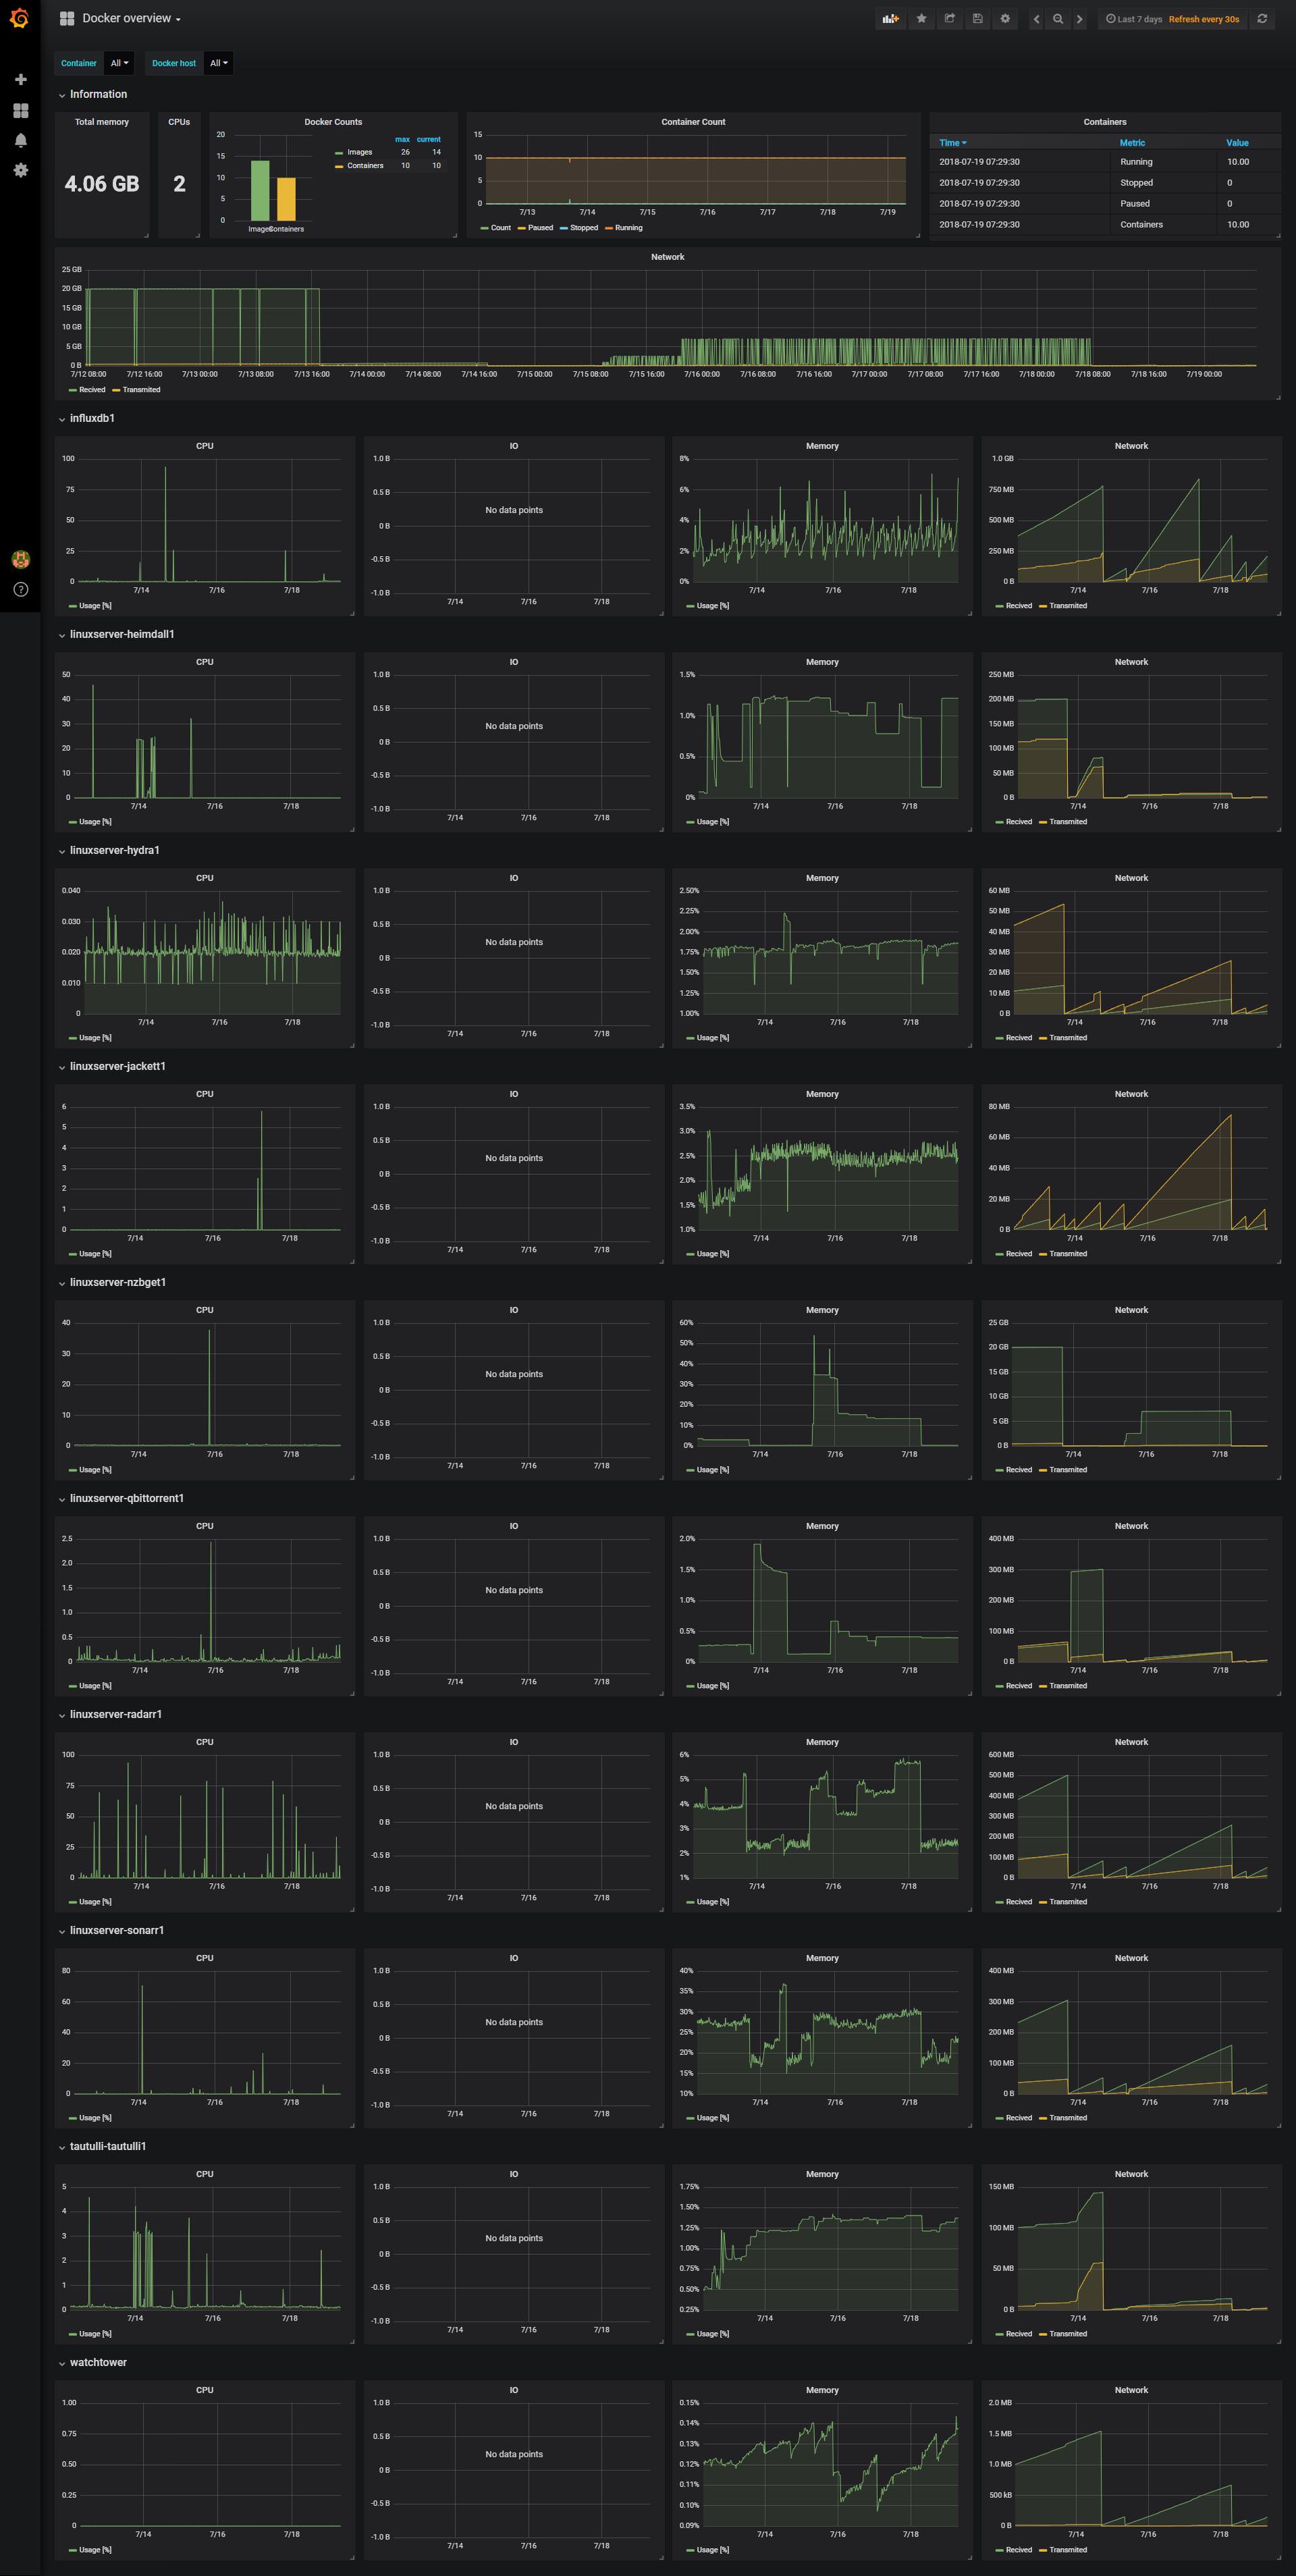
Docker Dashboard Docker Dashboard

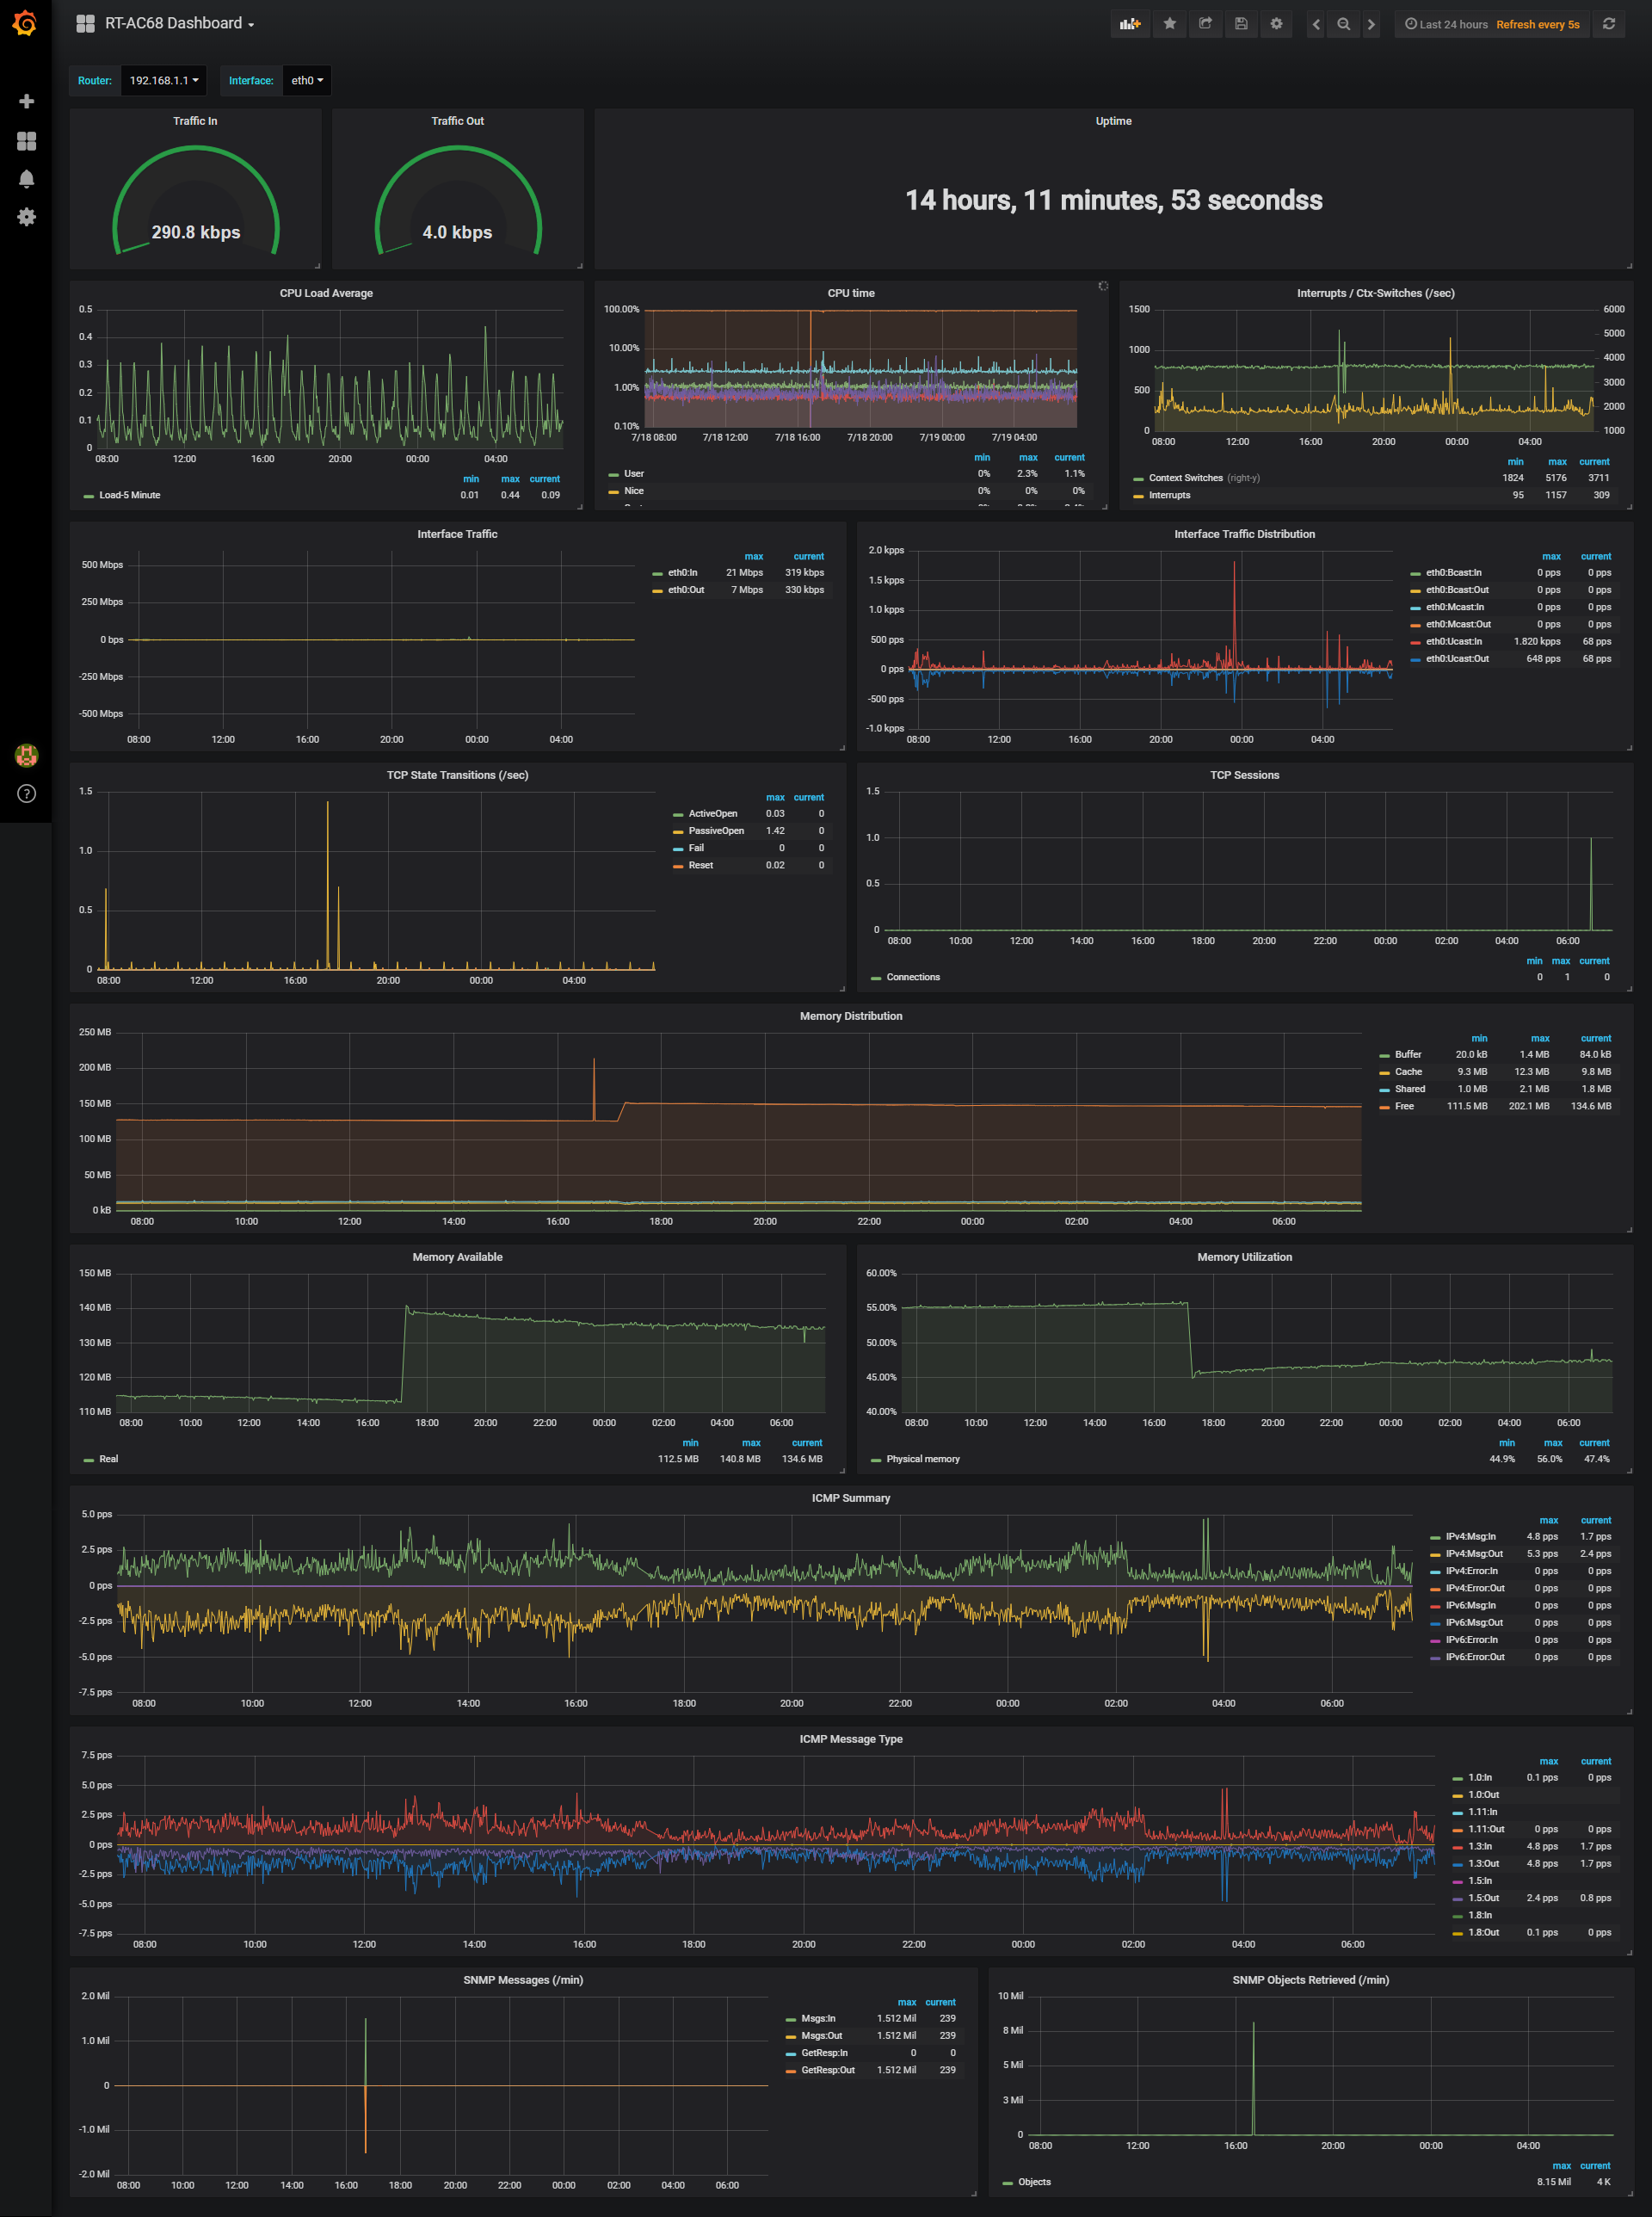
Asuswrt-Merlin Router (ASUS RT-AC68): ASUS RT-AC68
Raspberry Pi

Download "telegraf_pi_temp.sh" and 'chmod +x' the script. Then call it from within telegraf using "[[inputs.exec]]" (already included telegraf.conf in this repo).

PiHole

Change the address of PiHole to your PiHole's address in telegraf.conf

  1. Restart telegraf

Synology NAS

Based on: https://github.com/jperillo/Synology_dashboard_grafana

Make sure snmp-mibs-downloader is already installed on your telegraf host. It will download and install additional MIBs during install.

apt-get install snmp-mibs-downloader

then

download-mibs
  1. edit /etc/snmp/snmp.conf and comment out the 'mibs:' line. Here is what mine looks like:

      GNU nano 2.7.4                                                                                                                   
    File: /etc/snmp/snmp.conf
    # As the snmp packages come without MIB files due to license reasons, loading
    # of MIBs is disabled by default. If you added the MIBs you can reenable
    # loading them by commenting out the following line.
    # mibs :
    
    
  2. Now when you do a SNMPwalk, it will automatically translate OIDs to Names. This is what it looks like against my Synology:

    [email protected]:~ $ snmpwalk -c public -v 2c 192.168.1.5
    SNMPv2-MIB::sysDescr.0 = STRING: Linux DiskStation 3.10.102 SMP Fri Jan 26 06:46:44 CST 2018 x86_64
    SNMPv2-MIB::sysObjectID.0 = OID: NET-SNMP-MIB::netSnmpAgentOIDs.10
    DISMAN-EVENT-MIB::sysUpTimeInstance = Timeticks: (90908998) 10 days, 12:31:29.98
    SNMPv2-MIB::sysContact.0 = STRING: Redacted
    SNMPv2-MIB::sysName.0 = STRING: Synology DS416Play
    SNMPv2-MIB::sysLocation.0 = STRING: Home
    
    
  3. Get your MIBs (from here, for Synology Synology MIB download) and drop them in either of the below locations:

/home/$USER/.snmp/mibs or user/share/snmp/mibs

  1. Go through the linked page above or the snmpwalk output and make a list of OIDs you want to monitor (grep is your friend here)

  2. Add them to telegraf.conf using examples others have provided elsewhere in this thread

  3. Restart telegraf and test with the '-test' flag. To verify everything is working as expected.

VMWare

Telegraf introduced a new vsphere plugin. I will be using this instead of a custom script going forward. This plugin and details can be found here:

https://github.com/influxdata/telegraf/tree/master/plugins/inputs/vsphere

Dashboards for the metrics can be found here:

https://github.com/jorgedlcruz/vmware-grafana

Docker

DockerHost: Synology NAS (DS416Play) Telegraf: Raspberry Pi

Since I did not want to mess around with exposing docker.sock file to a remote client, I went with exposing a TCP endpoint on docker host to a remote telegraf agent.

To do this:

1. On Docker Host (Synology):

Add the endpoint details to /var/packages/Docker/etc/dockerd.json like so:

[email protected]:~$ cat /var/packages/Docker/etc/dockerd.json
{
	"hosts" : [ "tcp://synology.lan:2375", "unix:///var/run/docker.sock" ],
	"registry-mirrors" : []
}

In the above snippet, tcp://synology.lan:2375 Is the end point definition we have to add

Note: Don't change any part of the "unix:///var/run/docker.sock" definition. Synology uses to run the Docker GUI. Also, since this is a JSON file, all lines except the last line have a " , " at the end. Also note the " , " after the TCP definition.

If you want to be doubly sure, you can use https://jsonlint.com to validate the JSON contents.

Once this is done, restart the docker package from within DSM's Package center

2. On Telegraf: Add the below lines to your input plugins:

# Synology Docker
[[inputs.docker]]
  endpoint = "tcp://synology.lan:2375"
  container_names = []

3. Grafana Dashboard:

Grafana Dashboard JSON is included in this repository. Simply import it, define your data source and you should be good to go.

Plex

Plex can be monitored using Verken linked below. I have included my customized dashboard in the repo for reference.

https://github.com/Boerderij/Varken

Note that the project description data, including the texts, logos, images, and/or trademarks, for each open source project belongs to its rightful owner. If you wish to add or remove any projects, please contact us at [email protected].