<multi-chart>
Build composable, markup-based, extensible visualizations for the web.
<multi-chart> is a lit-element-based library to compose markup-driven and data-driven vizualization layers.
Motivation
While building vizualisation for the web, it is difficult to find the right balance between low-level vizualization kernel (like d3) that requires a lot of development work, and high-level black box library that are difficult to configure beyond a certain point.
<multi-chart> is a attempt to provide the best of two the worlds: low level extensible webcomponents (often wrapper around d3.js modules like d3-axis) composed together to build complex charts. The library proposes ready-to-use configurable charts, but also the building blocks for accomodating more complex use case.
This library plays well with <multi-geo> (similar library for geo charts like choropleth) and <multi-verse>, a graphical interactive multi-dimensional analysis tool. Together, they offer a markup-based alternative to tools like dc.js.
Demo and API
Demo and API are now available on netlify.
Examples
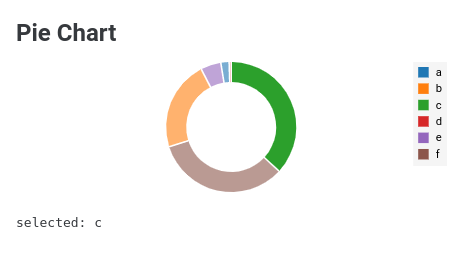
Pie
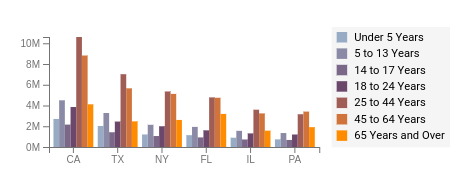
Bar
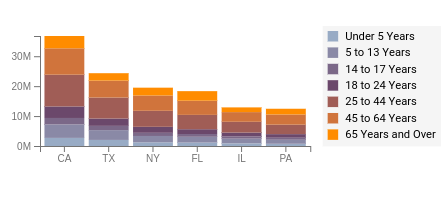
Stack
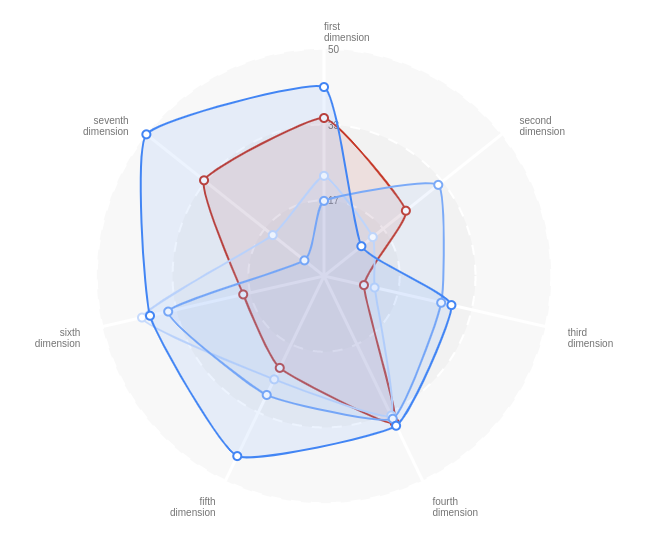
Radar
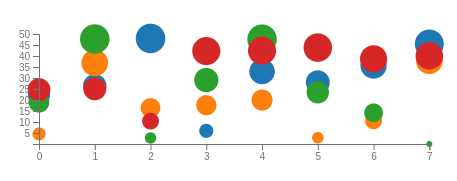
Bubble